


Abstract
Blood eosinophil (EOS) counts and EOS cationic protein (ECP) levels associate positively with major cardiovascular disease (CVD) risk factors and prevalence. This study investigates the role of EOS in cardiac hypertrophy.
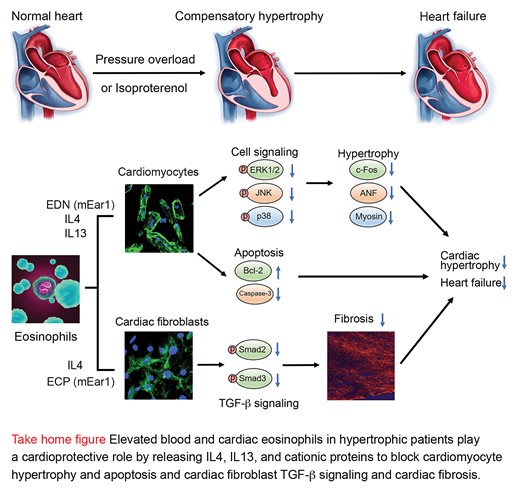
A retrospective cross-section study of 644 consecutive inpatients with hypertension examined the association between blood EOS counts and cardiac hypertrophy. Pressure overload- and β-adrenoreceptor agonist isoproterenol-induced cardiac hypertrophy was produced in EOS-deficient ΔdblGATA mice. This study revealed positive correlations between blood EOS counts and left ventricular (LV) mass and mass index in humans. ΔdblGATA mice showed exacerbated cardiac hypertrophy and dysfunction, with increased LV wall thickness, reduced LV internal diameter, and increased myocardial cell size, death, and fibrosis. Repopulation of EOS from wild-type (WT) mice, but not those from IL4-deficient mice ameliorated cardiac hypertrophy and cardiac dysfunctions. In ΔdblGATA and WT mice, administration of ECP mEar1 improved cardiac hypertrophy and function. Mechanistic studies demonstrated that EOS expression of IL4, IL13, and mEar1 was essential to control mouse cardiomyocyte hypertrophy and death and cardiac fibroblast TGF-β signalling and fibrotic protein synthesis. The use of human cardiac cells yielded the same results. Human ECP, EOS-derived neurotoxin, human EOS, or murine recombinant mEar1 reduced human cardiomyocyte death and hypertrophy and human cardiac fibroblast TGF-β signalling.
Although blood EOS counts correlated positively with LV mass or LV mass index in humans, this study established a cardioprotective role for EOS IL4 and cationic proteins in cardiac hypertrophy and tested a therapeutic possibility of ECPs in this human CVD.
1. Introduction
Eosinophils (EOS) develop in the bone marrow under the control of transcription factor GATA1 and cytokines such as IL3 and IL5. These myeloid cells migrate to the site of inflammation. Prior population studies indicate EOS involvement in cardiovascular diseases (CVD). In a retrospective study of 331 percutaneous coronary intervention patients for ST-segment elevation myocardial infarction, EOS-to-leucocyte ratio (ELR) within 24 h after admission was significantly lower in patients with major adverse cardiac events (MACE) within 1 year of follow-up. Multivariate regression test showed that ELR < 0.1 independently predicted MACE (OR = 0.38, P < 0.0001).1 In the England CALIBER program of 775 231 individuals and 55 004 with CVD, a strong correlation occurred between low EOS count and heart failure (HR = 2.05).2 These clinical observations suggest a cardioprotective role of EOS. Yet, other studies yielded the opposite conclusion. From 3742 patients undergoing coronary angiography, high blood EOS counts were associated positively with the major cardiovascular risk factors and CVD prevalence.3 In an England Biobank of 478 259 individuals, 1377 died of CVD and 8987 died of others during 7 years of follow-up. The CVD mortality group had significantly higher blood EOS counts than those of total death (n = 13 482) or alive (n = 464 797).4 With these conflicting clinical results, whether EOS play a role in CVD remains unsettled. EOS release granules to exert their activities, including cytokines and growth factors engaged in cell–cell interaction, cellular and humoral immunity, tissue regeneration and repair, angiogenesis, fibrosis, and metabolic homeostasis. EOS also contain their specific cationic proteins, such as EOS cationic protein (ECP), EOS-derived neurotoxin (EDN), EOS peroxidase, and major basic protein. As a sensitive marker of EOS activation, plasma ECP levels were associated with coronary atherosclerosis and predicted clinical events.5
Here, we revealed a positive correlation of blood EOS counts with cardiac hypertrophy by echocardiography in a retrospective cross-section analysis. Using both the pressure overload- and β-adrenoreceptor agonist isoproterenol (ISO)-induced cardiac hypertrophy in EOS-deficient ΔdblGATA mice and cultured human and mouse cardiomyocytes, cardiac fibroblasts, and aortic or cardiac endothelial cells (ECs), we demonstrated a cardioprotective role of EOS-derived IL4 and ECPs, including human ECP, human EDN, and mouse mEar1 in inhibiting human and mouse cardiomyocyte hypertrophy and death, and blocking cardiac fibroblast TGF-β signalling and fibrotic protein synthesis.
2. Materials and methods
For a full description of the methods used, see Supplementary material online.
2.1 Human EOS count and echocardiographic analysis
To assess the relationship between EOS and cardiac response to pressure overload, we retrospectively reviewed the medical records of 2531 consecutive inpatients who suffered from primary hypertension without proven significant coronary artery diseases (coronary artery stenosis >50% or history of myocardial infarction) from January 2016 to December 2017 in Guangdong Cardiovascular Institute, Guangdong Provincial People’s Hospital, Guangzhou, China. Of these 2531 patients, we excluded those with diseases that may affect cardiac hypertrophy independent of hypertension and those with diseases that may cause increased blood EOS counts independent of cardiac hypertrophy. The remaining 644 patients were selected for final analysis (see Supplementary material online, Table S1). The use of anonymous medical records was pre-approved by the Partners Human Research Committee (protocol #2010P001930/BWH) and the use of human subjects adhered to the principles outlined in the Declaration of Helsinki. All measurements of the septum and the posterior wall were performed at the end of diastole, including the endocardial thickness, according to recommendations of the American Society of Echocardiography.6 The left ventricular (LV) mass was calculated with the modified Devereux formula:7 0.80 × 1.04 × {[interventricular septum thickness (IVS) + LVID; d + LV posterior wall thickness (LVPWT)]3 − [LV internal diameter (LVID); d]3} + 0.6 (g). The LV mass was then indexed for body surface area (DuBois formula) to give the LV mass index. LV dimensions were measured according to the recommendations of the American Society of Echocardiography.
2.2 Mice and cardiac hypertrophy
Age-matched 6–8 weeks old male ΔdblGATA and wild-type (WT) control mice were all purchased from the Jackson Laboratory (Bar Harbor, ME, USA). eoCRE+/– mice were gift from Dr Elizabeth Jacobsen (Mayo Clinic Arizona, Arizona). These mice were generated by inserting the Cre recombinase gene in frame at the AUG start codon of EOS Epx (EOS peroxidase) gene. Mice were then crossbred with the (flox-stop-flox)-GFP (green fluorescent protein) reporter mice (B6.Cg-Gt(ROSA)26Sortm6(CAG-ZsGreen1)Hze/J (GFP+/–) to generate the eoCRE+/–GFP+/– mice.8eoCRE+/–GFP+/– mice did not differ from WT mice in peripheral blood white blood cells, lymphocytes, monocytes, neutrophils, and blood and bone marrow EOS counts. Only EOS were GFP-positive in these mice.8 Mouse cardiac hypertrophy was induced by both transverse aortic constriction (TAC) and by ISO treatment. The TAC pressure overload was performed as previously described when mice were under anaesthesia with 1.5% isoflurane.9 The TAC mice were harvested 7, 14, and 28 days after operation. Mice at Day 0 without surgery were used as the baseline controls. Sham-operated mice underwent a similar surgical procedure without constriction of the aorta. In ISO-induced hypertrophy in mice, mice received persistent subcutaneous infusion of ISO at 30 mg/kg/day from an osmotic minipump as previously reported.10 To determine the role of EOS in hypertrophic hearts, EOS-deficient ΔdblGATA mice received adoptive transfer of EOS from WT or Il4–/– mice, followed by induction of cardiac hypertrophy with either TAC or ISO. To ISO-induced hypertrophic WT and ΔdblGATA mice, we also gave an intraperitoneal injection of mouse recombinant mEar1 (2 µg per mouse per day for 7 or 14 days), followed by cardiac function analysis. Mice received one dose of meloxicam at 5 mg/kg by subcutaneous injection before the survival surgery. Mice also received one dose of buprenorphine at 0.1 mg/kg subcutaneous injection after the survival surgery. Mice were then received one dose of meloxicam at each 24 h for 48 h and one dose of buprenorphine at every 8–12 h for 48 h. Mice were euthanized by CO2 overdose at a flow rate of 10–30% of the cage volume per minute. Mice received one dose of meloxicam at 5 mg/kg by subcutaneous injection before the survival surgery. Mice also received one dose of buprenorphine at 0.1 mg/kg subcutaneous injection after the survival surgery. Mice then received one dose of meloxicam at each 24 h for 48 h and one dose of buprenorphine at every 8–12 h for 48 h. Mice were euthanized by CO2 overdose at a flow rate of 10–30% of the cage volume per minute.
All procedures were conformed to the guidelines from the NIH Guide for the Care and Use of Laboratory Animals and conducted according to the protocol approved by the Brigham and Women's Hospital Institutional Animal Care and Use Committee (Protocol #2016N000422).
2.3 Complete blood cell count
To determine the complete blood cell counts, peripheral blood was collected in 8 week- and 6 month-old mice by tail incision. Blood samples were diluted 1:10 with the Cellpack solution containing EDTA and prostaglandin E1 and blood cell counts, including white blood cell, red blood cell, platelet, neutrophil, EOS, lymphocyte, and monocyte, haemoglobin concentration, and haematocrit were measured in a Sysmex XT-2000i automated haematology analyser.11
2.4 Echocardiography measurements
Transthoracic two-dimensional (2D) parasternal short axis M-mode echocardiogram was performed using the Vevo 2300 system with a 30-MHz transducer. Mice were under a conscious state. M-mode tracings at mid-papillary muscle level were recorded to measure LV wall thickness and LVID. Percentage of fraction shortening (FS%) and ejection fraction (EF%) and other cardiac functions were calculated by the built-in software package.
2.5 Tissue harvest and histological analysis
For histology, heart tissues were embedded into optimum cutting temperature compound. Heart sections (5 µm) were used for immunofluorescent staining with cleaved caspase-3 antibody, together with α-smooth muscle actin (SMA) monoclonal and cardiac myosin heavy chain polyclonal antibody. Collagen deposition was examined by Sirius red staining or fluorescent staining with Collagen I and III antibodies. Haematoxylin and eosin was performed for histopathology, and TUNEL staining to evaluate cardiac apoptosis. To quantify the individual cardiomyocyte size, sections were stained with rhodamine-labelled wheat germ agglutinin (WGA) and DAPI. eoCRE+/–GFP+/– mice8 were used to determine whether EOS were the major source of IL4 and mEar1. At 1 week after TAC, 5 µm heart sections were prepared and used for immunofluorescent double staining with GFP and IL4 antibodies.
2.6 Plasma mEar1 levels determination and Coomassie blue staining
Plasma sample at 2 µL each was boiled for 5 min in a reducing loading buffer and separated on 10% SDS-PAGE, and then transferred to a polyvinylidene fluoride (PVDF) membrane. The membrane was blocked in 5% non-fat milk for 2 h, and then incubated with mouse anti-mouse mEar1 at 4°C overnight, followed by incubation with an anti-mouse IgG, HRP-conjugated secondary antibody for 2 h. The resulting signal was detected using the Amersham ECL Prime Western Blotting Detection Reagent. Meanwhile, a parallel gel was used for Coomassie blue staining to ensure equal protein loading.
2.7 Heart, spleen, bone marrow, and blood single-cell preparation and flow cytometry
The heart was perfused with PBS and removed from the mouse. Ascending aorta and pulmonary artery were completely removed and the remaining heart was minced into small pieces and digested in a 0.1% collagenase B. After digestion, cells were neutralized using 1640 culture medium, washed twice, and then isolated using density-gradient centrifugation. Splenocytes were collected after depleting the red blood cells. Bone marrow cells were collected from mouse femurs and tibias, centrifuged at 300 g for 5 min, followed by lysing red blood cells. Blood was taken from the mouse heart, and the peripheral blood cells were collected after lysing the red blood cells as above. Flow cytometry (FACS) was performed to quantify different types of immune cells in heart, spleen, bone marrow cell preparations, and in peripheral blood. Cells were washed and stained with the Fixable Viability Dye eFluor™ 450 or Fixable Viability Dye eFluor™ 660 and cell surface marker antibodies including CD45.1, CD45, CD11b, CD11c, Siglec-F, F4/80, Ly6C, Ly6G, MHC-II, CD3, CD4, and CD8.
2.8 Mouse EOS differentiation
Mouse EOS were prepared and cultured as previously reported.12 Briefly, bone marrow cells were collected and plated in an 80 cm2 flask and cultured at 106 cells/mL in a base media containing mouse stem cell factor and Flt3-L for 2 days. On Day 2, one-half of the media from each flask was replaced with a fresh medium containing SCF and Flt3-L. On Day 4, culture media were replaced with the same media containing IL5. Half of the culture media were changed with fresh media containing IL5 every 2 days until the 14th day. To prepare the EOS lysate for cell treatment, EOS were differentiated for 14 days and then resuspended in cell culture medium at 107 cells/mL, followed by freezing and thawing three times. Cell lysates were stored at −80°C, centrifuged at 3000 rpm, and supernatant protein concentrations were determined before use.
2.9 Adult mouse ventricular cardiomyocyte isolation and treatment
Adult cardiomyocytes were isolated from mouse heart using the Langendorff method as previously reported.13 Briefly, the mouse was injected with 200 µL heparin (100 IU/mouse) by i.p. 10 min before continuous anaesthesia with 2% isoflurane inhalation. After anaesthesia, the heart was removed and transferred to a 100-mm dish containing freshly prepared cold calcium-free perfusion buffer. The connective tissues were removed from the heart and then slipped the heart on to the Langendorff apparatus. The heart was perfused with the calcium-free perfusion buffer at a flow rate of 4 mL/min till the effluents became clear and then switch to digestion buffer containing type-II collagenase and CaCl2 at a flow rate of 4 mL/min for 7 min. After digestion, the heart was teased and transferred to a 15-mL tube by adding 7.5 mL calcium solution I. The cardiomyocyte pellet was separated by centrifugation and resuspended in 10 mL calcium solution I with a supplement of 100 µL of 200 mM ATP. Cells were centrifuged and resuspended in 10 mL calcium solution II. This step was repeated using calcium solution III and calcium solution IV, respectively. Cardiomyocytes were plated in a laminin pre-coated six-well plate at a density of 25 000 cell/mL in plating MEM medium. To determine the expression of mEar1 in cardiomyocytes, cells with or without ISO treatment in a four-well slide were fixed with cold acetone for 1 min and immunofluorescent stained with rabbit anti-mouse mEar1 monoclonal antibody.
2.10 Mouse cardiac fibroblast isolation and treatment
Cardiac fibroblasts were prepared from the cardiomyocyte–fibroblast mixture by separating the two types of cells using centrifugation at 20 g. Fibroblasts on the top layer were collected and cultured in DMEM containing 10% FBS. Cells from second to third passages were used. Cardiac fibroblasts at −70% confluence on a six-well plate were starved for 24 h and then pre-treated with or without mouse EOS lysates, mEar1, IL4, or anti-mEar1 antibody with or without EOS lysate for 12 h, then treated with or without TGF-β for 30 min to detect Smad2/3 phosphorylation, or 24 h to detect α-SMA, Collagen I and III protein and mRNA levels.
2.11 Human EOS culture
Human EOS were isolated from human donor blood by negative selection using MACSxpress® Whole Blood Eosinophil Isolation Kit. Briefly, the leucocyte-rich buffy coat was purchased from Massachusetts General Hospital. Cells were then isolated using density-gradient centrifugation at 800 g for 30 min. The plasma and the lymphocytes were carefully removed, and the cell layer containing EOS between 75% Percoll and 65% Percoll was collected. Cells were then washed by PBS and autoMACS Pro Washing Solution twice separately. And antibody staining was performed. The cells with antibodies were placed in the magnetic field of the MACSxpress Separator for 15 min. The magnetically labelled cells were adhered to the wall of the tube while the supernatant containing EOS was carefully collected. The concentration of human EOS lysate is 105 cells/mL in 1640 culture medium.
2.12 Human cardiomyocyte and cardiac fibroblast culture and treatment
Human cardiomyocytes were differentiated from the induced pluripotent stem (iPS) in cardiomyocyte growth medium at 37°C with 5% CO2 for 60 days. Cells were seeded onto a eight-well chamber slide and cultured for 48 h, followed by overnight pre-treatment with human ECP, human EDN, mouse mEar1, and human EOS lysate at 1 × 10⁴ EOS/mL. Cells were then treated with or without 10 µM ISO for 36 h to detect cardiomyocyte death and hypertrophy. Cells were washed with saline and fixed with 4% paraformaldehyde. In Situ Cell Death Detection Kit was used to detect cell death. The mean TUNEL-positive cell percentage was calculated. To determine cardiomyocyte hypertrophy, paraformaldehyde-fixed section was blocked in 5% BSA, followed by anti-human β-myosin heavy chain immunofluorescent staining. The nuclei were counterstained with DAPI. The mean surface area was evaluated after measuring 40 cells using the Image-Pro Plus software. Human cardiac fibroblasts from adult heart ventricles were cultured in fibroblast growth medium-3 at 37°C with 5% CO2. Cells were seeded on a six-well plate for 24 h and pre-treated overnight with human ECP, human EDN, and mouse mEar1 at various concentrations (0–1000 ng/mL). Cells were then treated with or without TGF-β for 30 min followed by immunoblot analysis to detect p-Smad-2, p-Smad-3, Smad-2, Smad-3, and glyceraldehyde 3-phosphate dehydrogenase (GAPDH) to ensure equal protein loading.
2.13 Human aortic EC and mouse heart EC culture and treatment
Human aortic ECs were isolated from heart transplant donors according to previously established methods.14 Cells were seeded on a six-well plate for 24 h and pre-treated with human ECP, human EDN, mouse mEar1, and human EOS lysate overnight, followed by treating cells with and without TNF-α for 4 h. Immunoblot analysis tested the expression of human vascular cell adhesion molecule (VCAM)-1, intercellular adhesion molecule (ICAM)-1, and GAPDH. Mouse hearts were removed from 1–2 days old pup and put in a 10-cm dish containing 15 mL cold isolation medium. Hearts were cut into small pieces and incubated with collagenase B in a 50-mL tube in 37°C water bath. The tube was vortexed every 10 min for 4–5 times. Digestion was stopped by adding double volumes of isolation medium. Cells suspension was centrifuged and resuspended in 1 mL PBS containing 15 µL anti-mouse PECAM-1 Dynabeads, and incubated on a rotator for 10 min at room temperature. The tube containing cells was mounted on a magnetic separator and sit for 1–2 min. The supernatant was removed and cells were resuspended in a growth medium. ECs with beads were plated on a gelatin-coated plate. When cells approached confluence in 5–9 days, pure EC populations are obtained by magnetic bead separation using the ICAM-2 Dynabeads. Cells were cultured on a six-well plate to complete confluence and pre-treated with human ECP, human EDN, and mouse mEar1 overnight, followed by treating cells with and without TNF-α for 8 h. Immunoblot analysis tested the expression of mouse VCAM-1, ICAM-1, and GAPDH.
2.14 Western blotting
The protein levels of total ERK1/2, p-ERK1/2, total JNK, p-JNK, total p38, p-p38, Bcl-2, cleaved caspase-3, and GAPDH from cardiomyocytes, the protein levels of phosphorylated p-Smad-2 and -3, α-SMA, Collagen I and III, and GAPDH in cardiac fibroblasts, and the protein levels of mEar1, IL4, and GAPDH in heart tissue extracts, mouse EOS, and cardiomyocytes were determined by immunoblot analysis. Recombinant mEar1 was also used as a positive control. Protein extracts (1–40 µg per well) from different tissues or cells were separated on 8–14% SDS-PAGE and then transferred to a PVDF membrane. After blocking in 5% non-fat milk for 2 h, the membrane was incubated with different antibodies at 4°C overnight, followed by incubation with a HRP-conjugated secondary antibody for 2 h. The signals were detected using the Amersham ECL Prime Western Blotting Detection Reagent. GAPDH was used to ensure equal protein loading.
2.15 RNA isolation and real-time PCR
Total RNA from hearts, cardiomyocytes, or cardiac fibroblasts was prepared using the TRIzol™ Reagent and reverse-transcribed into cDNA using the High-Capacity cDNA Reverse Transcription Kit. The relative mRNA levels of target genes were quantified using the iTaq UniverSYBR Green SMX 5000 with the ABI PRISM 7900 Sequence Detector system. Each reaction was performed in duplicate, and changes in relative gene expression levels were normalized to the endogenous house-keeping gene GAPDH using the ΔΔCt method. Results were expressed as fold of change relative to the control samples as the baseline.
2.16 ECP homology modelling and structural analysis
The high-resolution structures of human ECP (PDB code 1DYT) and EDN (PDB code 1HI3) and homology models of mEAR1 built based on these structures were used for structural characterization. Energy optimization of the mEAR1 protein model was performed using biased probability Monte Carlo algorithm. Structural characterization and modelling were performed using the ICM molecular modelling software (Molsoft LLC, San Diego, CA, USA).
2.17 Statistical analysis
Human data were presented as mean (SD) or median (interquartile range) for skewed data. Comparisons of different tertiles used either χ2 test or one-way analysis of variance (ANOVA). Univariate and multivariate linear regression analyses detected the relationship between EOS and LV mass or LV mass index. All mouse data were expressed as mean ± standard error of means (SEM). Shapiro–Wilk test was used to determine data distribution normality. Two-tailed unpaired or paired Student’s t-tests were used to assess statistical significance between two groups of data with normally distributed variables. One-way ANOVA test followed by a post hoc Tukey’s test was used for multiple comparisons (≥3 groups) with normally distributed variables. The Kruskal–Wallis test followed by Dunn's procedure was conducted for multiple comparisons with abnormally distributed variables. P-values <0.05 were considered statistically significant. SPSS 20.0 and Prism 7 (GraphPad) software were used for statistical analysis.
3. Results
3.1 Human blood EOS counts associate positively with cardiac hypertrophy
This retrospective cross-section study consecutively selected 644 inpatients who suffered from primary hypertension but without proven significant coronary artery diseases (coronary artery stenosis >50% or history of myocardial infarction). Exclusion criteria included diseases that may affect cardiac hypertrophy independent of hypertension or those that may affect blood absolute EOS counts (AEC) as we listed in see Supplementary material online, Table S1. We divided these patients into three AEC tertiles (<0.1 × 10⁹/mL; 0.1–0.19 × 10⁹/mL; >0.19 × 10⁹/mL) as reported previously.3χ2 test showed no significant difference in gender and comorbidities with hyperuricaemia (blood uric acid level above 360 µmol/L for women and 420 µmol/L for men), hyperlipidaemia (total cholesterol ≥6.2 mmol/L, triglyceride ≥2.3 mmol/L, or LDL cholesterol ≥4.1 mmol/L), subclinical coronary atherosclerosis (30 < stenosis < 50%), carotid atherosclerosis (plaque or stenosis were detected by carotid ultrasound scan), history of stroke (including ischaemic or haemorrhagic stroke), or obstructive sleep apnoea (apnoea hypopnoea index of 15 or more events per hour according to sleep studies) among the three tertiles (P > 0.05) (see Supplementary material online, Table S2). One-way ANOVA test demonstrated no significant differences in age, blood neutrophil or lymphocyte counts, blood haemoglobin level, and systolic LVID (s), and LV EF% among the three tertiles. Yet, most other hypertrophic measures, including IVS (P = 0.003), LVPWT (P = 0.001), diastolic LVID (d, P = 0.021), LV mass (P = 2.00E−4), and LV mass index (P = 0.002), along with blood white cell counts (P = 0.042), monocyte counts (P = 2.21E−4), and AEC (P = 1.47E−150) showed significant differences among the three tertiles (see Supplementary material online, Table S2).
Spearman’s correlation test showed that the blood AEC associated significantly and positively with the LV mass (ρ = 0.136, P = 0.001) and LV mass index (ρ = 0.120, P = 0.007) (Figure 1A). In a univariate linear regression model, AEC but not other immune cells, including white blood cells, neutrophils, lymphocytes, or monocytes, correlated with the LV mass (F = 10.268, P = 0.001) and LV mass index (F = 5.551, P = 0.019). After adjusting for hypertrophic risk factors, such associations remained significant (LV mass: β = 37.617, P = 0.005 and LV mass index: β = 19.469, P = 0.015) (see Supplementary material online, Table S3). In this population, multivariate regression test showed that both age (P = 0.0001) and sex (P = 0.0003) associated with LV mass, but such associations disappeared when LV mass index was considered. In contrast, subclinical coronary atherosclerosis with stenosis between 30 and 50% associated significantly with both LV mass (P = 1.50E−5) and LV mass index (P = 2.50E−4) (see Supplementary material online, Table S3), consistent with the observation from the Dallas Heart Study that subclinical coronary atherosclerosis associated with cardiac hypertrophy.15
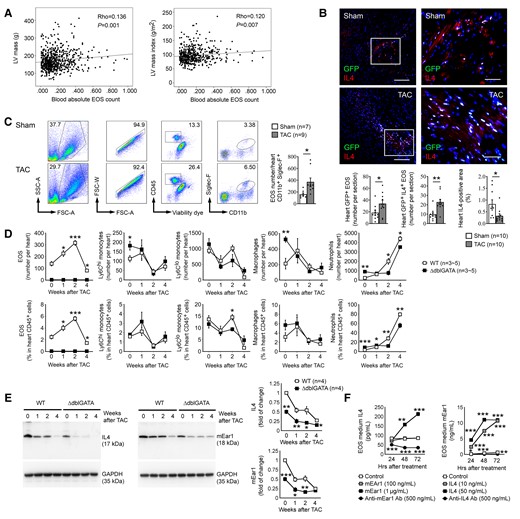
Increased EOS in hypertrophic hearts are the major source of cardiac IL4 and mEar1. (A) Linear regression analysis of blood EOS counts vs. LV mass and LV mass index from 644 patients with hypertension and chest pain after exclusions. (B) Immunofluorescent double staining of GFP and IL4 detected GFP-positive and GFP+IL4+ double-positive EOS, and IL4-positive areas in hearts from eoCRE+/-GFP+/– mice at 14 days after sham or TAC. Scale: 100 µm, inset: 35 µm. (C) FACS quantified heart EOS number in WT mice at 14 days after sham or TAC. Gating strategies are included. (D/E) FACS determined heart EOS, monocyte, macrophage, and neutrophil counts and percentages in CD45+ cells (D) and immunoblot analysis detected heart IL4 and mEar1 levels (E) from WT and ΔdblGATA mice at 0, 1, 2, and 4 weeks after TAC. (F) ELISA determined culture medium IL4 and mEar1 levels from WT EOS treated with different doses of mEar1 or IL4, or their antibodies. Data are mean ± SEM. Representative images or immunoblots in B and E are shown. The numbers of samples or tests are indicated. (F) Results from three experiments. P < 0.05 was considered statistically significant. Non-parametric Mann–Whitney U test followed by Bonferroni correction (B–E), one-way ANOVA followed by a post hoc Tukey’s test (F).
3.2 Increased EOS in hypertrophic heart are the major sources of cardiac IL4 and mEar1
To test whether EOS also accumulated in hypertrophic heart, we produced TAC-induced pressure overload in eoCRE+/–GFP+/– mice to induce cardiac hypertrophy.16 Only EOS express GFP in these mice.11 Immunofluorescent staining with GFP and IL4 antibodies revealed significant elevations of GFP-positive EOS or IL4-GFP double-positive EOS in hypertrophic hearts vs. those from sham-operated mice. Overall, IL4 expression was reduced in hypertrophic hearts (Figure 1B). FACS analysis yielded the same conclusion. TAC-induced hypertrophic hearts contained many more CD45+CD11b+Siglec-F+ EOS than those from the sham mice (Figure 1C).
To assess the impact of EOS on other immune cells in hypertrophic hearts, we produced TAC-induced hypertrophy in WT and EOS-deficient ΔdblGATA mice. ΔdblGATA mice were originally reported and confirmed selective ablation of the EOS lineage without affecting the development of other GATA1-dependent lineages, such as mast cells and other myeloid and erythroid cells.17 Therefore, these mice have been broadly used to study EOS functions in experimental disease models.18–20 As we expected, heart EOS absolute number or percentage of CD45+ cells increased over time, peaked at 2 weeks, and fell to the baseline at 4 weeks post-TAC. As we recently summarized,21 earlier studies showed that cardiac CD11b+Ly6Chi monocytes and CD11b+F4/80+MHC-II+ macrophages were comparable, but CD11b+Ly6Clo monocyte counts were much higher than those of macrophages in mice after TAC-induced hypertrophy.22–24 We obtained the same observations. Cardiac CD11b+Ly6Chi monocytes and CD11b+F4/80 + MHC-II+ macrophages elevated 1 week after TAC injury and dropped afterwards. CD11b+Ly6Clo monocyte counts were much greater than those of CD11b+Ly6Chi monocytes or macrophages, although it is possible that our gating strategy may underestimate the numbers of macrophages. EOS deficiency did not affect heart CD11b+Ly6Chi and CD11b+Ly6Clo monocytes and CD11b+Ly6G–F4/80+ macrophages at all tested time points after TAC injury. In contrast, heart CD11b+Ly6G+ neutrophils were fewer in ΔdblGATA mice than in WT mice, but all increased over time (Figure 1D). Hearts from ΔdblGATA mice showed significantly higher baseline numbers of CD11b+Ly6Chi monocytes, macrophages, and neutrophils than those from WT mice (Day 0) (Figure 1D), suggesting ongoing cardiac inflammation in ΔdblGATA mice. Yet, there is no evidence of myocarditis in these mice as the cardiac neutrophil counts were only about 3.5% in WT mice and 9.0% in ΔdblGATA mice, much lower than those in mice with myocarditis.25,26
TAC-induced cardiac hypertrophy also increased EOS contents in spleen, bone marrow, and blood in WT mice and peaked at 2 weeks post-TAC. EOS deficiency did not affect most tested immune cells at different time points. CD11b+Ly6Clo monocytes and CD11b+Ly6G–F4/80+ macrophages were the most affected immune cells in the spleen and bone marrow (see Supplementary material online, Figures S1A–C). FACS gating strategies for these immune cells in spleen are shown in Supplementary material online, Figure S2A–C and for those in hearts are shown in Supplementary material online, Figure S2D. It is possible that splenic and blood CD45+CD11c+MHC-II+ dendritic cells (see Supplementary material online, Figure S2C) may contain some macrophages.27 Different from the observations from the hearts, we obtained similar blood cell profiles between WT and ΔdblGATA mice at the baseline. At 8 weeks and 6 months of ages, besides EOS deficiency, we detected no significant differences in blood platelets, total white blood cells, red blood cells, neutrophils, monocytes, and lymphocytes between WT and ΔdblGATA mice (see Supplementary material online, Figure S3).
Human EOS are rich in Th2 cytokines IL4, IL5, IL13, and cationic proteins such as ECP and EDN.28,29 Immunoblot analysis detected a 50% reduction of IL4 and mEar1 in the hearts of ΔdblGATA mice at all tested time points post-TAC (Figure 1E), suggesting EOS as the major sources of IL4 and mEar1 in hypertrophic hearts. In mouse EOS, IL4 and mEar1 may play autocrine and paracrine roles in their expressions. Recombinant mEar1 dose-dependently increased IL4 secretion over time from mouse EOS. Anti-mEar1 antibody blocked EOS IL4 release. In turn, IL4 induced EOS mEar1 secretion also in a time- and dose-dependent manner. Anti-IL4 antibody also blocked the mEar1 release from EOS (Figure 1F).
3.3 EOS deficiency exacerbates cardiac hypertrophy in mice
To test a role of EOS in cardiac hypertrophy, we produced TAC-induced hypertrophy in 8-week-old male ΔdblGATA and WT control mice as outlined in Figure 2A. At 14 days post-TAC, we found that ΔdblGATA mice developed significantly enlarged systolic and diastolic LV anterior and posterior wall thickness (LVAW and LVPW) and reduced LVID, indicating enhanced hypertrophy in ΔdblGATA mice. EOS deficiency also increased heart rate and heart weight (HW) to body weight (BW) ratio (HW/BW) and HW to tibia length (TL) ratio (HW/TL), and exacerbated cardiac dysfunctions with higher EF% and FS% than those of WT mice (Figure 2B and C, see Supplementary material online, Table S4). After sham operation, ΔdblGATA mice showed significantly increased systolic LVPW, reduced systolic LVID, increased EF% ad FS%, and increased HW/BW, HW/TL, and liver weight/BW ratios, and increased heart Collagen I expression, compared with those in WT control mice (Figure 2C, see Supplementary material online, Table S4). These observations are consistent with the increased heart baseline monocytes, macrophages, and neutrophils from ΔdblGATA mice (Figure 1D), although we currently do not know why ΔdblGATA mouse hearts had high baseline inflammatory cell contents. It is possible that depletion of the GATA binding site in the GATA-1 promoter in ΔdblGATA mice affected other GATA-1-dependent cardiac cell types,17 a hypothesis that has not been tested.
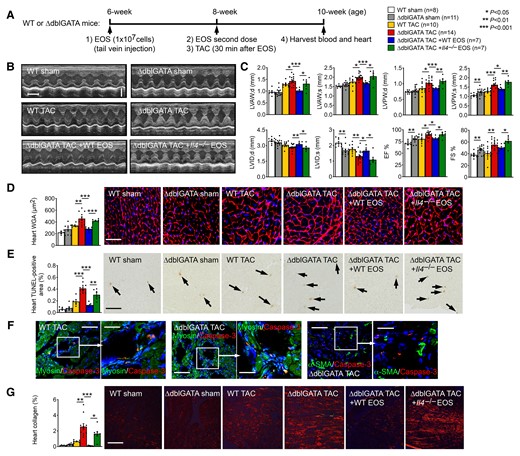
EOS and EOS-derived IL4 protect mice from TAC-induced cardiac hypertrophy. (A) Schematic outline of experimental procedures. (B) Representative M-mode echocardiographic images, time stamp: 100 ms, vertical bar: 2 mm. (C) Echocardiogram results from WT and ΔdblGATA mice and those received reconstitution of EOS from WT and Il4–/– mice at 14 days after sham or TAC. (D) Heart frozen section WGA immunofluorescent staining and measurement, bar: 40 µm. (E) Heart frozen section TUNEL staining, bar: 200 µm. Arrows indicate apoptotic cells. (F) Heart frozen section cleaved caspase-3 immunofluorescent double staining with β-myosin or α-SMA, bar: 200 µm, inset bar: 75 µm. (G) Heart frozen section Sirius red staining, bar: 400 µm. Mouse genotypes, treatments, and numbers in each group are indicated. Representative images in panels (D), (E), and (G) are shown to the right. Data are mean ± SEM. P < 0.05 was considered statistically significant. One-way ANOVA followed by a post hoc Tukey’s test.
The expression of the cardiomyocyte hypertrophy marker c-Fos occurs as early as 30 min after hypertrophic induction,30 whereas other hypertrophic markers atrial natriuretic factor (ANF) and β-myosin heavy chain peak at 3 days and 1–2 weeks after pressure overload. At 14 days after TAC, high expression of myocardial c-Fos, ANF, and β-myosin in WT mice was further increased in myocardium from hypertrophic ΔdblGATA mice, as determined by real-time PCR (RT-PCR) (see Supplementary material online, Figure S4). Consistent with this observation, immunofluorescent staining of myocardium with rhodamine-labelled WGA showed much more greatly increased cardiac cell hypertrophy in ΔdblGATA mice than in WT control mice (Figure 2D, see Supplementary material online, Table S4).
Cardiomyocyte apoptosis and cardiac fibrosis occur in hypertrophic hearts. TUNEL staining revealed increased cardiac cell apoptosis in hypertrophic hearts from WT mice. Cardiac cell apoptosis increased further in hearts from the ΔdblGATA mice (Figure 2E, see Supplementary material online, Table S4). Immunofluorescent staining of cleaved caspase-3 together with cardiomyocyte marker β-myosin or fibroblast marker α-SMA demonstrated that the apoptotic cells in hypertrophic hearts were mostly β-myosin-positive cardiomyocytes, but not α-SMA-positive fibroblasts (Figure 2F). Sirius red staining revealed collagen deposition in hypertrophic hearts from WT mice and such deposition increased significantly in hypertrophic hearts from ΔdblGATA mice (Figure 2G, see Supplementary material online, Table S4).
Pressure overload-induced cardiac hypertrophy may develop heart failure at an extended time, 4 weeks or longer post-TAC.30,31 As previously reported, WT mice at 4 weeks post-TAC showed significantly reduced systolic and diastolic LVAW thickness and dilated LVID, along with greatly reduced EF% and FS% compared with those from mice at 2 weeks post-TAC. In contrast, systolic and diastolic LVPW thickness and LVID, and EF% and FS% remained unchanged in ΔdblGATA mice from 2 to 4 weeks post-TAC, although ΔdblGATA mice showed reduced systolic and diastolic LVAW thickness after an extended time post-TAC (see Supplementary material online, Figure S5). These observations suggest that while WT mice developed heart failure at 4 weeks post-TAC, ΔdblGATA mice remained hypertrophic.
3.4 EOS-derived IL4 protects TAC-induced cardiac hypertrophy
Exacerbated TAC-induced hypertrophy and cardiac dysfunction in ΔdblGATA mice suggest a cardioprotective role for EOS. It is possible that EOS deficiency in ΔdblGATA mice may affect the activity of other immune cells that contributed indirectly to exacerbated cardiac hypertrophy and dysfunction, although all tested blood immune cells did not differ between ΔdblGATA and WT mice (see Supplementary material online, Figure S3) and most tested immune cells in hearts, spleens, bone marrows, and blood also did not differ between ΔdblGATA and WT mice at different time points post-TAC (Figure 1D, see Supplementary material online, Figure S1A–C). EOS are rich in cytokines, chemokines, and growth factors. Results in Figure 1E showed that cardiac EOS are a major source of IL4 that was reduced after TAC-induced cardiac hypertrophy. To test an EOS-specific role in cardioprotection and to identify the molecule from EOS that may be responsible for EOS cardioprotective activity, we performed reconstitution of bone marrow-derived EOS from WT and IL4-deficient (Il4–/–) mice to ΔdblGATA recipient mice.
When bone marrow cells were cultured in mouse stem cell factor and Flt3-L for 2 days, followed by IL5, EOS purity reached over 95% on Day 14 and beyond (see Supplementary material online, Figure S6A and B). On the 14th day, EOS from Il4–/– mice also reached to the similar level of purity (see Supplementary material online, Figure S7). Recipient mice received two doses of EOS at 2 weeks and 30 min before TAC, as outlined in Figure 2A. Reconstitution of EOS from WT mice, but not those from Il4–/– mice significantly decreased LVAW; d and LVPW; s, increased LVID; d and LVID; s, reduced heart rate, EF%, FS% and HW/BW and HW/TL ratios in recipient mice (Figure 2B and C, see Supplementary material online, Table S4). The expression of myocardial early and late hypertrophic markers c-Fos, ANF, and β-myosin, and cardiac cell hypertrophy as determined by WGA immunofluorescent staining were also blunted in ΔdblGATA mice received EOS from WT mice, but not in those received EOS from Il4–/– mice. ΔdblGATA mice received EOS from either WT or Il4–/– mice showed reductions in myocardial cell death and collagen deposition, but such reductions were significantly weaker in Il4–/– EOS-engrafted mice (Figure 2D, E and G, see Supplementary material online, Figure S4 and Table S4). These observations established an important role for EOS-derived IL4 in reducing pressure overload-induced hypertrophy and cardiac dysfunction.
3.5 EOS protects mouse cardiomyocytes from hypertrophy
To test the role of EOS cytokines other than IL4 in pressure overload-induced hypertrophic mice, we evaluated EOS IL4, IL10, IL13, and cationic protein mEar1 (human ECP ortholog)28,29 in ISO-induced mouse cardiomyocyte hypertrophy. The expression of the early hypertrophy marker c-Fos increased in 2 h after ISO treatment, whereas the expression of later hypertrophic markers ANF and β-myosin peaked at 6 and 12–24 h (see Supplementary material online, Figure S8A). EOS lysates from WT and Il10–/– mice, but not those from Il4–/– mice effectively blunted ISO-induced increase of these hypertrophic markers. EOS lysates from Il13–/– mice blocked the expression of ANF and β-myosin, but showed no effect on c-Fos (see Supplementary material online, Figure S8B). Consistent with these observations, ISO-induced cardiomyocyte hypertrophy in width and area was reduced by EOS lysates from WT, Il10–/–, and Il13–/– mice, but not those from Il4–/– mice, although the reduction of cardiomyocyte area by EOS lysates from Il13–/– mice did not reach statistic significance. None of these EOS or ISO affected cardiomyocyte length (see Supplementary material online, Figure S8C). FACS analysis was used to test the purity of these EOS from different cytokine-deficient mice (see Supplementary material online, Figure S7). EOS produces cationic proteins, among which ECP remains the best-studied member and has been used as a biomarker for EOS activation to determine the risk of CVD.5 To cultured mouse cardiomyocytes, use of anti-mEar1 antibody effectively blocked the activities of WT EOS in inhibiting ISO-induced expression of c-Fos, ANF, and β-myosin, and cardiomyocyte hypertrophy (see Supplementary material online, Figure S9A and B).
Recombinant murine IL4 and mEar1 acted similarly to WT EOS lysates in blocking ISO-induced cardiomyocyte expressions of c-Fos, ANF, and β-myosin and ISO-induced hypertrophy (width and area). EOS lysates from Il4–/– mice did not have these activities until recombinant IL4 was added (Figure 3A and B). Pressure overload-induced cardiac cell hypertrophy is mediated by cell membrane G-protein-coupled receptor Gαq subunit that activates the ERK, JNK, and p38 MAP kinase pathways.32 Consistent with what we detected in cardiomyocyte hypertrophy and hypertrophic gene expression profile (Figure 3A and B, see Supplementary material online, Figures S8 and S9), ISO activated these signalling pathways in mouse cardiomyocytes. WT EOS lysates and mEar1 blocked these pathways. EOS from Il10–/– mice also showed significant inhibition of these hypertrophic signalling pathways, but EOS from Il4–/– and Il13–/– mice showed much weaker activity (Figure 3C). These observations suggest that EOS used mEar1 (human ECP ortholog), IL4, and IL13 to block cardiomyocyte hypertrophy. Such activity of EOS-derived IL10 was much weaker than that of IL4 or IL13.
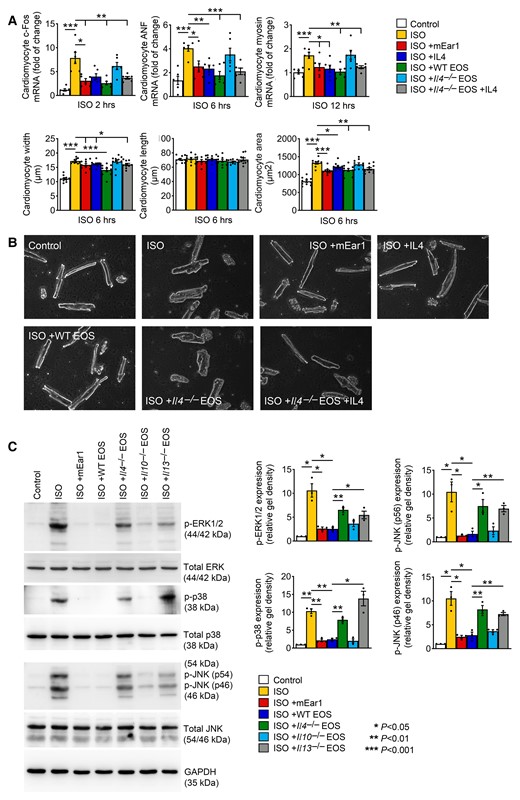
EOS and EOS-derived IL4 and mEar1 reduce ISO-induced cardiomyocyte hypertrophy. (A) RT-PCR determined the c-Fos, ANF, and β-myosin expression in cardiomyocytes treated without or with ISO, IL4, mEar1, WT EOS, or Il4–/– EOS with or without IL4 for different times as indicated. Length, width, and area of cardiomyocytes were also shown. (B) Representative images of cardiomyocytes after different treatments for 6 h as indicated. Bar: 50 µm. (C) Immunoblot analyses of total and phosphorylated ERK1/2, p38, and JNK from cardiomyocytes pre-treated with mEar1 and different types of EOS for 12 h and then ISO for 30 min. Representative immunoblots are shown to the left. All data are mean ± SEM from three independent experiments. P < 0.05 was considered statistically significant. One-way ANOVA followed by a post hoc Tukey’s test.
3.6 EOS block cardiomyocyte death and cardiac fibroblast TGF-β signalling and fibrosis
EOS-deficient ΔdblGATA mice experienced significant cardiomyocyte apoptosis after TAC-induced pressure overload (Figure 2E and F). In ISO-treated cardiomyocytes,33 we demonstrated that mouse mEar1 and EOS lysates from WT and Il10–/– mice, but not those from Il4–/– and Il13–/– mice significantly blocked cardiomyocyte apoptosis (Figure 4A), increased the expression of anti-apoptotic Bcl-2, and reduced the expression of cleaved caspase-3 (Figure 4B). Therefore, mEar1, IL4, and IL13 from EOS are effective inhibitors of cardiomyocyte apoptosis.
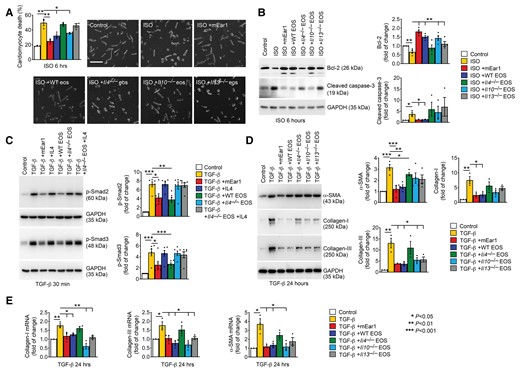
EOS, mEar1, and IL4 activities in mouse cardiomyocyte apoptosis and cardiac fibroblast TGF-β signalling and fibrosis. (A) Cardiomyocyte death percentage (bar: 100 µm) after cells were pre-treated with or without mEar1 or different EOS lysates for 12 h, followed by ISO for 6 h. (B) Immunoblot analysis of Bcl-2 and cleaved caspase-3 from cardiomyocytes with the same treatments as in (A). (C) Immunoblot analysis of p-Smad2/3 after cardiac fibroblasts were pre-treated with or without mEar1, IL4, or different EOS lysates with or without IL4 for 12 h, followed by TGF-β for 30 min. (D) Immunoblot analysis of α-SMA, Collagen I and III after cardiac fibroblasts were pre-treated with or without mEar1 or different EOS lysate for 12 h, followed by TGF-β for 24 h. (E) RT-PCR determined the mRNA levels of α-SMA, Collagen I and III in cardiac fibroblasts after the same treatment as in (D). GAPDH was used as protein loading control for all immunoblots. Representative images for panels (A–D) are shown. All data are mean ± SEM from six experiments per group. P < 0.05 was considered statistically significant. One-way ANOVA followed by a post hoc Tukey’s test.
TGF-β activation of cardiac fibroblasts mediates much myocardial fibrosis during cardiac hypertrophy.34 EOS deficiency increased myocardial collagen deposition (Figure 2G), suggesting that EOS inhibits TGF-β-induced cardiac fibroblast activation. We used mouse cardiac fibroblasts to test this hypothesis. Immunofluorescent staining using antibodies against fibroblast CD90, cardiomyocyte β-myosin, and EC CD31 tested the cardiac fibroblast purity. Mouse cardiomyocytes and ECs were used to test the quality of antibodies against β-myosin and CD31. The use of these antibodies yielded negative staining from cardiac fibroblasts. Double staining of CD90 with antibodies against β-myosin or CD31 in cardiac fibroblasts detected only the CD90 immunoreactivity (see Supplementary material online, Figure S10A–C). The use of cationic protein mEar1 and WT EOS lysates significantly suppressed the TGF-β-induced p-Smad2/3 activation from WT cardiac fibroblasts. In contrast, Il4–/– EOS lysate failed to inhibit p-Smad2/3 activation (Figure 4C), suggesting a role of EOS-derived IL4 in blocking cardiac fibroblast p-Smad2/3 signalling. This hypothesis contradicts earlier findings that IL4 has pro-fibrotic properties.35,36 Therefore, we compared the activities of IL4 and mEar1 in fibroblast p-Smad2/3 activation. Unlike mEar1, recombinant IL4 failed to block TGF-β-induced cardiac fibroblast p-Smad2/3 activation. The addition of IL4 did not recover the p-Smad2/3 activation activity of EOS lysates from Il4–/– mice (Figure 4C). These observations suggest that IL4 did not play a direct role in cardiac fibrosis, but via an indirect mechanism. Results from Figure 1E and F supported this hypothesis. EOS from WT mice may use mEar1 to block TGF-β-induced cardiac fibroblast p-Smad2/3 activation. IL4 in EOS may display the same activity by increasing mEar1 expression. This hypothesis is supported by our recent observations that EOS from Il4–/– mice are deficient in mEar1 expression.37 To support further a direct role for EOS-derived mEar1 in blocking cardiac fibroblast p-Smad2/3 activation, we pre-treated cardiac fibroblasts with EOS from WT mice with or without anti-mEar1 antibody. As in Figure 4C, EOS from WT mice efficiently blocked TGF-β-induced p-Smad2/3 activation, and such activity of EOS was muted by anti-mEar1 antibody (see Supplementary material online, Figure S11). Together, EOS-derived mEar1, IL4, and possibly IL13 directly or indirectly inhibited cardiac fibroblast TGF-β signalling. Cationic protein mEar1 and EOS from WT mice also blunted TGF-β-induced expression of α-SMA and Collagen I and III, as shown by immunoblot analyses. In contrast, EOS lysates from Il10–/– and Il13–/– mice only displayed significant inhibition of Collagen III expression, but not α-SMA or Collagen I. EOS from Il4–/– mice showed the weakest anti-fibrotic activity among all tested EOS types (Figure 4D). At the mRNA levels, RT-PCR yielded the same conclusions. TGF-β induced the expression of α-SMA, Collagen I and III. mEar1 and EOS lysates from WT, Il10–/–, and Il13–/– mice, but not those from Il4–/– mice, blunted the induction of these fibrotic genes (Figure 4E).
3.7 EOS cardioprotective activity in ISO-induced cardiac hypertrophy involves IL4
Continuous ISO infusion to activate the β-adrenergic signalling pathway induces cardiac hypertrophy,9 providing a TAC-independent model to test the role of EOS in cardiac hypertrophy. Distinct from the TAC-induced hypertrophy, however, FACS analysis detected a continuous drop of CD11b+Siglec-F+ EOS in the blood, heart, and spleen of mice after ISO infusion (Figure 5A–C). To test whether the creases of heart reduction of EOS in mice that received ISO resulted from ISO-induced EOS death or impaired differentiation in the bone marrow, we treated bone marrow cells with 10–50 µM ISO from Day 4 to 14 during EOS differentiation. FACS analysis showed that 50 µM ISO significantly increased EOS apoptosis (Figure 5D). ISO from 10 to 50 µM dose-dependently impaired EOS differentiation (Figure 5E). ISO-induced EOS death and impaired differentiation may contribute to systemic EOS reduction in ISO-treated mice, although ISO may also reduce EOS counts through indirect mechanisms. After 14 days of continuous osmatic minipump-mediated ISO subcutaneous infusion, WT mice displayed a significant increase of systolic and/or diastolic LVAW and LVPW thickness and reduction of LVID. Like in TAC-induced hypertrophic mice, EOS deficiency significantly exacerbated the increase of both LVAW and LVPW thickness and decrease of LVID. As previously reported,38 ISO infusion increased EF%, FS%, HW/BW, HW/TL, and cardiac cell hypertrophy, as determined by myocardium WGA staining in WT mice. In the hearts, blood, and spleens, about 30% of EOS remained after 14 days of ISO infusion (Figure 5A–C). Complete EOS deficiency in ΔdblGATA mice resulted in further aggravated changes of cardiac remodelling and dysfunction (Figure 5F, see Supplementary material online, Table S5, top). Development of cardiac hypertrophy typically accompanies an increase of systolic blood pressure after ISO infusion,39 yet both baseline and post-ISO infusion blood pressures did not differ between WT and ΔdblGATA mice. TUNEL staining and Sirius red staining revealed increased myocardial cell death and collagen deposition in WT mice after 14 days of ISO infusion. Myocardial cell death and collagen deposition or fibrosis rose further in ΔdblGATA mice (see Supplementary material online, Table S5, top).

EOS survival in response to ISO infusion. FACS analysis of CD45+CD11b+Siglec-F+ EOS in heart (A), blood (B), and spleen (C) at different days after ISO infusion. Representative images are shown to the left of each panel. Data were mean ± SEM from 6 to 9 mice per group. (D) FACS detection of annexin V+propidium iodide (PI)+ apoptotic EOS (CD11b+Siglec-F+) at 14 days after differentiation with and without 10 or 50 µM ISO starting from Day 4 during the course of differentiation. (E) FACS analysis of total CD11b+Siglec-F+ EOS during the differentiation of 1 × 10⁷ bone marrow cells from WT mice, when 10–50 µM ISO was added to the differentiation media starting from Day 4 and onward. Data were mean ± SEM from three experiments per treatment. (F) Echocardiogram results from WT and ΔdblGATA mice or those received adoptive transfer of WT or Il4–/– EOS at 14 days after mice were infused with PBS (sham) or ISO. The number of mice in each group is indicated. (G) FACS analysis determined donor EOS changes in the blood. (H) Anti-mouse CD45.1 antibody immunostaining determined CD45.1-positive donor EOS in the heart at different days after adoptive transfer. Scale: 200 µm, inset scale: 50 µm. (I) RT-PCR determined the c-Fos, ANF, and β-myosin heavy chain mRNA levels in heart from mice with different treatments as indicated. The numbers of mice are indicated in the parentheses. Data were mean ± SEM from four mice per group. Representative images or FACS are shown to the left. P < 0.05 was considered statistically significant. One-way ANOVA followed by a post hoc Tukey’s test.
As in TAC-induced cardiac hypertrophy, we performed reconstitution of EOS from WT and Il4–/– mice to ΔdblGATA mice, followed by ISO-induced hypertrophy. EOS from CD45.1-transgenic mice were used to trace these donor cells in the blood by FACS analysis and their infiltration to the heart in ΔdblGATA recipient mice by immunostaining. CD45.1 + Siglec-F+ donor EOS in the blood sharply decreased at 1–3 days and resumed to the baseline at 7–14 days after intravenous injection (Figure 5G). In ΔdblGATA recipient mouse hearts, however, the CD45.1+ donor EOS peaked at 3–7 days after adoptive transfer, as demonstrated by immunostaining with the CD45.1 antibody (Figure 5H). After 14 days of ISO perfusion, exacerbated changes in myocardial remodelling, cardiac dysfunctions, and hypertrophic gene expression (c-Fos, ANF, and β-myosin) in ΔdblGATA recipient mice were fully corrected by donor EOS from WT mice, but not those from Il4–/– mice, however, EOS from Il4–/– mice also blocked Collagen III expression. Donor EOS from WT or Il4–/– mice showed a moderate effect on systolic and diastolic blood pressures before and after ISO infusion (Figure 5F and I, see Supplementary material online, Table S5, bottom). These observations affirmed the importance of EOS in modulating both pressure overload- and ISO-induced hypertrophy and EOS-derived IL4 played a key role.
3.8 mEar1 protects mice from ISO-induced cardiac hypertrophy
Recombinant mEar1 essentially inhibited cardiomyocyte hypertrophy and apoptosis and cardiac fibroblast TGF-β signalling and fibrosis (Figures 3 and 4). ISO infusion reduced EOS contents in the blood, spleen, and heart (Figure 5A–C), which may reduce mEar1 production, leading to increased cardiomyocyte hypertrophy and apoptosis, and myocardial fibrosis. Plasma from untreated WT mice, but not that from ISO-treated WT mice or ΔdblGATA mice contained the 15–17-kDa mEar1 as revealed by immunoblot analysis using the recombinant mEar1 as standard (see Supplementary material online, Figure S12A). Similarly, mEar1 expression was reduced in the myocardium from ISO-treated WT mice. Unlike in the plasma, however, we also detected mEar1 expression in myocardial protein extracts from ΔdblGATA mice and ISO also reduced myocardial mEar1 expression in these mice (see Supplementary material online, Figure S12B), suggesting that cells in the myocardium other than EOS expressed mEar1. In cultured EOS, ISO reduced mEar1 expression in 6–24 h (see Supplementary material online, Figure S12C), which may explain reduced plasma and myocardium mEar1 after ISO treatment. In cultured cardiomyocytes, we detected mEar1 expression, although at much lower levels than in EOS. Such expression was blunted by ISO in 12–24 h (see Supplementary material online, Figure S12D).
To test a role of mEar1 in cardiac hypertrophy, we gave recombinant mEar1 by daily intraperitoneal (i.p.) injection to ΔdblGATA and WT mice. At 7 days of ISO infusion combined with daily i.p. injection of PBS, ΔdblGATA mice developed cardiac hypertrophy with significant increases in systolic and diastolic LVAW and LVPW thickness, reduction in LVID, increases in heart rate, EF%, cardiac cell hypertrophy (WGA staining), HW/TL ratio, HW/BW ratio, cardiac cell apoptosis (TUNEL staining), and myocardial Collagen I expression. Yet, the parallel ISO-treated ΔdblGATA mice receiving daily mEar1 injection displayed full protections of these cardiac morphologic and functional changes (Figure 6A, see Supplementary material online, Table S6, top). After 14 days of ISO infusion and daily PBS injection, ΔdblGATA mice displayed significant thinning of systolic and diastolic LAVW thickness, reduction of EF%, and increases in systolic and diastolic LVID, HW/TL and HW/BW ratios, characters of mouse heart failure. At this time point, ISO also increased myocardium cell hypertrophy, apoptosis, and Collagen I accumulation. Daily mEar1 administration again blocked these changes (Figure 6A, see Supplementary material online, Table S6, top).
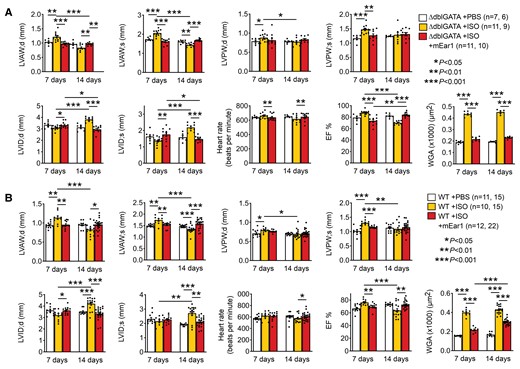
mEar1 protects mouse heart from ISO-induced cardiac hypertrophy. (A/B) Echocardiogram results and cardiac cell hypertrophy (WGA staining) of ΔdblGATA (A) and WT mice (B) treated with ISO infusion from implanted minipumps and daily i.p. injection of PBS or mEar1 (2 µg/day) for 7 and 14 days. The number of mice in each group is indicated. All data are mean ± SEM. P < 0.05 was considered statistically significant. One-way ANOVA followed by a post hoc Tukey’s test.
Study of WT mice yielded similar conclusions. After 7 days of ISO infusion and PBS daily injection, WT mice developed hypertrophy with significantly increased systolic and diastolic LVAW and LVPW thickness, reduced diastolic LVID, increased EF%, heart rate, HW/TL and HW/BW ratios, and increased myocardial cell hypertrophy and apoptosis and Collagen I accumulation (Figure 6B, see Supplementary material online, Table S6, bottom). Injection of mEar1 for 7 days prevented these changes. After 14 days of ISO infusion, WT mice that received PBS injection also displayed reduced LVAW; s and LVAW; d thickness and increased LVID’s and LVID; d, reduced EF%, and increased HW/TL and HW/BW ratios. These mice also showed increases in cardiac cell hypertrophy, apoptosis, and Collagen I deposition. The same WT mice receiving ISO infusion showed reversals of nearly all these cardiac morphologic and functional changes after daily mEar1 injection (Figure 6B, see Supplementary material online, Table S6, bottom). Therefore, mEar1 appeared to protect hearts from ISO-induced hypertrophy (7-day) and possible development of heart failure-like cardiac remodelling and dysfunction (14-day). EOS produce not only mEar1, but also IL4 and other untested molecules that may all contribute to the cardiac reparative activity of EOS in hypertrophic hearts. Nearly complete repair of cardiac remodelling and dysfunction in WT or ΔdblGATA mice after mEar1 injection (Figure 6A and B) might involve not only mEar1, but also IL4 and other untested molecules because mEar1 may exert autocrine and paracrine activities to induce the expression of IL4 (Figure 1F) and other untested EOS molecules and vice versa. Prior studies showed that human plasma ECP levels were −20 ng/mL.5 Mice that received 2 µg/day may have systemic mEar1 levels much higher than the endogenous mEar1, although there is currently no valid assay to quantify plasma mEar1 besides immunoblot (see Supplementary material online, Figure S12A). Yet, although this study did not titrate the lowest dose of mEar1 necessary to maintain its efficacy in blocking cardiac hypertrophy, effective inhibition of cardiac hypertrophy in WT mice by recombinant mEar1 may present a therapeutic possibility to ameliorate cardiac hypertrophy in humans.
3.9 Translational potential of cationic proteins in cardiac hypertrophy
Fully blunted ISO-induced cardiac hypertrophy in ΔdblGATA and WT mice receiving mEar1 (Figure 6A and B, see Supplementary material online, Table S6) suggests the translational potential of ECPs in human cardiac diseases. Mouse mEar1 is an ortholog of human ECP based on their primary sequence identity (49%). Yet, mEar1 also shares 48% sequence identity with human EDN,28,29 suggesting that human ECP and EDN act the same as mEar1. ECP exerts high cationic property (pI:11.4) and is cytotoxic by making target cell membrane leaky. In contrast, mEar1 (pI:9.0) and EDN (pI:8.9) show much lower cationic property, and EDN has weak cytotoxicity.29 ECP32–41 and EDN32–41 peptides, containing similar heparin-binding motifs that mediate their binding onto the negatively charged cell surface, show different cell membrane binding and internalization activities. Only ECP32–41 displays the properties of cell-penetrating peptide (CPP), in which the two arginine residues (R34 and R36) around the aromatic tryptophan (W35) are necessary for cell membrane internalization and disruption. Uncharged glutamine Q34 and threonine T36 on EDN and mEar1 replace the positively charged R34 and R36 on ECP, respectively, and R35 in the corresponding CPP core motif region of both EDN and mEar1 replace the aromatic W35 on ECP (Figure 7A). We performed homology modelling of mEar1 based on its primary sequence and the available high-resolution crystal structures of human ECP and EDN.40,41 The lack of aromatic W35 and the replacement of R34 or R36 in the region corresponding to the CPP core motif of EDN and mEar1 suggest that mEar1 is structurally closer to EDN than ECP (Figure 7B) and may explain why EDN shows weaker cytotoxicity than ECP. Based on the number of positively charged vs. negatively charged residues on ECP (20 vs. 6), EDN (12 vs. 5), and mEar1 (14 vs. 6), computer modelling showed comparable positive surface charge and its distribution between EDN and mEar1, much lower than that of ECP (Figure 7C), consistent with their cationic properties.28,29
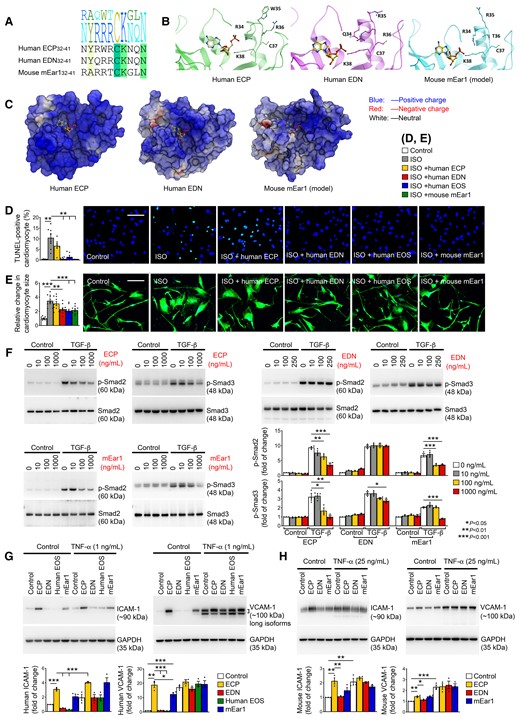
ECP activities on human cardiomyocytes, cardiac fibroblasts, and ECs. (A) Human ECP32–41, human EDN32–41, and mouse mEar132–41 amino acid sequence alignment, corresponding to the CPP region in ECP. (B) Crystal structure of the CPP region in human ECP (left) and corresponding regions in EDN structure (middle) and mouse mEar1 model (right). Adenosine 2′-5′-diphosphate molecule co-crystalized with EDN was transferred into the ECP structure and mEar1 model to show the location of the catalytic active site. (C) Human ECP, human EDN, and mouse mEar1 molecule surface charges. (D) TUNEL staining detected human cardiomyocyte death after cells were exposed to 10 µM ISO with or without different cationic proteins or human EOS lysates. (E) Human β-myosin immunofluorescent staining detected human cardiomyocyte hypertrophy after the same treatments as in (D). Scale: 200 µm. (F) Immunoblot analyses of p-Smad2/3 from human cardiac fibroblasts treated with and without 10 ng/mL TGF-β and different doses of ECP, EDN, and mEar1. (G) Immunoblot detected the expression of ICAM-1 and VCAM-1 in human aortic ECs treated with or without 1 ng/mL TNF-α, ECP, EDN, human EOS lysate, and mEar1 as indicated. (H) Immunoblots detected the expression of ICAM-1 and VCAM-1 in mouse heart ECs treated with or without 25 ng/mL TNF-α, and ECP, EDN, and mEar1. All data are mean ± SEM. (D) Included seven experiments per group, (E) included 40 measures per group, and (F–H) included three experiments per group. P < 0.05 was considered statistically significant. One-way ANOVA followed by a post hoc Tukey’s test.
In human iPS cell-derived cardiomyocytes, human EOS lysate, recombinant EDN, and mEar1, but not recombinant ECP, blocked ISO-induced cardiomyocyte apoptosis and hypertrophy, as determined by TUNEL immunofluorescent staining (Figure 7D) and β-myosin immunofluorescent staining combined with size measurement (Figure 7E). In cultured human cardiac fibroblasts, however, ECP and mEar1 dose-dependently blocked TGF-β-induced p-Smad2/3 activation, but EDN showed much weaker activity (Figure 7F). These mixed observations may not suggest whether mEar1 is the ortholog of human ECP or EDN, but indicate that these cationic proteins play a beneficial role in human cardiac diseases.
Earlier studies showed that human EOS induced human EC adhesion molecule (ICAM-1, VCAM-1, and E-selectin) expression.42 Consistent with these studies, ECP induced human aortic EC expression of ICAM-1 and VCAM-1 in the absence or presence of TNF-α. Such induction was muted when ECs were treated with EDN or EOS lysate. mEar1 revealed much weaker activities in ICAM and VCAM induction than ECP (Figure 7G). Cultured mouse heart ECs produced the same observations. In the absence of TNF-α, ECP induced ICAM-1 and VCAM-1 expression from mouse heart ECs, but such activity was muted when human EOS lysates or EDN were used. mEar1 showed comparable activity to ECP in inducing heart EC expression of ICMA-1 or VCAM-1 (Figure 7H). Increased adhesion molecule expression in ECs after ECP or mEar1 may increase inflammatory cell adhesion and infiltration to the site of injury and promote cardiac diseases, yet our observations from mEar1-treated WT and ΔdblGATA mice (see Supplementary material online, Table S6) do not support a pathogenic role of mEar1.
4. Discussion
Cardiac hypertrophy impairs contractile functions and eventually leads to heart failure. This study revealed unexpected observations from humans and experimental mice that positive correlation between blood AEC and cardiac hypertrophic measures in humans and increased heart, spleen, bone marrow, and blood EOS in TAC-induced hypertrophic mice did not support a pathogenic role of these granulocytes in cardiac hypertrophy. Instead, both pressure overload- and ISO-induced cardiac hypertrophy in mice supported a cardioprotective role of EOS, EOS-derived IL4 and mEar1 in hypertrophy, and associated cardiac dysfunction. Observations from our patient study agreed with most prior studies that the peripheral AEC or plasma ECP levels associate positively with CVD events and prevalence.3,5 Increases of AEC and ECP in the peripheral and possibly in the heart from these CVD patients may present a cardioprotective mechanism. This observation is similar to that of tissue plasminogen activator, which is also a significant risk factor of human CVD,43 but plays a cardioprotective role.44 Others and we also detected an increase of Ly6Clo monocytes in the spleen, bone marrow, and blood after TAC-induced hypertrophy.23 Depletion of these cells reduced cardiac contractile function.5 Therefore, compensatory increase or decrease of EOS or monocytes may not easily translate their detrimental or beneficial function in hypertrophic hearts. Data from ISO-treated mice supported the hypothesis that decreases in heart EOS augment the risks of hypertrophy and progressive development of potential heart failure. This study provided several lines of evidence to support this conclusion, including the observations that EOS-deficient ΔdblGATA mice showed exacerbated hypertrophy; EOS reconstitution prevented such adverse cardiac complications in ΔdblGATA mice; IL4-deficient EOS lost such activity; and administration of mEar1 blocked the disease development in WT and ΔdblGATA mice. Even in sham-operated ΔdblGATA mice without pressure overload or ISO infusion, EOS deficiency significantly increased LVPW; s, reduced LVID; d and LVID; s, along with higher EF% and FS% than the WT control mice. These observations together with those from TAC- and ISO-treated mice established a previously unrecognized role of EOS in mitigating cardiac hypertrophy.
The role of EOS-derived cationic proteins, including ECP, EDN, and mouse mEar1 in hypertrophy also presented another contradictory conclusion. ECP exerts cytotoxic and fibrosis-promoting activities, and immune-regulatory function by regulating mucosal and immune cell activity against infections. Prior studies suggest ECP activity in promoting EC adhesion molecule expression,42 and the current study showed that both ECP and mEar1 at a lesser extent, enhanced human aortic EC and mouse heart EC expression of ICAM-1 and VCAM-1 (Figure 7G and H) that may increase inflammatory cell infiltration to the injured heart. ECP also activated mast cells that are pathogenic to CVD and stimulated fibroblast expression of glycosaminoglycans that manifest ventricular fibrosis, hypertrophy, arrhythmia, valve leaflet disease, and in some cases ventricular aneurysm. ECP activates human skin and lung fibroblasts to release fibrogenic cytokines TGF-β and IL1β. All these studies suggest a pathogenic role of ECP in myocardial inflammation and hypertrophy. Yet, observations from this study do not support this hypothesis. None of the tested cationic proteins, ECP, EDN, or mEar1 increased ISO-induced cardiomyocyte hypertrophy and death or TGF-β-induced cardiac fibroblast p-Smad2/3 signalling, but blocked these pathogenic events (Figure 7D–F). A possible pathogenic role of these cationic proteins may be human aortic EC adhesion molecule expression. Although EDN showed no activity, ECP and mEar1 increased ICAM-1 and VCAM-1 expression from aortic ECs (Figure 7G). Yet, our study disproved a detrimental role of mEar1 in ISO-induced cardiac hypertrophy or in the development of heart failure (see Supplementary material online, Table S6), suggesting that the role of mEar1 in EC adhesion molecule expression played no role in our model system and possibly in humans.
Evidence supports mEar1 as an ortholog of human ECP.28,29 Our structural analysis of the CPP region and distribution of the surface charge suggest that mEar1 more closely resembles EDN than ECP (Figure 7A–C). Yet the tested activities on human cardiomyocyte hypertrophy and death, cardiac fibroblast TGF-β signalling, and aortic EC adhesion molecule expression did not prove or disprove whether mEar1 acts as an ortholog of ECP or EDN. mEar1 acted like ECP on cardiac fibroblasts and ECs, but acted like EDN on cardiomyocytes. Although this study did not offer a distinct answer, all studies from cultured human cardiac and vascular cells, and from ISO-induced cardiac hypertrophy, support the hypothesis that human ECPs ECP and EDN and mouse mEar1 may have translational value in human cardiac hypertrophy, a hypothesis that merits future pre-clinical and clinical investigations.
WT or ΔdblGATA mice developed cardiac hypertrophy at 14 days after ISO perfusion (see Supplementary material online, Table S5). Under the same condition, however, ISO infusion induced cardiac hypertrophy in WT and ΔdblGATA mice at 7 days when mice also received daily injection of PBS. At 14 days after ISO infusion and daily PBS injection, both WT and ΔdblGATA mice unexpectedly showed systolic and diastolic LVAW thinning and LVID dilations, leading to significantly reduced EF%, while cardiac cell hypertrophy remained (Figure 6A and B, see Supplementary material online, Table S6). These observations remain unexplained. The daily injection may have distressed the hypertrophic mice, thereby expediting the progression of cardiac hypertrophy and heart failure. Otherwise, mice will develop heart failure in 3–4 weeks under the same dose of ISO (30 mg/kg/day).45,46 Indeed, blood pressure increased similarly with 14 days of ISO infusion without injection and 7 days ISO infusion with daily PBS injection (e.g. WT with ISO at 14 days without injection vs. WT with ISO at 7 days with daily PBS injection systolic blood pressure: 147.00 ± 2.64 mmHg vs. 153.42 ± 2.93 mmHg; diastolic blood pressure: 108.11 ± 2.73 mmHg vs. 115.14 ± 2.92 mmHg) (see Supplementary material online, Tables S5 and S6). Daily distress to ISO-infused mice appeared to accelerate the development of cardiac hypertrophy and heart failure. Different from this ISO model, TAC-induced cardiac hypertrophy remained in ΔdblGATA mice at 4 weeks post-TAC when WT mice developed heart failure with greatly increased systolic and diastolic LVID and reductions of EF% and FS% (see Supplementary material online, Figure S5). This study did not explore further the mechanisms to explain why WT mice developed heart failure and ΔdblGATA mice remained hypertrophic at 4 weeks post-TAC (see Supplementary material online, Figure S5), whereas ΔdblGATA mice developed more LVAW thinning, LVID dilation, and EF% reduction than the WT mice after ISO infusion with 14 days of daily injection distress (Figure 6). ISO-activated β-adrenergic signalling pathway may not be the only mechanism to explain heart failure development in Balb/c mice.47
Overall, this study suggests that high blood EOS count serves as a biomarker of cardiac hypertrophy in humans but protect the heart from hypertrophy by releasing IL4, IL13, cationic proteins, and possibly other untested granule mediators. The clinical observation of an association of higher ECP concentrations with cardiac hypertrophy and adverse outcomes may reflect overshoot of or an excessive protective response. Human ECP and EDN or derivatives thus may merit consideration as novel therapeutic interventions to modulate cardiac hypertrophic conditions.
Supplementary material
Supplementary material is available at Cardiovascular Research online.
Authors’ contributions
C.Y., J.G., J.W., P.L., and G.-P.S. designed the experiments. C.Y., J.L., Z.D., S.L., J.L., W.F., F.L., T.L., X.Z., Y.Z., Z.M., S.Z., C.L., D.Y., J.W., and J.G. performed all in vitro and in vivo studies. S.L., J.L. analysed the data from patients. L.L. helped with mouse cardiac cell culture. G.K.S. performed immunohistology analysis. A.S. and V.K. analysed the molecular structures and computer modelling. P.L., J.W., J.G., and G.-P.S. helped critical reading and editing.
Acknowledgements
We thank Dr Helene Rosenberg from the National Institutes of Health for helps with mouse eosinophil culture, Dr Elizabeth Jacobsen from Mayo Clinic Arizona for providing the eoCRE+/– mice, and Ms Chelsea Swallom for editorial assistance.
Funding
This work is supported by grants from the National Natural Science Foundation of China (81300176 and 82170234 to C.Y., 82000433 to J.L., 91939107 and 81770487 to J.G., 8000433 to J.L., and 91739107 to J.W.), the China International Medical Foundation (Z-2019-42-1908-2 to C.Y.), the Chinese Academy of Medical Sciences Innovation Fund for Medical Sciences (2016-I2M-1-006 to J.W. and 2019-I2M-5-023 to J.G.), the Open programme for Key Laboratory of Emergency and Trauma of Ministry of Education Hainan Medical University (KLET-201917 to J.G.), Guangzhou Planed Project of Science and Technology (201704020105 to F.L.), the National Heart, Lung, and Blood Institute (HL151627 and HL157073 to G.-P.S., and HL34636, HL80472 to P.L.), and the National Institute of Neurological Disorders and Stroke (AG063839 to G.-P.S).
Data availability
The data underlying this article will be shared on reasonable request to the corresponding author.
References
Author notes
Chongzhe Yang, Jie Li, Zhiyong Deng, Songyuan Luo and Jing Liu contributed equally to this study.
Conflict of interest: The authors have declared no conflicts of interest.
