


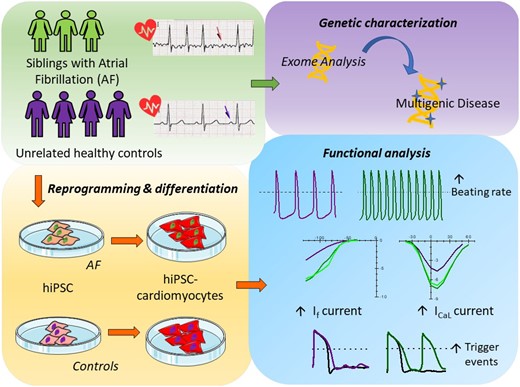
Abstract
Atrial fibrillation (AF) is the most common type of cardiac arrhythmias, whose incidence is likely to increase with the aging of the population. It is considered a progressive condition, frequently observed as a complication of other cardiovascular disorders. However, recent genetic studies revealed the presence of several mutations and variants linked to AF, findings that define AF as a multifactorial disease. Due to the complex genetics and paucity of models, molecular mechanisms underlying the initiation of AF are still poorly understood. Here we investigate the pathophysiological mechanisms of a familial form of AF, with particular attention to the identification of putative triggering cellular mechanisms, using patient’s derived cardiomyocytes (CMs) differentiated from induced pluripotent stem cells (iPSCs).
Here we report the clinical case of three siblings with untreatable persistent AF whose whole-exome sequence analysis revealed several mutated genes. To understand the pathophysiology of this multifactorial form of AF we generated three iPSC clones from two of these patients and differentiated these cells towards the cardiac lineage. Electrophysiological characterization of patient-derived CMs (AF-CMs) revealed that they have higher beating rates compared to control (CTRL)-CMs. The analysis showed an increased contribution of the If and ICaL currents. No differences were observed in the repolarizing current IKr and in the sarcoplasmic reticulum calcium handling. Paced AF-CMs presented significantly prolonged action potentials and, under stressful conditions, generated both delayed after-depolarizations of bigger amplitude and more ectopic beats than CTRL cells.
Our results demonstrate that the common genetic background of the patients induces functional alterations of If and ICaL currents leading to a cardiac substrate more prone to develop arrhythmias under demanding conditions. To our knowledge this is the first report that, using patient-derived CMs differentiated from iPSC, suggests a plausible cellular mechanism underlying this complex familial form of AF.
1. Introduction
Atrial fibrillation (AF) is the most common cardiac arrhythmia, occurring in 1–2% of the general population, but with a greater incidence in the elderly. In this type of arrhythmia, ectopic activity originating outside the sinoatrial node, gives rise to a disorganized electrical activation due to a cellular substrate susceptible to re-entrant circuits. While AF is commonly associated with structural heart diseases and is a major cause of cardiovascular morbidity and mortality in the elderly, it sometimes develops in a subset of patients younger than 60, with no evidence of associated cardiopulmonary or other diseases.
In recent years, evidence for inheritable forms of AF has grown. Beyond the rare cases of monogenic forms of AF and linkage analysis that revealed several genetic loci associated with AF,1 population-based studies have shown that having first degree relatives with AF increases significantly the probability to develop AF.2 Familial AF is likely associated with a complex genetic background that predisposes to this arrhythmia and that may or may not manifest itself depending on other non-genetic contributors.
Because of this genetic complexity, the molecular mechanisms underlying the initiation of AF are still poorly understood and possibly involve a complex interplay of various effectors.3 In addition, electrical disturbances typical of AF cause the remodelling of the atria in a way that may sustain the arrhythmic phenotype.4 This remodelling, in turn, makes it impossible to discriminate between causes and effects of AF when analysing cardiomyocytes (CMs) obtained from patient’s biopsies. Human induced pluripotent stem cells-derived CMs (hiPSCs-CMs) may represent a valuable model to study AF, since they carry the exact genetic background of the patient but are free from the AF-dependent remodelling. hiPSC-CMs are now recognized as a useful human model that recapitulates the functional alterations underlying inherited arrhythmogenic diseases.5
In this work, we describe the first iPSC-derived model of human AF, generated from two out of three siblings that developed a drug-resistant form of AF at a relatively young age (<55 years). Using this model, we compared molecular and electrophysiological properties of hiPSC-CMs from AF patients (AF-CMs) and controls (CTRL-CMs), revealing alterations in ionic currents that may represent one of the cellular mechanisms that contribute to AF initiation.
2. Methods
2.1 AF patients
The three siblings were referred to Spedali Civili of Brescia (Italy), where they were diagnosed for AF (for details on method see Supplementary material online). Since all three patients were non-responsive to antiarrhythmic medication and failed previous transcatheter ablation, they underwent surgical ablation as described in Supplementary material online. A detailed clinical history of the patients is reported in the Supplementary material online, Table S1.
2.2 Generation of hiPSCs and cardiac differentiation
Blood and skin biopsies have been obtained from all three siblings following approved protocols by the Ethical Committee of Brescia (protocol number 1737) and a written consent obtained from the patients, in agreement with the declaration of Helsinki. hiPSC were generated as reported in Supplementary material online.
Cardiac differentiation of hiPSC was carried out either by embryoid bodies (EBs), as previously described6 or by monolayer culture using the PSC Cardiomyocyte Differentiation Kit (Thermo Fisher Scientific). Differentiation in EBs was used for experiments on beating clusters to record the spontaneous rate. All the other experiments were carried out using the monolayer differentiation.
2.3 Electrophysiological and Ca2+ handling analysis
Electrophysiological and Ca2+ handling experiments were performed on dissociated hiPSC-CMs from at least three independent differentiation experiments, using the patch-clamp technique in whole-cell configuration. For protocols and solutions see Supplementary material online.
2.4 Statistics
Statistical analysis was carried out with Origin Pro 9, IBM SPSS Statistics and R software. Groups were compared with one-way ANOVA followed by pairwise comparison using Fisher’s test or by nested one-way ANOVA with Holm P-value adjustment. Difference in events percentage among groups was assessed by Fisher’s exact test, adjusting the P-value with Bonferroni correction. P-value <0.05 defines statistical significance. Data are presented as mean ± SEM.
3. Results
3.1 Characteristics of patients: genetic screening for mutations in AF-related genes
We identified three siblings with untreatable AF (see exemplified electrocardiogram in Supplementary material online, Figure S1 and clinical characteristics in Supplementary material online, Table S1) who, due to failure of pharmacological treatment, underwent surgical ablation. Although they present other comorbidities (e.g. high body mass index and hypertension) that may importantly contribute to the poor control of the pathology, the familiarity, and their young age of onset of AF, strongly support a genetic basis for this form of arrhythmia.
In an attempt to identify potential AF-related mutations within the family we performed a whole exome sequencing in which data obtained from the three siblings (dubbed AF1, AF2, and AF3) were compared with 6000 human reference genomes (GRC37/hg19). We identified more than one hundred variants common only to the three siblings (see Supplementary material online, Table S2). Only few of these variants were in genes previously associated with AF (ZFHX3) and expressed also in the heart (PDE4DIP, CNN2, RYR3, NEFM, FLNC, and MYLK). Because of the complex genetic background of the family and the lack of unquestionably healthy relatives, we decided to address the molecular basis of this form of AF from a functional point of view.
3.2 Generation of hiPSC clones
To highlight possible common functional cardiac alterations in these patients, we generated patient-derived iPSCs and differentiated them into CMs. The reprogramming procedure was effective for fibroblasts obtained from AF1 and AF2, which allowed the generation of three hiPSC clones (AF1 n = 2; AF2 n = 1).
In the absence of unquestionably healthy parental or isogenic controls, AF clones were compared with at least three of four different unrelated control clones: one derived from dermal fibroblasts of an age-matched healthy woman7 (CTRL1); one derived from epidermal keratinocytes8 (CTRL2); one derived from dermal fibroblasts of a young male (CTRL3 shown in Figure 1B and C); and the last one from blood cells of a 62-year-old male not affected by AF or other cardiac pathologies (CTRL4).

Pluripotency characterization. (A) qPCR analysis of pluripotency gene expression in hiPSC using dermal fibroblasts as reference control equal to 1. tOCT4 and tSOX2 indicate the specific expression of transgenes, while eOCT4 and eSOX2 refer to expression of endogenous genes. Differences in gene expression levels were compared using one-way ANOVA followed by Fisher’s T-test. (B) Summary panels for AF1, AF2, and CTRL hiPSC lines, as indicated (from left to right): bright-field images of primary fibroblasts, alkaline phosphatase activity in hiPSC-colonies, immunostaining of hiPSC for pluripotency markers and karyotype. (C) Immunostaining of differentiated hiPSCs with antibodies recognizing ectodermal, mesodermal, and endodermal markers as indicated.
The clones obtained from AF1 and AF2 were tested for the expression of both exogenous (t) and endogenous (e) pluripotency genes OCT4, SOX2, NANOG, and REX1 by qPCR (Figure 1A) or by immunocytochemistry (Figure 1B). They were further screened for morphological properties typical of pluripotent colonies, such as sharp borders, the absence of a central dark area, and the expression of alkaline phosphatase (Figure 1B). The maintenance of a normal karyotype was also verified by quinacrine staining of metaphase plates (Figure 1B). Finally, the capacity to differentiate towards the three germ layers was confirmed by immunostaining with specific antibodies recognizing the ectodermal protein Nestin or Class III beta-Tubulin (TUJ1), the mesodermal protein smooth muscle actin, and the endodermal protein alpha fetoprotein (Figure 1C).
3.3 AF and CTRL hiPSCs differentiate into CMs with similar efficiency
For the experiments evaluating beating rate of clusters of hiPSC-CMs, clones were differentiated towards the cardiac lineage using a previously published procedure that involves spontaneous formation of EBs.6 For all remaining experiments, we switched to a commercially available cardiac differentiation kit that ensured a higher yield of CMs.
Besides the appearance of beating areas, CMs in AF and CTRL groups were evaluated for the expression of the cardiac troponin gene (TNNT2) and the atrial gene sarcolipin (SLN) at day 30 of differentiation, by qPCR. The plots in Figure 2A (top panels) show that the levels of TNNT2 and SLN were similar in all groups.
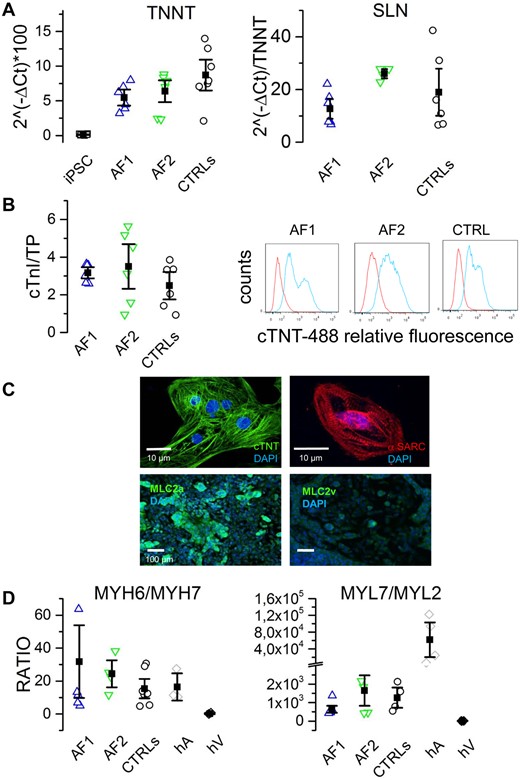
hiPSC-derived cardiomyocyte differentiation. (A) qPCR analysis of cardiac troponin T (TNNT2) and sarcolipin (SLN) expression at day 30 of differentiation for AF1-, AF2-, and CTRL-CMs, as indicated. Undifferentiated hiPSC were used as negative control. (B) Quantification of cardiac troponin I (µg) on total protein content (TP, mg) of AF1 (2.9 ± 0.46; n = 3), AF2 (2.4 ± 1.37; n = 3), CTRL (2.36 ± 1.08; n = 6), and hiPSCs (0.002 ± 0.01; n = 2) (left). Representative flow cytometry analysis on hiPSC-differentiated cells using an anti-cardiac troponin T antibody: AF1 (45.1 ± 11 n = 3), AF2 (55.2 ± 19 n = 3), CTRL (52 ± 12 n = 6) (right). (C) Representative images of isolated AF1-CM and AF1-differentiated monolayers stained for cardiac troponin T (cTNT), sarcomeric actin (α-SARC), atrial (MLC2a), and ventricular (MLC2v) myosin light chains; nuclei were counterstained with DAPI. (D) Ratios between the qPCR expression levels of heavy (left) and light (right) chain isoforms of myosin. Human atria (hA) and ventricles (hV) were used as positive and negative controls, respectively. Differences in gene expression and protein quantification were assessed by one-way ANOVA followed by Fisher’s T-test.
We further investigated cardiac differentiation at the protein level by assessing the expression of cardiac troponin I in cellular lysates using a commercially available diagnostic kit (Figure 2B, left panel), finding no differences among clones. CMs yield was evaluated by flow cytometry using an anti-cardiac troponin T (cTNT) antibody. This analysis revealed that around half of the population was composed by CMs (Figure 2B, right panel). Again, no significant differences were found between AF and CTRL clones. Top panels of Figure 2C show representative images of isolated AF1-CMs, stained with cTNT and sarcomeric actin, displaying clear sarcomeric structures. In differentiating monolayers (Figure 2C, bottom panels), we evaluated the expression of the atrial myosin light chain (MLC2a) typical of immature/atrial CMs; conversely, very poor staining was obtained using anti-ventricular light chain (MLC2v) antibodies.
To better characterize the maturation stage reached at 30 days and the subtype of CM obtained, we measured the expression of the genes corresponding to the alfa (atrial) and beta (ventricular) myosin heavy chain (MYH6 and MYH7, respectively) and atrial and ventricular light chains (MYL7 and MYL2, respectively) by qPCR. Figure 2D shows that the mean MYH6/MYH7 ratio values were similar among hiPSC-CMs and comparable to values found in human adult atrium but not human ventricles. These data together with SLN expression, further suggest an immature/atrial rather than a ventricular phenotype for hiPSC-CMs.
Taken together these data confirm the reproducibility of the differentiating procedure among different groups and indicate that no significant differences in CM differentiation were found between AF and CTRL hiPSC lines.
3.4 hiPSC-CMs from AF patients display a higher beating rate than CTRL
In order to investigate the molecular mechanisms contributing to AF in our patients, we compared the electrophysiological properties of AF- and CTRL-CMs. Because data obtained from CMs of different CTRL clones were similar (Supplementary material online, Figure S2 and Tables S3–S5), they were pooled together.
Representative action potential (AP) traces, recorded from spontaneously beating hiPSC-CM aggregates derived from AF1, AF2, and CTRL lines are shown in Figure 3A; even if the intra-clone variability was relatively large, on average aggregates derived from the two patients were beating at significantly higher rates than those derived from control lines (Figure 3B; see also Supplementary material online, Movies S1 and S2).
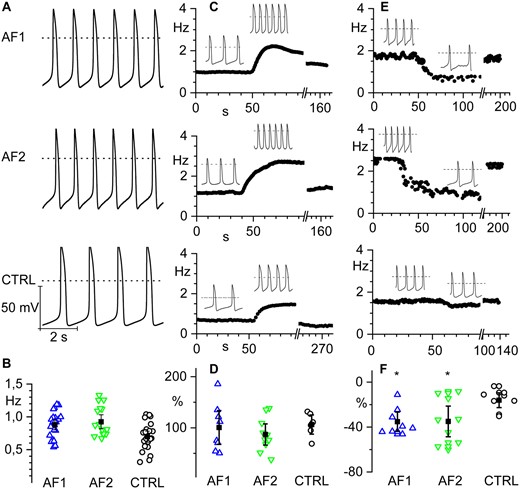
hiPSC-CMs from AF patients show increased spontaneous firing rate and similar response to β-adrenergic stimulation compared to controls. (A) Representative voltage traces of spontaneous firing recorded from hiPSC-CM clusters from AF1 and AF2 patients and CTRL as indicated. (B) Scatter plot of the firing rate (open circles) and mean values (filled squares) of AF1 (0.88 ± 0.04 Hz, n/exp = 24/6), AF2 (0.99 ± 0.07 Hz, n/exp = 19/8), and CTRL (0.72 ± 0.05 Hz, n/exp = 25/9) hiPSC-CMs. (C) Time course of the firing rate of representative hiPSC-CM clusters from AF1, AF2, and CTRL from top to bottom, respectively; the black line indicates the time of isoproterenol perfusion. Insets show representative voltage traces before and during isoproterenol stimulation. (D) Dot plot graph of the percentage increase in firing rate after isoproterenol stimulation. (AF1 100.6 ± 16.5%; n/exp = 8/3, AF2 87.0 ± 10.4%; n/exp = 10/6, and CTRL 106.4 ± 9.4%; n/exp = 6/5). (E) Time course of the firing rate of representative hiPSC-CM clusters from AF1, AF2, and CTRL before, during, and after ivabradine superfusion. Insets show representative voltage traces before and during ivabradine stimulation. (F) Dot plot of the percentage decrease in firing rate after ivabradine superfusion (AF1 −35.2 ± 4.3%; n/exp = 8/3; AF2 −34.9 ± 6.8%; n/exp = 9/3; CTRL −16 ± 3.3%; n/exp = 8/3). Data were compared using nested one-way ANOVA *P < 0.05.
No significant differences in maximum diastolic potential, amplitude, and rate-corrected duration9 were observed (Supplementary material online, Table S3). To test if the higher rate could result from elevated concentrations of intracellular cyclic AMP (cAMP), cells were challenged with a saturating concentration of the β-adrenergic agonist isoproterenol (Iso 1 µM). Panels of Figure 3C show representative time courses of spontaneous action potential rate in control, during superfusion of isoproterenol and after washout. The mean graph of Figure 3D shows that the fractional rate acceleration caused by isoproterenol was similar in all groups, suggesting that the higher basal beating rate does not depend on the modulatory pathway but likely derives from an intrinsic modification of the pacemaking mechanisms. On the other hand, we evaluated the effect of superfusion of the bradycardic agent ivabradine (3 µM). Panels in Figure 3E show representative time courses of spontaneous action potential rate in control, during ivabradine perfusion and after washout. The mean graph of Figure 3F shows that the fractional rate reduction caused by ivabradine was significantly higher in AF groups, abolishing the rate difference. These data suggest a higher than normal contribution of If to the pacemaker activity of beating AF-CMs.
3.5 hiPSC-CMs from AF patients show a gain of function of f-channels
Since the If current is a major contributor to control beating rate,10,11 we measured the pacemaker If current in isolated AF-CMs at day 15 and day 30 of differentiation, while controlling at the same time the expression of the HCN genes responsible for this current (Figure 4). Expression analysis revealed that HCN1, HCN2, and HCN3 isoforms were expressed at comparable low levels in all groups while HCN4, the most abundant isoform, was significantly more expressed in CTRL than in AF1- and AF2-CMs (Figure 4A).
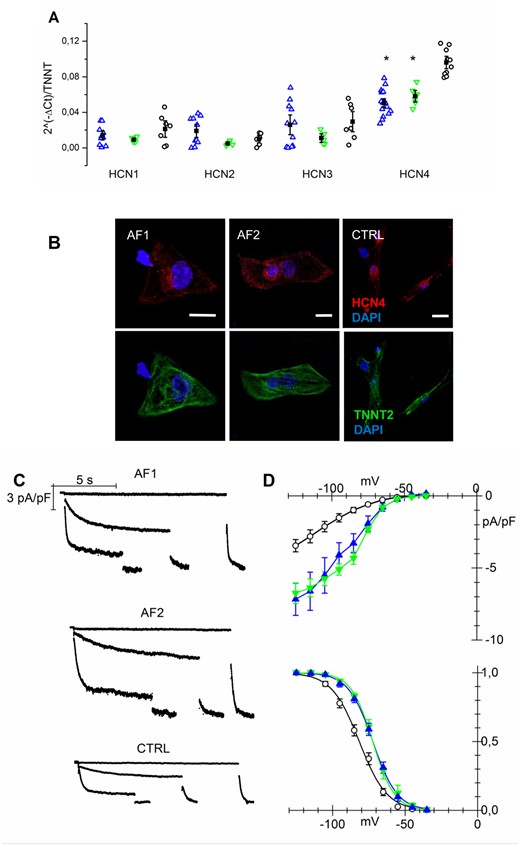
If current is increased in AF-CMs. (A) qPCR analysis of HCN isoforms normalized to troponin T expression at day 30 of differentiation. (B) Representative images of isolated AF1-, AF2-, and CTRL-CMs stained for HCN4 and cardiac troponin T (calibration bar = 10µm). (C) Representative traces of If current density recorded at −35, −75, and −105 mV followed by a step at −125 mV from AF1-, AF2-, and CTRL-CMs. (D Top) Plot of mean If current density voltage relation from AF1-CMs (blue triangles), AF2-CMs (green inverted triangles), and CTRL-CMs (white circles); Peak current density (at −125mV): AF1 = −7.17 ± 1.1*pA/pF, n/exp = 14/8; AF2 = −6.75 ± 0.72*pA/pF, n/exp = 13/3; CTRL = −3.45 ± 0.43 pA/pF, n/exp = 28/9. (Bottom) Mean activation curves of If current from AF1-CMs, AF2-CMs, and CTRL-CMs (symbols as in top panel). V1/2 values: AF1 = −71.2 ± 1.6* mV, n/exp = 21/6; AF2 = −72.7 ± 1.3* mV, n/exp = 15/4; CTRL = −81.5 ± 1.4 mV, n/exp = 28/9. Inverse slope factor values: AF1 = 8.4 ± 0.25, n = 21; AF2 = 7.5 ± 0.5, n = 15; CTRL = 9.5 ± 0.5, n = 28. *P < 0.005. Data were compared using nested one-way ANOVA *P < 00.5.
Such increase in HCN4 expression could not be confirmed by immunofluorescence analysis; representative confocal images shown in Figure 4B display similar HCN4 expression in CMs derived from the various hiPSC lines.
Functional data instead demonstrated a significant gain of function of f-channels in AF-CMs compared to CTRL cells, as shown by the representative families of If traces recorded from 30-day-old hiPSC-CMs (Figure 4C) and by the mean current density-voltage relations for AF1-, AF2-, and CTRL-CMs (Figure 4D, top). Interestingly, besides having higher density, f-channels of AF-CMs also activated at significantly more positive potentials than in CTRL-derived cells, as apparent from the mean activation curves shown in Figure 4D (bottom). It is noteworthy that at an earlier stage of differentiation (between day 15 and 20), while the current density does not differ among groups, f-channels activation is already shifted by 7 and 10 mV towards more positive potentials in AF1- and AF2-CMs, respectively, compared to CTRL (see Supplementary material online, Figure S3). Superfusion with isoproterenol (100 nM), which is known to cause a cAMP-dependent positive shift of If activation curve,12 had similar effects in all groups (shift: AF1 = 4.0 ± 0.5 mV, n = 15; AF2 = 4.1 ± 0.5 mV, n = 21; CTRL = 5.0 ± 0.7 mV, n = 9), indicating that the more positive activation depends on changes in the intrinsic properties of the channel rather than a functional modulation due to alteration in cytosolic cAMP homeostasis. Since a mis-interaction of HCN channels with caveolin-3 (CAV3) may cause both a shift of their voltage dependence and decrease in membrane expression,13,14 we evaluated if the more positive activation in AF-CMs could be due to either a decreased expression of CAV3 or a mis-localization of the channel and CAV3. We found that CAV3 was equally expressed in AF- and CTRL-CMs and HCN4 co-localized with CAV3 (Supplementary material online, Figure S4).
3.6 AF-CMs display an increase in the L-type calcium current with a preserved calcium handling
Antiarrhythmic drugs aimed at controlling heart rhythm often target calcium currents and in particular L-type calcium currents. We thus evaluated the expression levels and functional properties of calcium channels. qPCR analysis revealed that CACNA1C and CACNA1D genes, responsible for the ICaL current, were similarly expressed in AF- and CTRL-CMs with CACNA1C as the prevalent isoform (Figure 5A). Electrophysiological analysis revealed instead that AF-derived cells show a significantly larger nifedipine-sensitive ICaL current than CTRL-CMs as shown by representative traces in Figure 5B and by the mean current density-voltage relations plotted in Figure 5C (top). All samples had similar activation and inactivation curves (Figure 5C, bottom).
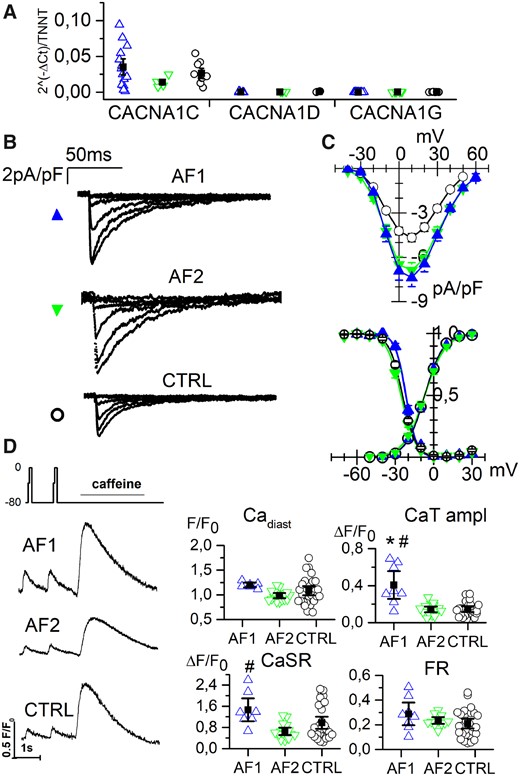
L-type calcium current is increased in AF-CMs. (A) qPCR analysis of L-type calcium channel isoforms (1C, 1D) and T-type isoform (1G) expression normalized to troponin level at day 30 of differentiation. (B) Representative traces of ICaL current density recorded by 10 mV steps to the range of −40/+10 mV from AF1-, AF2-, and CTRL-CMs. (C Top) Plot of mean ICaL current density voltage relation from AF1-CMs (blue triangles), AF2-CMs (green inverted triangles), and CTRL-CMs (white circles). Peak current density (at 10 mV): AF1 = −7.4 ± 0.6*pA/pF, n/exp = 34/6; AF2 = −6.9 ± 0.5*pA/pF, n/exp = 30/8; CTRL = −4.7 ± 0.3 pA/pF, n/exp = 52/11. (Bottom) Mean activation and inactivation curves of ICaL current from AF1-CMs, AF2-CMs, and CTRL-CMs (symbols as in top panel) V1/2 values of activation: AF1 = −6.6 ± 1.2 mV, n/exp = 29/6; AF2 = −6.8 ± 1.0 mV, n/exp = 31/8; CTRL = −7.4 ± 0.5 mV, n/exp = 51/11. V1/2 values of inactivation: AF1 = −21.8 ± 0.7 mV, n/exp = 16/6; AF2 = −25.4 ± 0.8 mV, n/exp = 25/8; CTRL = −24.5 ± 0.5 mV, n/exp = 36/11. (D) Left, examples of calcium transients recorded from AF1-, AF2-, and CTRL-CMs applying the protocol shown. Right, dot blot graphs of the Ca diast, CaT amplitude, CaSR, and FR data in the three groups, as indicated. For values see Supplementary material online, Table S5. Data were compared using nested one-way ANOVA *P < 0.05 vs. CTRL; #P < 0.05 vs. AF2.
Notably, the difference in ICaL density was already detectable at an early stage of differentiation (see Supplementary material online, Figure S3). We did not detect the expression of CACNA1G gene (Figure 5A) and indeed we could never record a T-type calcium current (data not shown).
To verify whether ICaL enhancement in AF-CMs might alter the excitation-contraction coupling mechanism, intracellular Ca2+ handling was evaluated. In order to analyse only the primary effects on the intracellular Ca2+ handling, cells were voltage-clamped and stimulated at 1 Hz and diastolic calcium (Cadiast), Ca2+ transient (CaT) amplitude, and sarcoplasmic reticulum (SR) Ca2+content (CaSR) measured. In Figure 5D left, representative traces are shown together with the protocol. The analysis revealed that Cadiast was similar in all groups, while AF1-CMs showed an increased CaT amplitude and an increase in CaSR, compared to CTRL-CMs and AF2-CMs. AF2-CMs values were similar to those of CTRL-CMs. However, fractional release (FR) did not change among groups, suggesting a preserved SR stability in AF as in CTRL cells under resting condition (Figure 5D, right). The Ca2+ parameters for the three separate CTRL lines can be found in Supplementary material online, Table S5. In agreement with these data, Western blot analyses on SERCA2 and phospholamban did not reveal any difference (Supplementary material online, Figure S5).
3.7 AF-CMs show longer action potential duration without changes in repolarizing currents
Once isolated, the great majority of hiPSC-CMs were quiescent but when stimulated (at 1 Hz) they fired action potentials. In Figure 6, the histograms of action potential duration (APD)90 obtained from AF1-, AF2-, and CTRL-CMs show that, despite the large variability of data, intrinsic to this cell model, AF-CMs have a wider distribution of APD (Figure 6A) with action potentials lasting as much as 300 ms, while none of the action potentials recorded from CTRL-CMs lasted more than 200 ms. In Figure 6B representative traces recorded from the three groups highlight the prolongation of APD in AF-CMs.
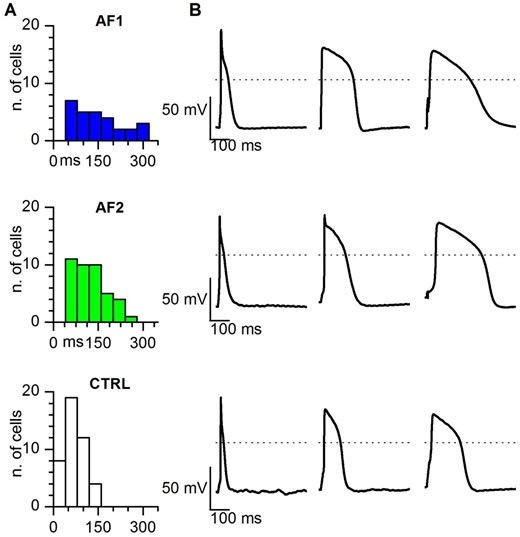
Action potential duration is longer in AF-CMs compared to CTRL-CMs. (A) Histograms of the distribution of the APD90 in AF1, AF2, and CTRL cells, as indicated. Bin size = 40 ms. (B) Representative action potentials with the shortest (left), average (centre), and longest (right) APD90 recorded at 1 Hz stimulation in AF1 (top), AF2 (middle), and CTRL (bottom) CMs. Dashed lines indicate the 0 mV level.
On average patient-derived cells displayed significantly longer APD at 30, 50, and 90% of repolarization (see Table 1), in agreement with the presence of a larger Ical.
Stimulated action potential analysis
| APD30 (ms) | APD50 (ms) | APD90 (ms) | MDP (mV) | dV/dT | APA (mV) | |
|---|---|---|---|---|---|---|
| AF1 (n/exp = 40/11) | 80.2 ± 9.4* | 105.1 ± 11.2* | 137.3 ± 12.7* | −55.7 ± 1.4 | 57.6 ± 11.9 | 92.78 ± 3.9 |
| AF2 (n/exp = 39/12) | 71.2 ± 6.7* | 92.6 ± 8.2 * | 120.6 ± 8.8* | −58.8 ± 0.9 | 46.6 ± 6.6 | 93.9 ± 3.4 |
| CTRLs (n/exp = 61/13) | 39.9 ± 3.2 | 52.4 ± 3.7 | 74.1 ± 4.1 | −56.9 ± 0.9 | 41.3 ± 8.4 | 86.7 ± 2.4 |
Stimulated action potential properties of hiPSC-CMs paced at 1 Hz: action potential duration (APD30, 50, and 90), maximum diastolic potential (MDP), slope (dV /dT), and action potential amplitude (APA) *P< 0.05 by one-way ANOVA.
Because of this APD prolongation, we decided not to categorize the CM population in nodal-, atrial-, or ventricular-like cells based on the APD ratio. Indeed, the classifications based on either the APD90/APD5015 or the APD30–40/APD70–80 ratios,16 revealed that 66.5 or 68.5% of CTRL-CMs seems to be atrial-like, while these percentages were substantially lower for AF1-CMs (52.5–47.5%) and AF2-CMs (48.7–41.0%). However, as apparent in the Supplementary material online, Figure S6, most of the AF-derived CMs fall close to the cut-off values separating atrial from ventricular cells. Since AF-CMs show a larger Ical and, as a consequence, a APD prolongation, a certain number of atrial-like cells would indeed pass the threshold and enter the ‘ventricular-like’ category even if they are not actually ventricular cells. Therefore, in this specific case, a selection of cells based on these criteria would obviously introduce a bias in the results.
Of the main repolarizing currents, we were able to analyse the delayed rectifier current IKr, whose density and kinetics did not differ between AF- and control-CMs (Supplementary material online, Figure S7). Under our differentiation conditions IKs was absent while, in agreement with the depolarized resting potential, IK1 was expressed at very low levels (data not shown), as previously reported.17
Because of the difference in the L-type calcium current, we evaluated the presence of calcium-dependent K+ currents. Application of both apamin (100 nM), a specific blocker of the SK3 channel and charybdotoxin (100 nM), a blocker of the BK channel, did not have any effect on stimulated action potentials, thus suggesting a negligible expression of these channels (data not shown).
3.8 AF-CMs display larger delayed-after-depolarizations and an increased number of ectopic beats under stressful conditions
Finally, we evaluated if the electrophysiological alterations found in AF-CMs may be pro-arrhythmic by pacing both CTRL- and AF-CMs at 0.5 Hz and superfusing them with isoproterenol (100 nM) and E4031 (300 nM). This treatment, as expected, caused a significant prolongation of the APD and eventually the development of delayed-after-depolarizations (DADs) and/or triggered AP (Figure 7A). In Figure 7B, the proportion of CMs showing DADs, triggered AP, or the APD prolongation only (no events) for AF1, AF2, and CTRL-CMs is plotted. A significantly higher percentage of AF cells displayed triggered AP than CTRL cells, under this stressful condition (Figure 7B).
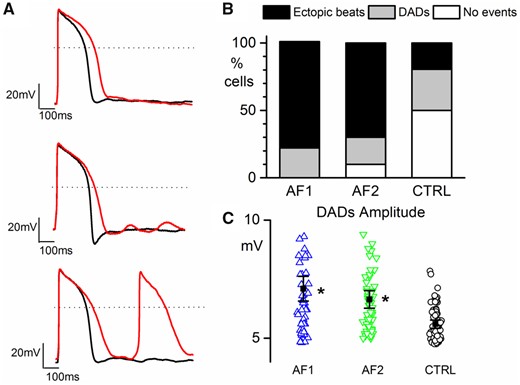
AF-CMs are more arrhythmogenic. (A) Representative action potentials in Tyrode (black line) and during perfusion of 100 nM isoproterenol + 300 nM E4031 (red line) showing no events (top), DADs (middle), and ectopic beats (bottom) recorded from AF2-CMs paced at 0.5 Hz; dashed lines indicate the 0 mV level. (B) Plot of the percentage of cells showing ectopic beats (AF1 7 out of 9/3 cells/exp, 78.8%*; AF2 7 out of 10/3 cells/exp, 70.0%*; CTRL 7 out of 36/6 cell/exp, 19.5%), DADs (AF1 2 out of 9, 22.2%; AF2 2 out of 10, 20.0%; CTRL 11 out of 36, 30.5%), and no events (AF1 0 out of 9, 0%; AF2 1 out of 10, 10.0%; CTRL 18 out of 36, 50%). (C) Plot of DADs amplitude in AF1-CMs (blue triangles), AF2-CMs (green inverted triangles), and CTRL-CMs (white circles). Values are AF1 = 6.95 ± 0.62* mV, n/exp = 60/3; AF2 = 6.73 ± 0.26* mV, n/exp = 66/3; CTRL = 5.66 ± 0.16 mV, n/exp = 70/6. Percentage data were compared using Fisher’s exact test, adjusting the P-value with Bonferroni correction. Amplitude data were compared using nested one-way ANOVA *P < 0.05.
Furthermore, even if the proportion of cells with DADs was not different among the three cell populations, on average, DADs from AF1 and AF2 cells had a higher amplitude than those from CTRL cells (Figure 7C).
4. Discussion
4.1 Whole exome screening reveals a complex genetic background in the siblings affected by AF
Although AF is the most prevalent cardiac arrhythmia in the developed world,18 the pathophysiology of this complex heart rhythm disorder is still incomplete. The changes leading to the initial occurrence of AF are still elusive because (i) it is a progressive disease, (ii) human cardiac diseased tissues have undergone extensive remodelling, and (iii) no animal models fully recapitulate the disease.
The discovery of genetic forms of AF, linked to single gene mutations, and genome-wide association studies have improved our knowledge of causative mechanisms underlying AF.1 Monogenic forms of AF are rare but, since the probability to develop AF increases in the presence of affected relatives,2 a complex genetic background can be hypothesized. Indeed, we described a family in which three siblings, diagnosed with AF, share several mutations that can contribute to determine this arrhythmia.
Among these genes, only ZFHX3 has been previously associated with AF in GWAS studies.1 Nevertheless, the contribution of the other cardiac and non-cardiac mutated genes to AF onset is hard to dissect.
4.2 Generation of functional hiPSC-CMs overcomes the problems linked to genetic complexity of the disease
Because of this genetic complexity, an approach based on the evaluation of the contribution of each single mutation is clearly unfeasible and unlikely to provide a comprehensive description of the pathology. In order to estimate the full range of the effects of genetic alterations, we thus approached the problem from a functional point of view. We decided to use patient-derived hiPSCs to obtain a human cardiac cell model that possesses the entire patient’s genetic background. Although the limitation linked to the well-known phenotypic immaturity of hiPSC-CMs,19 these cells have already been widely used to study monogenic forms of cardiomyopathies and arrhythmias.5 On the contrary, their use for modelling complex genetic pathologies is a rarely adopted approach.20,21
Here, we analysed for the first-time hiPSC-CMs from patients with a complex genetic form of AF. It must be emphasized that this model does not intend to recapitulate either the complexity of the atria or the entire clinical aspects of the disease but represents a novel tool to understand the molecular mechanisms underlying excitability alterations in diseased human CMs.
Because of the lack of healthy controls within the family and the unfeasibility to generate isogenic hiPSCs, due to the complex genetic alterations, AF clones were compared with four different lines generated from unrelated healthy controls. These controls were chosen based on different variables that could potentially affect the comparison with CMs derived from our patients: sex (female and male), age (middle aged), and reprogramming procedure (retroviral infection from skin fibroblast and keratinocyte).
Once established the pluripotency of the clones, we choose those clones displaying a good cardiac differentiation capacity for further characterization. Our molecular data on the expression of the myosin heavy and light chain isoforms indicate that hiPSC-CMs are mainly immature/atrial rather than ventricular cells, independently of the cell line. Because a certain degree of maturation can be achieved in culture, especially in the electrical properties,19 we decided to compare the AF and control lines at an early (15–20 days) and at a late stage of differentiation (30–35 days).
4.3 AF-CMs show a high beating rate due to increased If and ICaL currents
We started to analyse the spontaneous beating rate of small aggregates and found that AF-CMs beat at a significantly higher rate than those from the controls, while no differences were found in the other parameters. Since the beating rate is physiologically modulated by the β-adrenergic/adenylate cyclase/cAMP pathway and an increase in rate may derive from an imbalance of this system, we tested the ability of the cells to respond to the β-adrenergic agonist isoproterenol. A saturating concentration of isoproterenol caused similar increases in rate in all the lines thus excluding differences in intracellular cAMP concentration as a cause of the higher rate in AF-CMs. AF onset is often associated with elevated heart rates. A few studies have indeed shown that initiation of post-operative AF, in patients undergoing coronary artery bypass surgery, was preceded by a significant increase in sinus rate mediated by either high levels of circulating norepinephrine22 or by an unbalance of the autonomic tone towards the sympathetic input.23
The funny current is the pacemaker current critical to the initiation and regulation of cardiac pacemaker activity10 and an increase in its contribution can indeed be arrhythmogenic.24 The expression of f-channels (HCN1–HCN4) has been demonstrated also in non-pacemaker cardiac cells and in the working myocardium where it is abundant during fetal and neonatal life or under pathological conditions.25 We found that the HCN4 gene is the most expressed isoform in hiPSC-CMs and is less expressed in AF-CMs than in control-CMs. Direct recording of the If current from isolated hiPSC-CMs, however, demonstrated a significant gain of function of f-channels due to both a rightward shift of the activation curve (both at early and late differentiation time-points) and an increase in current density (at later stages of differentiation) in AF compared to controls. Although molecular and functional data are discordant, they are in agreement with previous data from Stillitano et al.26 These authors found that mRNA of HCN4 was down-regulated in chronic atrial fibrillation (cAF) CMs while the protein level tended to be higher. Although they have found similar current densities, the cAF cells displayed f-channels with activation curve shifted to more positive potentials than control cells by about 10 mV,26 similar to our results.
Since CAV3 is known to interact with HCN413 and it has been already reported in pluripotent-derived CMs that different expression of CAV3 can shift If activation curve,14 we analysed the CAV3 expression both at mRNA and protein levels without detecting any difference between AF and CTRL groups (Supplementary material online, Figure S4).
A possible contribution of an increased If current to abnormal automaticity in the atrium in paroxysmal AF has been described by Nattel and Dobrev4 in a recent review.
Our results on L-type calcium current seem to be less in accordance with the evidence that AF induces a reduction of calcium currents. Indeed, atrial CMs derived either from patients with AF or from animal models of fast atrial pacing show a significant reduction of the effective refractory period (ERP) and of the ICaL current, compared to controls.4,27 The reduction of calcium current and ERP seems, however, the consequence rather than the cause of AF and is attributable to the maladaptive remodelling of atrial tissue. In support of a role of an increased ICaL to AF, a few studies have shown that an initial calcium overload can be the stimulus that triggers maladaptive changes in atrial protein expression, based on the evidence that the calcium blocker verapamil prevents such remodelling.28,29
Albeit the magnitude of ICaL density has not been regularly associated with a higher probability to develop post-cardiac surgery AF,30 it is interesting to note that Van Wagoner et al.27 have shown that patients in sinus rhythm who developed AF following cardiac surgery had a significantly higher pre-operative ICaL density than those that did not experience post-operative AF. This observation, together with our data showing that CMs from AF patients display an ICaL twice as big as that of controls, is consistent with the concept that calcium overload may be an important factor in the initiation of AF, while ICaL depression is a consequence of AF.
4.4 AF-CMs display a prolonged APD and an increased susceptibility to arrhythmic activity
Despite the lack of any evident modulation of specific calcium channel isoforms, many mechanisms may contribute to an increased ICaL current such as, for example: miRNA-mediated modulation of expression,31 altered channel trafficking/recycling,32 channel oligomerization,33 and modulation by accessory subunits.34 The observed increase of the inward calcium current not accompanied by a counterbalancing increase in outward currents is expected to prolong the APD. Indeed, Sato et al.35 has shown that an increased cooperative gating of L-type calcium channels increases current density and causes APD prolongation, in in silico experiments. Despite the large variability in APD duration typical of the CMs derived from hiPSCs (Figure 6),17 we observed a significant prolongation of the APD in paced AF-CMs compared to controls. Usually, variability in APD is decreased by dividing CMs in nodal-, atrial-, and ventricular-like cell based on the slope of fast depolarization and APD ratio.15,16 In our specific case, the selection of the cardiac cell type using the criteria based on the APD ratio is not applicable since APD is in fact exactly the parameter which is altered in AF-CMs, according to our results.
Although data on calcium handling do not indicate a significant instability of the SR, at least under ‘basal’ conditions (fixed stimulus duration and Tyrode solution), this situation may, however, be quite different in a scenario in which calcium dynamics are affected by the duration of the action potential and/or under the prevalence of sympathetic tone. It is known from the literature, for example, that the catecholamine-mediated trigger for inducing AF involves a significant increase of atrial ICaL.36 In agreement with this situation, our data on paced cells show that under stressful conditions (isoproterenol + E4031) AF-CMs are significantly more prone to generate arrhythmic events than CTRL-CMs, as indicated by larger DADs that more easily give rise to ectopic beats. The underlying mechanism may be related to the very long action potential during β-adrenergic stimulation in AF-CMs in which the contribution of ICaL become more relevant than in CTRL-CMs. Together, our data suggest that the increase in ICaL and in If current are likely to be the trigger for the initiation of AF.
4.5 Study limitations
Because sibling’s parents are deceased, and their sons/daughters are still too young for ruling out AF, we could not derive hiPSCs from healthy relatives. We bypassed this limitation by comparing data with those obtained from at least three unrelated healthy controls, which displayed similar results among them. At the time we started to collect data, no protocols for selecting specifically atrial-like hiPSC-derived CMs were available. However, even if we did not select a specific hiPSC-CM atrial subpopulation, and despite the fact that the arrhythmogenesis due to a gain of function of inward currents can be more easily demonstrated in hiPSC-CMs lacking IK1, we believe that the changes observed in If and ICaL could induce triggered automaticity also in vivo, specifically in the atria, due to the fact that the adult atrium shows a significantly lower conductance than ventricle, near the resting potential.3,37
5. Conclusions
In conclusion, we provide in the present work the first demonstration that hiPSCs can be used as a cellular model of a human cardiac pathology with a complex genetic background. Independently of the genetic alterations, we demonstrated that hiPSC-CMs from two sisters with AF show a higher spontaneous rate of contraction and a gain of function of both the If and the ICaL currents relative to CMs derived from any of four control individuals. We suggest that the increase of these depolarizing currents and other still unknown factors can contribute to the induction of abnormal automaticity in atrial cells and can thus be the triggering event of this specific type of AF.
Time for primary review: 40 days
Acknowledgements
We acknowledge Angela De Luca, Marialaura Serzanti, Giulia Savio, and Laura Tononi for technical assistance; Gianluigi Condorelli for helpful discussions; and Paola Aldegheri for the informations on patients’ clinical history.
Conflict of interest: none declared
Funding
E.C. was a recipient of the Giuseppe Marai INN fellowship. This work was supported by the European Research Council-ERC (2012-StG-311736-PD-HUMMODEL) to A.C., the Spanish Ministry of Economy and Competitiveness-MINECO (SAF2015-69706-R and BFU2016-80870-P), Instituto de Salud Carlos III-ISCIII/FEDER (Red de Terapia Celular - TerCel RD16/0011/0024), AGAUR (2014-SGR-1460) to A.R. and A.C. and CERCA Programme / Generalitat de Catalunya to A.R. Fondazione Cariplo (Grant numbers 2014-0822 to P.D.E.; 2014-1090 to A.B.; and 2014-0728 to D.D.).
References
This is the first time a human cellular model of atrial fibrillation (AF), based on the analysis of iPSC-derived cardiomyocytes from patients, is presented. Comparing cells from two sisters of a family with a complex genetic form of AF with those from healthy controls, we found peculiar alterations in two ion currents potentially involved in AF aetiology. Despite progresses in the management of AF, efficacy in maintaining sinus rhythm is modest. Human-based models elucidating the molecular mechanisms underlying AF will help define the best therapeutic approach. We propose to personalize AF therapy based on functional alterations found in patient-specific cardiomyocytes.
Author notes
Patrizia Benzoni and Giulia Campostrini contributed equally to the study.
