


Abstract
Previous research indicates that insulin-like growth factor binding protein 7 (IGFBP7) protein levels in breast cancer tissue and blood are prognostic. However, genetic determinants of IGFBP7 in breast cancer remain largely unexplored. We examined IGFBP7 in a cohort of 1701 patients with first breast cancer from Sweden, enrolled prior to surgery 2002–16 and followed for up to 15 years. Genotyping was performed on blood samples using OncoArray. Tumor-specific protein levels of IGFBP7, insulin receptor (InsR), and IGF-I receptor (IGFIR) were assessed on tumor tissue microarrays in 964 patients. Furthermore, 275 patients had plasma IGFBP7 levels measured. A genetic proxy marker for circulating IGFBP7 levels was constructed from five candidate single-nucleotide polymorphisms (SNPs) (rs6852762, rs1714014, rs9992658, rs10004910, and rs4865180) based on number of recessive genotypes. Age-adjusted linear regression was used to evaluate SNPs and tumor-specific IGFBP7 levels in relation to circulating IGFBP7 levels. Cox regression adjusted for age, tumor characteristics, and adjuvant treatments was used to assess associations with clinical outcomes. Circulating and tumor-specific IGFBP7 levels were significantly positively correlated. High circulating and genetically predicted IGFBP7 levels were associated with increased risk for distant metastasis and all-cause mortality. A significant interaction between high tumor-specific IGFBP7 levels and membrane-bound InsR resulted in a four-fold increased risk of breast cancer events and distant metastases. Both measured and genetically predicted IGFBP7 levels were independent prognostic biomarkers in breast cancer.

Introduction
Prior research indicates that insulin-like growth factor binding protein 7 (IGFBP7) protein expression in breast cancer tissue and circulation provides prognostic value in breast cancer [1,2]. Recently, we reported that IGFBP7 gene expression predicted the efficacy of type 1 insulin-like growth factor receptor (IGFIR) monoclonal antibody ganitumab (AMG479) and metformin added to chemotherapy in breast cancer [3]. IGFBP7 was the only IGFIR signaling axis biomarker predictive of ganitumab benefit [3,4]. This suggests that IGFBP7 is an important biomarker in breast cancer. However, there are major knowledge gaps concerning the biology of IGFBP7, and its role in breast and other cancer types has not yet been extensively characterized.
IGFIR signaling has long been associated with breast cancer growth, proliferation, and survival [5,6]. Unlike other IGFBPs, IGFBP7 can bind to the IGFIR and the insulin receptor (InsR), as well as to insulin-like growth factor (IGF)-I and IGF-II ligands. IGFBP7 binds IGF-I and the IGFIR in a mutually exclusive manner [7]. In contrast to other IGFBPs, IGFBP7 binds insulin with higher affinity than IGFs [7,8]. The binding of IGFBP7 decreases the activation and internalization of IGFIR in response to IGF-I/II and, in parallel, sensitizes IGFIR to insulin stimulation [7,8]. One study reported that the prognostic significance of circulating IGFBP7 levels was also dependent on tumor IGFIR status [2]. In addition, tumor-specific IGFBP7 has been shown to carry prognostic information alone and in combination with lifestyle and endocrine treatment type [1]. Still, a comprehensive model of IGFBP7 actions in breast cancer has not yet been established.
The role of IGFBP7 is better characterized in cardiovascular disease than in cancer. IGFBP7 has a key role in the development and progression of heart failure [9–12]. IGFBP7 is also one of the most promising biomarkers of heart failure identified to date and predicts cardiovascular events, myocardial infarction, and all-cause mortality. Furthermore, IGFBP7 has been reported as a strong predictor of sodium-glucose co-transporter 2 (SGLT2) inhibitor efficacy, a medication with broad cardiorenal and metabolic protective properties [13]. Interestingly, epidemiological, clinical, and in vivo studies have recently suggested a plausible direct effect of cardiovascular disease on the enhancement of tumor growth and metastasis [14–16]. In vivo models of colon and breast cancer showed that heart failure subsequent to myocardial infarction enhanced cancer growth and metastasis, through immunosuppressive cell reprogramming within the tumor microenvironment (TME) [17]. Taken together, these findings suggest that IGFBP7 may be an important link between the TME, cancer, and cardiovascular disease, and serve as a marker of a common biological process [3].
It remains unclear whether the levels of circulating and tumor-specific IGFBP7 are primarily regulated by genetics or lifestyle. Several large-scale genome-wide association studies have been conducted to explore links between the genome and the plasma proteome, where new protein quantitative trait loci (pQTL) associated with IGFBP7 were identified [18–21]. However, no study has specifically focused on IGFBP7 to explore relationships between the genome and concentrations of the corresponding protein in both plasma and tumors nor have data concerning all loci been confirmed.
Herein, we present a comprehensive translational and genetic characterization of IGFBP7 and show that circulating and tumor-specific IGFBP7 can be used as biomarkers for distant metastasis and death in breast cancer patients overall, as well as in different adjuvant treatment groups.
Materials and methods
BC-Blood description
The BC-Blood cohort consists of patients operated for primary breast cancer at Skåne University Hospital, Lund, Sweden. The inclusion of patients occurred between diagnosis and surgery. Only patients diagnosed with first primary breast cancer and who had not been diagnosed with other cancers within 10 years were included. At inclusion (the preoperative visit), a questionnaire regarding lifestyle and reproductive factors was completed, and research nurses took anthropometric measurements and collected EDTA plasma. Clinical data were obtained from medical records, pathology reports, and registries. The study was approved by the Lund University Ethics Committee (Dnr 75-02, Dnr 37-08, Dnr 658-09, and amendments). All participants signed a written informed consent.
Per the Swedish clinical routine, the estrogen receptor (ER) and progesterone receptor (PgR) positivity cut-offs were > 10% stained nuclei. For patients with missing human epidermal growth factor receptor 2 (HER2) status, HER2 status was obtained from dual gene protein staining of HER2 on tissue microarrays, which showed 97.7% agreement with available pathological assessment [22]. Body mass index (BMI) was dichotomized as ≥ 25 kg/m2.
For patients included 2002–16, genotype information was available. After excluding patients with carcinoma in situ, preoperative treatment, recurrence within 0.3 years of inclusion, or no available genotype, 1701 patients with invasive breast cancer remained. Tumor tissue microarrays (TMAs) were constructed for patients included 2002–12, and after the exclusion of patients with invasive bilateral cancer (n = 19), 998 patients remained, 34 of whom did not have tissue on the TMA, leaving 964 patients for tumor protein evaluation [23]. Furthermore, preoperative plasma IGFBP7 levels were analyzed in 265 patients who were included between 2002 and 2010 and who were part of a nested case-control study [2]. Plasma IGFBP7 levels were also analyzed for an additional 10 patients, at the same time, leaving a total of 275 patients with IGFBP7 analytes. These three subcohorts of patients were used for analysis: (I) available genotypes only (n = 1701), (II) available genotypes and constructed TMAs (n = 998), and (III) available genotypes, tumor protein levels, and plasma levels (n = 275) (Supplementary Fig. S1).
The blood samples collected at the preoperative visit were used to measure total plasma IGFBP7 levels using ELISA (Antigenix America Inc., Huntington Station, NY) [2]. Details on sample processing and quality control have been described elsewhere [2].
TMA construction, staining, and evaluation
TMAs with duplicate 1 mm tissue cores were constructed from representative tumor regions of formalin-fixed paraffin-embedded tissue blocks, as previously described [23]. TMA-sections, pre-treated for antigen retrieval, were stained with the following antibodies: IGFIRβ (sc-713, Santa Cruz Biotechnology; dilution 1:150), insulin receptor (β-subunit) (GR36, Calbiochem; dilution 1:50), and IGFBP7 antibody (ab74169, Abcam; diluted 1:600). Further details on tissue processing and staining are described elsewhere [1,23]. Two evaluators (S.B. and A.H.R.) blinded to clinical data evaluated IGFIR and InsR stainings as previously described [23]. Likewise, IGFBP7 staining was evaluated by two different evaluators (C.G. and S.K.) blinded to clinical data as previously described [1]. To define IGFIR and InsR status, both cytoplasmic and membrane staining of invasive tumor cells were considered [23]. For IGFBP7 only cytoplasmic staining of invasive tumor cells was considered [1]. The status of the different markers in tumors was defined as follows: IGFIR (n = 904) status as ‘not strong’ or strong, InsR (n = 881) status as negative/weak or moderate/strong, and IGFBP7 (n = 859) status as weak, intermediate, or high [1]. Furthermore, both IGFIR membrane (n = 904) and InsR membrane (n = 881) status were classified as negative or positive membrane staining [2,23].
Genotyping and genetic analyses
From the leukocyte portion of whole blood, DNA was extracted using DNeasy® Blood and Tissue kit and processed with QiaCube (Qiagen, Hilden, Germany) according to the manufacturer’s instructions. Single-nucleotide polymorphism (SNP) genotyping was performed by the Centre for Translational Genomics at Lund University using OncoArray by Illumina, specifically designed to evaluate genetic variants for association with multiple cancer types (including breast) [24]. Details on the genotyping calling have been previously described [24]. Standard quality control was performed on all scans. All samples with low call rates (< 1 × 10⁻⁵), SNPs with minor allele frequency < 1% or call rate < 98% were excluded [24]. SNPs (n = 50) from the IGFBP7 and IGFBP7-antisense 1 (AS1) genomic region ± 100 bp were selected. For each SNP, genotype intensity cluster plots were examined manually to judge reliability [25]. SNPs that had any minor allele frequency < 5% or had missing data for more than 2% of patients were excluded (n = 8). All 42 SNPs were in the Hardy–Weinberg equilibrium. For SNP selection, literature search resulted in the collection of 13 variants previously identified as cis-acting eQTL/pQTL for IGFBP7 (Supplementary Table S1). Genotyped SNPs in linkage disequilibrium (LD) with one or more of the 13 variants were selected as proxy variants using the LDLinkr package [26]. When several proxies were found, the one with the highest LD was chosen, resulting in the selection of four IGFBP7 SNPs (rs1714014, rs9992658, rs10004910, and rs4865180) for further analyses. In addition, the remaining 38 successfully genotyped SNPs were individually analyzed based on tumor/plasma IGFBP7 modulation within the BC-blood cohort, resulting in the addition of one more SNP (rs6852762) to the analyses.
IGFBP7 mRNA expression in healthy breast tissue and breast cancer
To determine whether IGFBP7 is similarly expressed in healthy breast tissue and breast cancer tissue, IGFBP7 mRNA was analyzed using the Broad Institute’s Single Cell Portal. Single-cell RNA sequencing data from 26 primary breast cancer tumors and 16 healthy breast tissue samples obtained from prophylactic mastectomies or reductive mammoplasties were examined to identify which cell types express IGFBP7 [27,28].
Statistical analyses
Spearman’s rank correlation coefficient was calculated between plasma IGFBP7 levels (log-transformed continuous) and age at inclusion (continuous). To test if each of the individual 42 SNPs predicted plasma IGFBP7 levels (log-transformed continuous) in the 275 patients, linear regression models were fitted. The regression model included each respective SNP and was adjusted for age at inclusion (continuous). To agnostically test whether the associations were dominant, co-dominant, or recessive, each variant allele was included as a factor and the homozygous wildtype was used as a reference. An age-adjusted linear regression model was also used to examine the relationship between circulating and tumor-specific IGFBP7 levels.
To investigate whether genetically predicted IGFBP7 plasma levels were associated with clinical outcome, a genetic proxy was constructed where the number of recessive genotypes (of rs6852762, rs1714014, rs9992658, rs10004910, and rs4865180) were added together, resulting in the number of homozygous variant genotypes of pQTL per patient depending on whether the recessive allele was associated with lower or higher IGFBP7 levels. Two recessive variants (rs9992658 and rs4865180) were associated with lower IGFBP7 levels (proxy genotype of ‘−1’). The proxy genotype of ‘0’, representing intermediate IGFBP7 levels, consisted of either absence of any recessive variants or a net value of zero after adding all recessive variants, while ‘1+’ consisted of a net value of one or more recessive variants associated with high IGFBP7 levels after subtracting any −1 proxies. LDlinkr was used to explore previous associations with expression quantitative trait loci (eQTL) (Supplementary Table S1). A multinomial age-adjusted logistic regression was used to test potential associations between tumor-specific IGFBP7 protein levels and the five candidate SNPs. This was done in the 964 patients who had both genotype and tumor protein level data available. Associations between tumor-specific IGFBP7 levels and other tumor markers were evaluated with Fisher’s exact test or chi-squared test, wherever appropriate.
The endpoints used in survival analyses were any breast cancer event, distant metastasis, and death. The breast cancer event endpoint comprised locoregional recurrence, distant metastasis, or contralateral breast cancer. Breast cancer-free interval (BCFI) and distant metastasis-free interval (DMFI) were calculated from inclusion until the first event. Patients without any events were censored at the time of the last follow-up before emigration, death, or last follow-up by June 30, 2019. Overall survival (OS) was defined as the time until death or last follow-up by June 30, 2019.
IGFBP7 plasma levels were categorized into tertiles based on the distribution among all 275 patients. IGFBP7 levels ranged from 17.70 to 184.75 ng/ml and the cut-off values between tertiles were 31.05 and 38.05 ng/ml (T1 = 17.7–31.02 ng/ml, T2 = 31.05–38.04 ng/ml, and T3 = 38.05–184.75 ng/ml). T1 was used as a reference in the survival analyses.
Univariable survival analyses were conducted with Log-rank tests and Kaplan–Meier curves. Cox proportional hazard models were used to calculate hazard ratios (HR) with 95% confidence intervals (CI). Two models were used: Model 1 was adjusted for age at inclusion (continuous), and tumor characteristics (invasive tumor size (pT2/3/4), nodal status (pN1/2/3), grade III, and ER+). Model 2 included model 1 and was further adjusted for adjuvant treatments (chemotherapy, radiotherapy, trastuzumab, tamoxifen, and aromatase inhibitors). Potential associations between tertiles of IGFBP7 plasma levels and the three endpoints were investigated in the 275 patients with available IGFBP7 plasma levels. The multivariable model 1 was used with additional adjustment for BMI ≥ 25 kg/m2. Furthermore, potential associations between the five candidate SNPs and the proxy genotype for any homozygous variant SNP (−1/0/1+) and three endpoints were investigated in all 1701 patients with available genotypes.
To investigate effect modifications between the tumor-specific IGFBP7 protein level, membrane IGFIR, and membrane InsR status, two-way interaction analyses on multiplicative and additive scales were performed in the adjusted model using the ‘interactionR’ package [29]. The analyses were performed using model 2 and included an additional adjustment for the time between surgery and staining (TBSAS) in order to reduce technical bias since the staining intensity may vary depending on time between surgery and staining [23].
Effect modifications between the five candidate SNPs and treatments were investigated using the same procedure. The interaction analyses involving tamoxifen and aromatase inhibitors were restricted to patients with ER + tumors. These analyses were performed using multivariable model 2.
All statistical analyses were conducted in R version 4.3.2. All statistical tests were two-sided, and P-values < 0.05 were considered statistically significant. All presented P-values are nominal due to the exploratory nature of this study. This study followed the Strengthening the Reporting of Observational Studies in Epidemiology (STROBE) guidelines [30].
Results
The relationship between tumor, plasma, and genetically predicted IGFBP7 levels
Descriptive statistics and patient selection flowchart are presented for each of the three subcohorts in Table 1 and Supplementary Fig. S1, respectively.
Descriptive statistics of the three subcohorts (all patients, tumor tissue, and plasma levels).
| Characteristic | Missing | N = 1,701 | N = 998 | N = 275 |
|---|---|---|---|---|
| n | n (%); Median (IQR) | n (%); Median (IQR) | n (%); Median (IQR) | |
| rs6852762 | 1 | |||
| GG | 1,134 (67) | 663 (66) | 174 (63) | |
| GA | 508 (30) | 298 (30) | 90 (33) | |
| AA | 58 (3.4) | 37 (3.7) | 11 (4.0) | |
| rs1714014 | 4 | |||
| TT | 1,018 (60) | 604 (61) | 169 (62) | |
| TC | 580 (34) | 346 (35) | 96 (35) | |
| CC | 99 (5.8) | 46 (4.6) | 9 (3.3) | |
| rs4865180 | 22 | |||
| TT | 950 (57) | 571 (58) | 164 (61) | |
| TG | 604 (36) | 356 (36) | 91 (34) | |
| GG | 125 (7.4) | 64 (6.5) | 16 (5.9) | |
| rs9992658 | 0 | |||
| AA | 1,539 (90) | 901 (90) | 255 (93) | |
| AC | 157 (9.2) | 94 (9.4) | 19 (6.9) | |
| CC | 5 (0.3) | 3 (0.3) | 1 (0.4) | |
| rs10004910 | 21 | |||
| AA | 569 (34) | 317 (32) | 89 (33) | |
| AG | 791 (47) | 482 (49) | 138 (51) | |
| GG | 320 (19) | 183 (19) | 45 (17) | |
| Age at inclusion | 62 (52, 69) | 61 (52, 68) | 58 (48, 64) | |
| BMI ≥ 25 kg/m2 | 101 | 836 (52) | 480 (49) | 141 (51) |
| Screening detected (ages 45–74) | 303 | 968 (69) | 554 (66) | 125 (58) |
| Tumor size: pT2/3/4 | 0 | 441 (26) | 267 (27) | 106 (39) |
| Nodal status: pN1/2/3 | 2 | 579 (34) | 379 (38) | 134 (49) |
| Grade III | 6 | 470 (28) | 253 (25) | 73 (27) |
| ER positive | 2 | 1,504 (89) | 875 (88) | 225 (82) |
| PR positive | 2 | 1,214 (71) | 707 (71) | 170 (62) |
| HER2 positive | 66 | 175 (11) | 107 (11) | 41 (17) |
| TNBC | 8 | 129 (7.6) | 75 (7.6) | 25 (9.2) |
| Main histological type | 0 | |||
| Mainly ductal (NST) | 1,366 (80) | 806 (81) | 215 (78) | |
| Mainly lobular | 194 (11) | 115 (12) | 30 (11) | |
| Other or mixed | 141 (8.3) | 77 (7.7) | 30 (11) | |
| Chemotherapy | 0 | 488 (29) | 253 (25) | 79 (29) |
| Radiotherapy | 0 | 1,129 (66) | 636 (64) | 178 (65) |
| Trastuzumab | 0 | 124 (7.3) | 69 (6.9) | 21 (7.6) |
| Tamoxifen | 0 | 897 (53) | 563 (56) | 150 (55) |
| Aromatase inhibitors | 0 | 691 (41) | 363 (36) | 107 (39) |
Circulating IGFBP7 levels were weakly correlated with increasing age (Spearman’s rho = 0.16, P = .007, Supplementary Fig. S2A). Therefore, the linear regression models used to evaluate the relationship between circulating IGFBP7 and genotypes were adjusted for age. The genomic positions for the five selected proxy SNPs in LD with previously identified eQTL/pQTL (see Methods section) are presented in Fig. 1A. Only one (rs6852762) out of the 42 SNPs was associated with plasma IGFBP7 levels in the BC-blood cohort (P = .00684; Fig. 1B and Supplementary Table S2). Patients with the homozygous variant AA had higher IGFBP7 plasma levels than those with GG or AG, indicating a recessive effect (Fig. 1B).
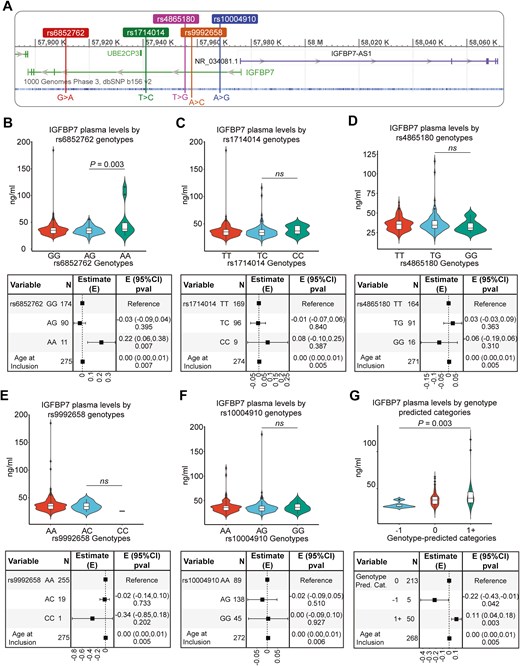
Genomic region of IGFBP7 and IGFBP7-AS1 (A) with Chromosome:base pair coordinates (GRCh37 assembly) of the five pQTL for IGFBP7 levels (rs6852762, rs1714014, rs4865180, rs9992658, and rs10004910) used to construct a genetic proxy of circulating IGFBP7 levels. (B–G) Violin plots with overlaying box plots illustrate the distribution of circulating IGFBP7 levels by each individual SNP (rs6852762 (B), rs1714014 (C), rs4865180 (D), rs9992658 (E), and rs10004910 (F)) and the genetic proxy (G) with corresponding forest plots of the age-adjusted linear regression models. In the box plots, the boundary of the box closest to zero indicates the 25th percentile, a black line within the box marks the median, and the boundary of the box farthest from zero indicates the 75th percentile. Points above the whiskers (Q3 + 1.5 * interquartile range (IQR)) and below the (Q1 − 1.5 * IQR) indicate outliers
In addition to rs6852762, by examining how IGFBP7 plasma levels were distributed among putative candidate SNPs, it was apparent that homozygosity for the variant alleles of three other SNPs (rs1714014, rs4865180, and rs9992658) conferred some variation in IGFBP7 plasma levels (Fig. 1C–E). One variant, rs10004910, did not confer differences in plasma IGFBP7 (Fig. 1F), but homozygosity for its variant allele was an independent predictor for higher tumor-specific IGFBP7 levels and was thus included in subsequent analyses (Supplementary Fig. S2B). A genetic proxy for homozygosity for the respective variant alleles was then constructed of these five SNPs (rs6852762 with the addition of rs1714014, rs4865180, rs9992658, and rs10004910). Indeed, the genotype variant ‘1+’ (proxy for higher IGFBP7 levels) was associated with higher IGFBP7, and the genotype variant ‘−1’ (proxy for lower IGFBP7 levels, rs9992658 and/or rs4865180) was associated with lower IGFBP7 compared to ‘0’, representing intermediate IGFBP7 levels (Fig. 1G). Two additional genetic proxies were constructed to include effect estimates of the homozygous minor allele (obtained from Pietzer et al. [20], which were all positive, or effect estimates from analysis of recessive alleles displayed in Fig. 1B–F). These models showed similar results to the proxy genotype (−1/0/1+) (data not shown). When fitting separate regression models, age (R² = 0.025) explained approximately 2.5% of the variance in IGFBP7 levels (Supplementary Fig. S2A), whereas the proxy genotype (R² = 0.04) explained about 4%, with a larger proportion of IGFBP7 variability explained by genotype than by age. Combining the genetic IGFBP7 proxy model with the age-adjusted model increased R² to 0.065 (Supplementary Fig. S2C) and both were independent predictors of circulating IGFBP7 levels (Fig. 1G). However, a large proportion of circulating IGFBP7 variability cannot be explained by age and genotype. The model was not improved by adding BMI.
Interestingly, higher IGFBP7 tumor levels were associated with higher IGFBP7 plasma levels (Fig. 2A and B). While there was no association between tumor-specific IGFBP7 and IGFIR levels (Fig. 2C and D), tumor-specific IGFBP7 levels were positively associated with InsR abundance both overall (P = .005) and in the membrane of cancer cells (P < .001) (Fig. 2E and F). For the candidate SNP only associated with tumor-specific IGFBP7 levels (rs10004910), patients with the homozygous variant GG presented higher IGFBP7 tumor levels (P = .017) (Fig. 2G and Supplementary Fig. S2B).
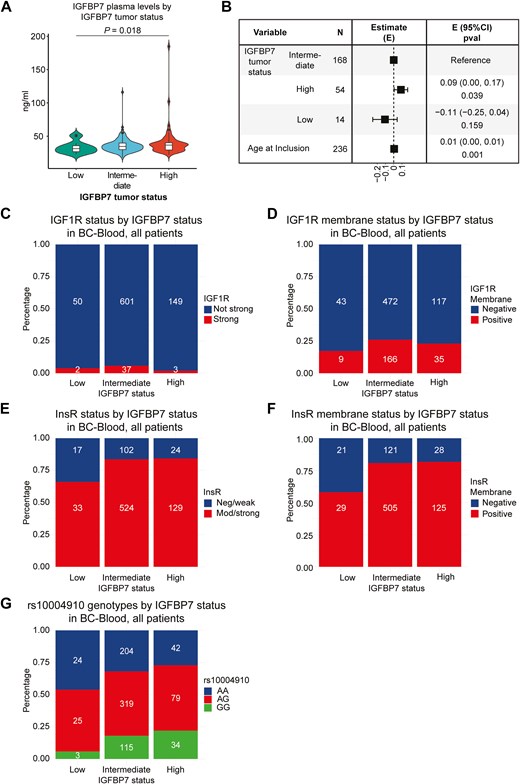
Violin plot (A) with overlaying box plot illustrates the distribution of circulating IGFBP7 levels by tumor-specific IGFBP7 levels and (B) corresponding forest plots of the age-adjusted linear regression model. In the box plot, the boundary of the box closest to zero indicates the 25th percentile, a black line within the box marks the median, and the boundary of the box farthest from zero indicates the 75th percentile. Points above the whiskers (Q3 + 1.5 * IQR) and below the (Q1 − 1.5 * IQR) indicate outliers. IGFIR status (C) in breast cancers by tumor-specific IGFBP7 levels. The y-axis indicates IGFIR status in tumors, and tumor-specific IGFBP7 levels are indicated on the x-axis. IGFIR membrane status (D) in breast cancers by tumor-specific IGFBP7 levels. The y-axis indicates IGFIR membrane status in tumors, and tumor-specific IGFBP7 levels are indicated on the x-axis. InsR status (E) in breast cancers by tumor-specific IGFBP7 levels. The y-axis indicates InsR status in tumors, and tumor-specific IGFBP7 levels are indicated on the x-axis. InsR membrane status (F) in breast cancers by tumor-specific IGFBP7 levels. The y-axis indicates InsR membrane status in tumors, and tumor-specific IGFBP7 levels are indicated on the x-axis. The rs10004910 genotype (G) by tumor-specific IGFBP7 levels. The y-axis indicates rs10004910 genotype, and tumor-specific IGFBP7 levels are indicated on the x-axis
Tumor, plasma, and genetically predicted IGFBP7 levels as prognostic factors
Patients were followed for up to 15 years. Of the patients with available plasma IGFBP7 levels (subcohort 3, n = 275), 124 had breast cancer events (87 had distant metastasis). Of the 89 patients who died during follow-up, 71 had a prior breast cancer event, all of whom developed distant metastasis. The patients still at risk had a median follow-up of 13.0 years (interquartile range 11.0–15.0). IGFBP7 plasma levels were not associated with the risk of any breast cancer event (Fig. 3A and B). The highest tertile of IGFBP7 was associated with a borderline increased incidence of distant metastasis (adjusted HR 1.60, 95% CI 0.93‒2.73, Fig. 3C and D), and an increased incidence of death from any cause (adjusted HR 1.78, 95% CI 1.03‒3.06, Fig. 3E and F) compared to the lowest tertile.
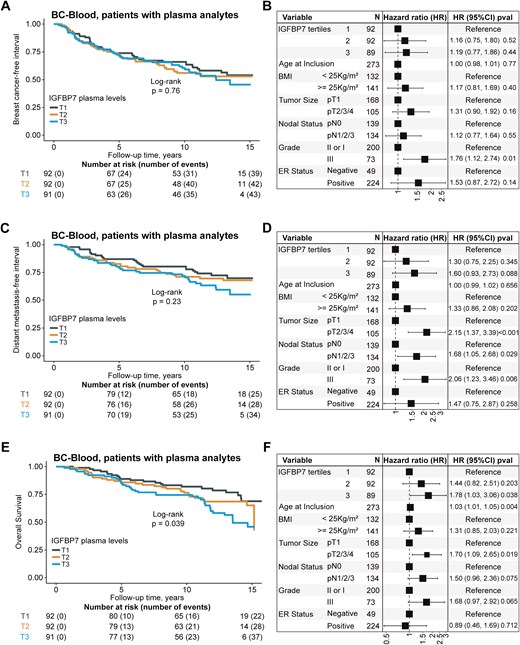
Kaplan–Meier estimates of (A) breast cancer-free interval with corresponding (B) forest plots of adjusted hazard ratios (HR) (95% confidence intervals (CI)), distant metastasis-free interval (C) with corresponding (D) forest plots of adjusted HR (95% CI), and overall survival (E) with corresponding (F) forest plots of adjusted HR (95% CI) in relation to tertiles of circulating IGFBP7 protein levels in patients with available plasma analytes (n = 275). The number of patients is indicated at each time-point. The study is ongoing; thus, the number of patients decreases with time
Among patients in subcohort 2 (n = 998), 191 patients had breast cancer events (118 had distant metastasis). Of the 184 patients who died during follow-up, 97 had a prior event. The median follow-up for patients still at risk was 9.0 years (interquartile range 7.0–11.0). There were multiplicative interactions between tumor-specific IGFBP7 levels and InsR membrane status on BCFI (Pinteraction = .013), DMFI (Pinteraction = .002), and OS (Pinteraction = .022) (Supplementary Tables S3–S5). Positive InsR membrane staining was associated with an increased incidence of a breast cancer event in IGFBP7 high tumors (adjusted HR 4.04, 95% CI 1.13‒14.43), a borderline increased incidence of distant metastasis (adjusted HR 4.72, 95% CI 0.93‒23.94), but not with the incidence of death from any cause (adjusted HR 2.02, 95% CI 0.71‒5.79) (Supplementary Figs S3–S5). These associations were not seen in patients with tumors classified as IGFBP7 intermediate or low. For patients overall in subcohort 2, InsR membrane status by itself was not associated with the risk of a breast cancer event, distant metastasis, or death.
For the patients with available genotype information (subcohort 1, n = 1701), 238 patients had a breast cancer event (149 had a distant metastasis). Of the 218 patients who died during follow-up, 113 had a prior breast cancer event. The median follow-up for patients still at risk was 5.1 years (interquartile range 3.1–9.1). Of the five candidate SNPs, only rs10004910 was associated with clinical outcomes. The homozygous variant GG was associated with an increased incidence of death (adjusted HR 1.52, 95% CI 1.05‒2.19), but not with a breast cancer event or distant metastasis compared to the wildtype AA (Supplementary Fig. S6). For the SNP rs9992658, homozygous variant CC carriers had an increased risk of any breast cancer event and distant metastasis, but the number of CC carriers was small (n = 5), and the finding may be due to chance (Supplementary Fig. S7). None of the other candidate SNPs was associated with prognosis (Supplementary Figs S8–S10). Furthermore, the proxy variant ‘1+’, representing high IGFBP7 plasma levels, while not associated with any breast cancer event (Fig. 4A and B), was associated with an increased incidence of distant metastasis (adjusted HR 1.55 95% CI 1.06‒2.28, Fig. 4C and D) and death (adjusted HR 1.72 95% CI 1.26‒2.34, Fig. 4E and F), in line with the findings for higher IGFBP7 plasma levels. There were also observed interactions between the rs10004910 SNP and tamoxifen (Pinteraction = .004), and aromatase inhibitor (AI) treatment (Pinteraction = .030) in patients with ER + tumors. In the group that was only treated with AIs, the homozygous variant GG was associated with an increased incidence of distant metastasis (adjusted HR 8.63, 95% CI 3.01‒24.72) compared to the wildtype AA (Fig. 5A and B). This was not seen in the other groups of patients with ER + tumors treated with tamoxifen only (Fig. 5C and D), a combination of tamoxifen or AI (Fig. 5E and F), or who had not received endocrine treatment (Fig. 5G and H). The effect estimates remained essentially the same after restricting the analyses to patients ≥ 50 years old.
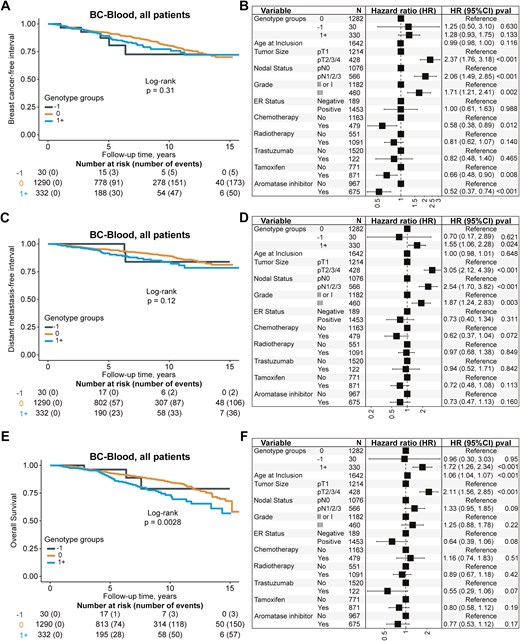
Kaplan–Meier estimates of (A) breast cancer-free interval with corresponding (B) forest plots of adjusted HR (95% CI), distant metastasis-free interval (C) with corresponding (D) forest plots of adjusted HR (95% CI), and overall survival (E) with corresponding (F) forest plots of adjusted HR (95% CI) in relation to the genetic proxy of circulating IGFBP7 levels in patients with available genotype information (n = 1701). The genotype variant ‘1+’ is a proxy for higher IGFBP7 levels, the genotype variant ‘0’ is a proxy for intermediate IGFBP7 levels, and the genotype variant ‘−1’ is a proxy for lower IGFBP7 levels. The number of patients is indicated at each time-point. The study is ongoing; thus, the number of patients decreases with time
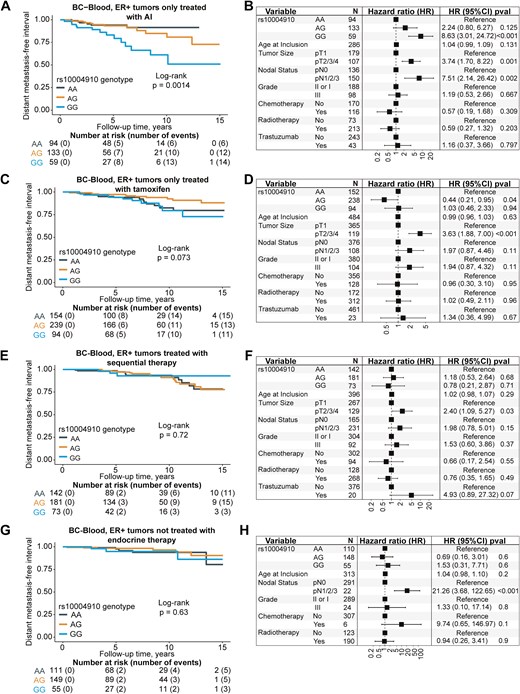
Kaplan–Meier estimates of distant metastasis-free interval with corresponding forest plots of adjusted HR (95% CI) in relation to rs10004910 genotype in patients with ER + tumors only treated with aromatase inhibitors (A, B), only treated with tamoxifen (C, D), treated with sequential therapy (E, F), and not treated with endocrine therapy (G, H). The number of patients is indicated at each time-point. The study is ongoing; thus, the number of patients decreases with time
IGFBP7 mRNA expression in single-cell dataset
At the single-cell level, IGFBP7 mRNA is highly expressed in cancer tissue compared to healthy tissue, regardless of the cell type (Supplementary Fig. S11). However, it remains unclear whether IGFBP7 contributes to carcinogenesis or if its upregulation is a consequence of the disease. In both healthy and cancerous tissue, IGFBP7 is predominantly expressed in the stromal compartment. Notably, IGFBP7 is scarcely expressed in healthy tissue but is found in a specific subset of breast cancer cells in cancerous tissue (Supplementary Fig. S11).
Discussion
We report that tumor-specific and circulating IGFBP7 levels, both quantitatively measured and genetically predicted, were independent predictive biomarkers of distant breast cancer metastasis and all-cause mortality. It has previously been reported that IGFBP7 levels are correlated with the risk of all-cause mortality, and this was suggested to be driven by cardiovascular disease [10,11]. Our findings suggest that the association of IGFBP7 levels with all-cause mortality, previously attributed to its association with cardiovascular disease, may also be driven in part by increased cancer mortality.
In cardiovascular disease, IGFBP7 can induce senescence and inflammation through the IGFIR/IRS/AKT signaling axis [9]. In the updated cancer hallmarks, cellular senescence is considered an enabling characteristic of cancer and senescence-associated secretory phenotype increase in abundance during aging [31,32]. Increasing evidence reveals that senescent cells can promote tumors through paracrine signaling that stimulates proliferation, apoptosis evasion, inflammation, angiogenesis, metastasis, and suppression of anti-tumoral immunity [33,34]. The senescent state is also a well-documented marker of therapy resistance [33,35]. We have previously shown that IGFBP7 gene expression is linked to therapeutic resistance, inflammation, and cancer-associated fibroblast activation in the TME, which is strongly associated with the senescent phenotype [3]. Our finding that tumor IGFBP7 levels are linked to circulating IGFBP7 levels suggests a common mechanism that can induce IGFBP7 in the tumor and host and/or act as a bidirectional link between the tumor and host.
This study adds corroborative evidence that high tumor-specific and circulating IGFBP7 levels are predictive of all-cause mortality and suggests that this association may, in part, be driven by breast cancer mortality [10,11]. Coupled with prior knowledge of IGFBP7 being a predictor of SGLT2 inhibitor efficacy and a biomarker for ganitumab benefit, this strengthens the case for more investigation into this understudied protein [3,4,13]. The possibility of common mechanisms underlying the associations of IGFBP7 levels with cardiovascular disease, type-2 diabetes, and breast cancer metastasis is intriguing, but progress in this area will require an improved understanding of IGFBP7 mechanisms.
We also provide evidence that high tumor-specific IGFBP7 protein levels combined with the presence of membrane InsR confers a particularly poor prognosis. While we have previously reported that both gene expression and protein levels of IGFBP7 confer poor prognosis, the mechanisms are unclear. Our observation is intriguing since prior work showed that IGFBP7 can bind the InsR and that IGFBP7 binding of IGFIR can sensitize IGFIR to insulin stimulation [7,8]. Interestingly, patients with newly diagnosed type-2 diabetes presented with elevated circulating IGFBP7 [36]. IGFBP7 was overexpressed in the islets and shown to increase insulin receptor activation while reducing insulin secretion by β-cells [36]. Cancer patients are markedly insulin resistant and particularly susceptible to new onset type-2 diabetes that predisposes them to recurrence [37]. Thus, our study suggests that the relationship between IGFBP7 and insulin signaling is a key topic to be further investigated, especially in light of the obesity epidemic, increase of type-2 diabetes, and insulin resistance in cancer patients [37].
IGFBP7 is consistently expressed in the vasculature across various organs and is believed to play a crucial role in angiogenesis [38]. Since angiogenesis and vascular remodeling are key mechanisms underlying the pathogenesis of both cardiovascular disease and cancer, studying IGFBP7 specifically within the (tumor) vasculature is of great interest [31,38]. The overexpression of IGFBP7 in perivascular-like populations of the single-cell data presented in this article provides evidence of angiogenic activation within the tumor. Interestingly, recent studies demonstrated that IGFBP7 is a natural ligand of CD93 during tumor neovascularization, contributing to leaky vasculature formation [39,40]. When expressed by malignant cells, IGFBP7 promoted epithelial cell growth, increased blood vessel permeability, and stimulated fibroblast activation, being a promising venue for the therapeutic blockade to improve therapeutic efficiency [39,40]. Since vascular dysfunction is a process central to both cardiovascular disease and cancer, this connection presents a compelling avenue for further research [3,38].
Genotyping of the IGFBP7 genomic region was done using a SNParray designed to investigate genetic variations in relation to cancer [24]. SNParrays only cover a small part of the genome, and the polymorphisms investigated are non-coding [24]. This could in part explain why so few cis-acting pQTL of circulating IGFBP7 were identified. Even though only a small part of the variation in IGFBP7 levels could be explained by age and genetic variants, the findings suggest that other lifestyle and/or pathophysiological factors are involved. With few determinants of IGFBP7 currently known, further research into this topic is both highly needed and relevant to increase the understanding of IGFBP7 biology. It should be noted that the sample size of this study is small for identifying variants impacting protein levels, which likely explains why previously reported cis-acting pQTL were not confirmed [18–21,41]. In-depth investigation of the genomic region of IGFBP7 by targeted sequencing (or whole-genome sequencing) in larger cohorts is needed to capture rare single-nucleotide variants, functional variants, or other types of genomic variation that could help explain the genetic regulation of IGFBP7. The method used to measure the plasma proteins is critical, as widely different pQTL are identified depending on the method [41]. This study used targeted ELISA (an immunoassay) in contrast to the generally used aptamer-based or wide-spectrum antibody-based assays and the differences between assays may also in part explain why known cis-acting pQTL were not replicated [18–21]. Moreover, while several genome-related studies (e.g. GWAS) utilize additive models to assess the contributions of variant alleles to the observed phenotype, we opted for the use of recessive models in our analyses, upon comparison of both methods. Recent studies and meta-analyses indicated that recessive models can help improve the identification of risk variants of pathophysiological consequences, compared to additive models [42,43]. In addition, the proxy genotype model (based on the five explored IGFBP7 SNPs) displayed in this article considers that variants have equal contributions to the outcome. While this simplification is not biologically accurate, the results obtained after considering the effect size of each recessive variant remained essentially the same as the simplified proxy model.
We also reported that an SNP (rs10004910) in the IGFBP7 genomic region was associated with increased all-cause mortality and distant metastasis risk depending on the type of endocrine treatment given to patients with ER + tumors. This finding could potentially provide a new pharmacogenetic marker for informing endocrine treatment selection but needs validation in an independent study [44]. Mechanistically, tamoxifen treatment modulates and transcriptionally downregulates the ER [45]. However, AIs only deplete estrogen production, allowing for functional forms of the ER to exist [45]. Gaben et al. demonstrated that ligand-free ER can carry cell-cycle progression in an AKT-dependent manner, obtainable via the stimulation of the IGFIR pathway, a known IGFBP7 target [46]. In 2019, Iida et al. reported that stimulation of IGFIR dramatically promoted cell growth under conditions of estrogen depletion, underscoring the metastatic potential of the IGFBP7/IGFIR pathway in AI-treated patients [45]. In addition, since AIs hamper the conversion of testosterone to estrogen, the differential processing of insulin by non-converted androgens could play a role in prognosis. The rs10004910 SNP was associated with higher tumor IGFBP7 levels, and we have previously reported that the prognostic impact of tumor-specific IGFBP7 levels depends on the type of endocrine therapy [1]. Thus, considering the possible interplay between tumor-specific IGFBP7 levels and AI resistance, the inclusion of IGFIR/PI3K/AKT-axis inhibitors to endocrine therapy could be considered as a way to mitigate the resistance mechanisms of hormone-dependent breast cancer cells [45–47]. No other studies have investigated the role of IGFBP7 in endocrine resistance, and it seems plausible that IGFBP7 could play a role in it given the extensive crosstalk between the ER and IGFIR signaling pathways [48].
This study has certain limitations. It is based on a population-based patient cohort considered representative of its catchment area (southern Sweden) with reliable clinicopathological and anthropometric data, but the generalizability to other populations is not established [49,50]. There might be an inherent selection effect due to the susceptibility of individuals with high circulating IGFBP7 to cardiovascular events and death, which may predate a cancer diagnosis. It would be of value to investigate the association between circulating IGFBP7 and breast cancer mortality in the general population. Notably, circulating IGFBP7 levels are, on average, higher in men than in women, raising the question of whether the association between elevated IGFBP7 levels and increased cancer mortality is consistent across both biological sexes [12]. A larger number of participants would allow for more precise estimates of associations. Moreover, the relationship between IGFBP7 genotype and circulating levels of this protein was investigated only in breast cancer patients, most of whom had hormone-receptor positive tumors, and the relationship may differ for breast cancer cohorts with different subtype contributions, healthy individuals, and in other disease contexts.
In conclusion, the impact of genetic variability on circulating IGFBP7 levels was small and the regulation of IGFBP7 merits further study. One SNP (rs10004910) in the IGFBP7 genomic region was identified as a potential pharmacogenetic marker for endocrine treatment. This study showed that circulating IGFBP7 and tumor-specific IGFBP7 levels were significantly positively correlated. Circulating IGFBP7 levels were biomarkers for both distant metastasis and all-cause mortality. The combination of tumor-specific high IGFBP7 protein abundance and membrane-bound InsR conferred a particularly poor prognosis, suggesting that this combination may yield more prognostic information than analyzing either marker alone. This interplay between InsR and IGFBP7 can be of clinical importance, since having both type-2 diabetes and breast cancer is common, and IGFBP7 also predicts SGLT2 inhibitor efficacy. Importantly, both measured and genetically predicted circulating IGFBP7 levels were independent prognostic biomarkers in breast cancer.
Acknowledgements
We would like to thank our research nurses. In addition, we would like to thank previous group members for data entry, Helga Tryggvadottir for database update, Björn Nodin and Elise Nilsson for TMA construction, Kristina Lövgren for staining, and Catarina Blennow for sectioning. We thank Helén Thell and Björn Nodin for helping with the DNA extraction and processing of the samples. The authors would like to acknowledge Clinical Genomics Lund, SciLifeLab, and Center for Translational Genomics (CTG), Lund University, for providing expertise and service with genotyping and analysis.
Author contributions
C.G.: Conceptualization, Data curation, Formal analysis, Methodology, Software, Resources, Visualization, Writing—original draft. A.H.R.: Conceptualization, Investigation, Data curation, Writing—review & editing. K.G.O.: Software, Visualization, Writing—review & editing. S.K.: Investigation, Writing—review & editing. S.B.: Investigation, Data curation, Writing—review & editing. K.J.: Investigation, Resources, Validation, Writing—review & editing. K.I.: Funding acquisition, Resources, Supervision, Writing—review & editing. M.N.P.: Conceptualization, Funding acquisition, Methodology, Supervision, Resources, Investigation, Writing—review & editing. H.J.: Conceptualization, Funding acquisition, Data curation, Formal analysis, Resources, Methodology, Investigation, Project administration, Supervision, Writing—original draft, Writing—review & editing. All authors have read and agreed to the published version of the manuscript.
Ethics approval and consent to participate
All participants signed written informed consent. The study was conducted in accordance with the ethical principles of the Declaration of Helsinki.
Conflict of interest
None declared.
Funding
This study was funded by the Swedish Cancer Society (CAN 20 0763 and CAN 23 2952), the Faculty of Medicine at Lund University, the Mrs Berta Kamprad Foundation, the South Swedish Health Care Region (Region Skåne ALF 40620), and the Skåne University Hospital fund. Dr Isaksson holds young researcher awards from ALF (Region Skåne). Dr Pollak acknowledges funding from the Terry Fox Foundation. The funders had no role in study design and conduct of the study, data collection and analysis, data interpretation, or manuscript preparation and decision to submit the manuscript for publication.
Data availability
Clinical data are not publicly available due to privacy laws. Questions regarding data can be directed to the corresponding author. All processed single-cell RNA-seq data from Wu et al. [33] and Gray et al. [34] are available for in-browser exploration and download through the Broad Institute Single Cell portal at https://singlecell.broadinstitute.org/single_cell/study/SCP1039 and https://singlecell.broadinstitute.org/single_cell/study/SCP1731.
