


 https://orcid.org/0000-0002-3339-5286

This scientific commentary refers to ‘Clinical markers of disease progression in the prodromal to overt alpha-synucleinopathy continuum’, by Roascio et al. (https://doi.org/10.1093/brain/awag193).
The emergence of disease-modifying therapies targeting α-synuclein (αSyn)—the protein that aggregates in Parkinson's disease and dementia with Lewy bodies—has shifted the central challenge in prodromal synucleinopathies from identifying individuals at risk to measuring how their disease progresses. Idiopathic/isolated REM sleep behaviour disorder (iRBD), a sleep disorder that constitutes the strongest clinically identifiable prodromal stage of synucleinopathy, has consequently become a key population for preventive clinical trials. Yet, despite its prognostic value, the field still lacks progression markers sufficiently sensitive to capture the marked heterogeneity in how the disease evolves. Phenoconversion, the point at which prodromal disease is first declared as overt parkinsonism or dementia, remains a clinically meaningful milestone. However, as a trial end point, it is inherently late and binary, and is blind to the continuous deterioration that precedes it. Conventional clinical scales are also noisy and reveal little about an individual's rate of progression. In this issue of Brain, Roascio and co-workers1 show that advanced disease-course modelling can extract biologically-validated individualized progression markers from longitudinal clinical data, offering a potential new generation of efficacy endpoints for disease-modifying trials.
Disease Course Mapping (DCM) provides a natural framework for addressing this challenge. Rather than describing progression as a sequence of discrete stages, it models disease as a continuous trajectory shared across a population while allowing each individual to deviate from that average in biologically interpretable ways. Originally developed as a general model of longitudinal data and subsequently applied to Alzheimer's disease,2 the approach combines statistical flexibility with clinical interpretability. Unlike purely predictive algorithms, DCM estimates parameters with intuitive biological meaning. The time-shift parameter (τ) reflects where an individual lies along the disease trajectory, the acceleration factor (α) captures the pace of progression, and the intermarker spacing (ω) describes the relative ordering of motor and cognitive decline. Together, these parameters shift the focus from asking where a patient sits within a disease stage to asking how far along, how fast and along which trajectory the disease is evolving.
Applied to a large longitudinal iRBD cohort, the model yielded clinically meaningful and biologically plausible measures of disease evolution. The analysis made use of routinely collected motor scores from part III of the Movement Disorder Society Unified Parkinson's Disease Rating Scale (MDS-UPDRS-III), a clinician-rated motor examination, and global cognition measured by the Montreal Cognitive Assessment (MoCA). Individuals who subsequently phenoconverted occupied a position on the disease trajectory ∼2 years earlier and progressed ∼30% faster than clinically stable participants, with the combined parameters discriminating converters from non-converters with an accuracy of approximately 73%.
Motor impairment advanced more rapidly than cognitive decline at the population level, resulting in a predominantly motor-first trajectory, while patients who later developed parkinsonism occupied an earlier disease position than those who ultimately converted to dementia. Earlier disease progression was associated with greater presynaptic dopaminergic dysfunction on dopamine-transporter imaging (DaT-SPECT), an established marker of nigrostriatal degeneration (loss of the substantia nigra-to-striatum dopamine projection central to Parkinson’s disease). Higher theta-band phase synchronization on high-density EEG—a measure of abnormal cortical network synchrony—tracked both earlier progression and a motor-first trajectory. This provides convergent biological support for the clinical dimensions estimated by the model (Fig. 1).
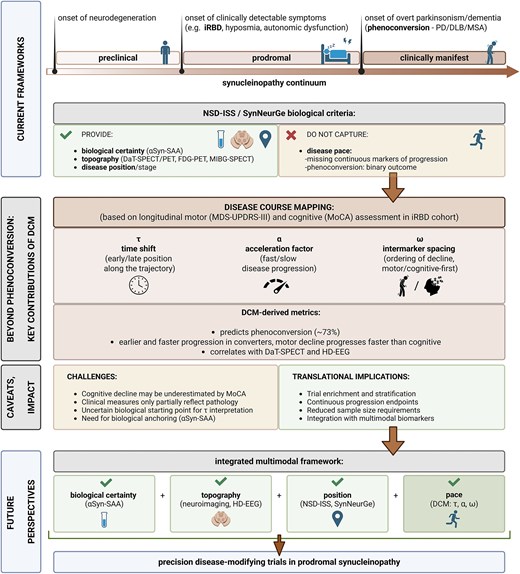
From position to pace: integrating disease-course mapping into the biological staging of prodromal synucleinopathy. Current biological frameworks such as NSD-ISS and SynNeurGe establish disease membership, topography, and position along the synucleinopathy continuum, but do not capture the pace of progression. Disease Course Mapping (DCM) complements these approaches by deriving individualized measures of disease position (τ, time shift), progression pace (α, acceleration factor), and the relative ordering of motor and cognitive decline (ω, intermarker spacing) from longitudinal clinical data. Integrating these dimensions with biological and imaging biomarkers may improve disease monitoring and enable more efficient, personalized disease-modifying trials in prodromal synucleinopathy. DaT-SPECT = dopamine transporter single-photon emission computed tomography; DLB = dementia with Lewy bodies; FDG-PET = fluorodeoxyglucose PET; HD-EEG = high-density electroencephalography; iRBD = isolated/idiopathic REM sleep behaviour disorder; MDS-UPDRS-III = Movement Disorder Society Unified Parkinson's Disease Rating Scale, Part III; MIBG-SPECT = metaiodobenzylguanidine single-photon emission computed tomography; MoCA = Montreal Cognitive Assessment; MSA = multiple system atrophy; NSD-ISS = Neuronal α-Synuclein Disease Integrated Staging System; PD = Parkinson’s disease; SynNeurGe = Synucleinopathy-Neurodegeneration-Genetics research diagnostic criteria; αSyn-SAA = alpha-synuclein seed amplification assay. Created in BioRender. Kulcsárová, K. (2026) https://BioRender.com/qkjcnjg.
Taken together, this is a conceptually important advance: a way to read progression, not merely risk, from data already in hand. The reported accuracy of ∼73% indicates that the parameters carry real prognostic signal but do not yet constitute a standalone predictor. The next challenge will be to further strengthen the biological meaning of these latent variables by refining both their clinical inputs and their biological anchoring.
The interpretation of the intermarker-spacing parameter (ω) inevitably depends on the sensitivity of the clinical measures defining each axis. Whereas MDS-UPDRS-III provides a relatively continuous measure of emerging motor dysfunction, MoCA is prone to ceiling and practice effects. These may flatten the cognitive trajectory and delay its apparent inflection. This may partly explain why a motor-first trajectory predominated even among individuals who later developed dementia. Rather than questioning ω itself, the observation points towards an opportunity. Replacing global cognitive screening with measures optimized for longitudinal sensitivity in iRBD, particularly executive function tasks such as the Trail Making Test part B, could substantially sharpen the biological resolution of the model.3
The motor axis warrants equal scrutiny. The convergent-validity argument treats it as a nigrostriatal readout, anchored by DaT-SPECT. However, in the prodromal stage, MDS-UPDRS-III score is only loosely and inconsistently coupled to nigrostriatal integrity. The nigral-motor correlation seen in overt Parkinson’s disease is largely absent in iRBD. Motor scores were increased only in the iRBD subgroup with severely abnormal DaT-SPECT.4 This likely reflects a threshold effect: cardinal motor signs emerge only after substantial dopaminergic loss—while much of the residual variance may reflect cortical and brainstem pathology.5 Notably, this is why recent biological staging frameworks [Neuronal alpha-Synuclein Disease-Integrated Staging System (NSD-ISS) and SynNeurGe],6 which define synucleinopathy by molecular and imaging biomarkers rather than by clinical signs, decouple their biological anchor (αSyn positivity plus DaT-defined dopaminergic/neurodegeneration status) from the clinical layer.
The biological interpretation of the ‘non-converter’ group also deserves careful consideration, because clinical non-conversion over a finite follow-up period does not necessarily imply biological stability. Without a molecular anchor, this group is likely to mix individuals genuinely on the synucleinopathy continuum—whether still early in their trajectory or progressing slowly—with patients whose RBD arises from non-synuclein mechanisms and who are not on that trajectory at all. Incorporating an αSyn seed amplification assay (αSyn-SAA), which detects pathological αSyn in CSF or skin, into future frameworks could separate disease membership from disease dynamics. This would allow τ and α to quantify progression within biologically homogeneous populations rather than operational categories. Its amplification kinetics also track disease progression and might, with further validation, serve as a biological correlate of α, anchoring the model's clinical markers to pathology.7
A subtler point concerns the meaning of τ. Disease-course mapping does not require a known biological onset. It reconstructs a latent disease timeline from the longitudinal data themselves and realigns each patient through the time-shift and acceleration terms, so heterogeneous entry points are handled by design. What such a timeline cannot supply is an external zero. The biological onset of synucleinopathy in iRBD is unknown, and a polysomnography-confirmed diagnosis does not mark a common temporal origin. Some patients are diagnosed shortly after the onset of dream-enactment behaviour, while others are diagnosed only after years of established symptoms. As a result, τ may capture not only true differences in disease timing but also differences in the stage at which individuals first enter observation. Anchoring the latent timeline to an external reference, such as estimated RBD symptom duration, broader prodromal burden, or biomarker-based staging, would help calibrate τ and better disentangle disease position from disease pace.
A notable strength of this work is its pragmatism. Rather than introducing a new biomarker, it extracts additional information from measures that are already widely available in iRBD cohorts. It transforms familiar clinical scales from static assessments into quantitative longitudinal biomarkers, a practical strategy while more sophisticated biological and digital biomarkers mature.
The efficiency case is concrete. For a 1:1 disease-modifying trial with a 2-year horizon, targeting a treatment that slows progression by half, the authors estimate roughly 75 participants per group for α and roughly 101 per group for τ. This is as economical as the most efficient published iRBD biomarker, an artificial intelligence-derived speech index (∼74 per group),8 and more efficient than the combined motor–cognitive milestone design (117 per group).9 It is also substantially smaller than the ∼150–366 participants per group estimated for phenoconversion-based designs in the landmark International RBD Study Group cohort.10 The structural reason is simple: continuous, individualized parameters draw progression signal from every participant and every visit, whereas binary phenoconversion draws it only from the minority who cross a clinical threshold.
Their utility may extend beyond outcome measurement. Because current prodromal cohorts mix individuals at widely different disease stages and progression rates, trials are diluted with participants unlikely to change measurably within the study window. By estimating disease position (τ) and progression velocity (α), DCM offers a complementary way to identify ‘fast progressors’ and enrich cohorts. The metrics may therefore serve a dual role as both outcome measures and tools for personalized trial design.
NSD-ISS and SynNeurGe reveal where a patient sits and whether the pathology is present, but a categorical snapshot cannot say how fast they are moving. The DCM's acceleration factor supplies this missing velocity term, making the two approaches complementary: staging for position and biological confirmation, and disease-course mapping for personalized pace. The logical end point is a multimodal model in which αSyn-SAA defines trajectory membership, neuroimaging localizes the degeneration, and continuous clinical or digital DCM parameters quantify its rate—integrating biology, topography, position, and pace.
By changing the question from whether an iRBD patient converts to when, how fast, and which way they progress, this work reframes prodromal synucleinopathy as a continuous, personalized trajectory rather than a binary event. Beyond confirming biological certainty, the ability to quantify disease topography, position, and pace—measured together and validated prospectively—is exactly what randomized disease-modifying trials have been missing.
Funding
J.N. and P.D. were supported by Ministry of Health of the Czech Republic (projects no. NW25-04-00079, NW26-04-00400 and MH CZ-DRO-VFN64165). K.K. was supported by the Slovak Research and Development Agency (grant no. APVV-22-0279) and the Scientific Grant Agency (grant no. VEGA 1/0826/25).
Competing interests
The authors report no competing interests.


