


Abstract
Structural grey and white matter changes precede the manifestation of clinical signs of Huntington’s disease by many years. Conversion to clinically manifest disease therefore likely reflects not merely atrophy but a more widespread breakdown of brain function. Here, we investigated the structure–function relationship close to and after clinical onset, in important regional brain hubs, particularly caudate nucleus and putamen, which are central to maintaining normal motor behaviour. In two independent cohorts of patients with premanifest Huntington’s disease close to onset and very early manifest Huntington’s disease (total n = 84; n = 88 matched controls), we used structural and resting state functional MRI.
We show that measures of functional activity and local synchronicity within cortical and subcortical regions remain normal in the premanifest Huntington’s disease phase despite clear evidence of brain atrophy. In manifest Huntington’s disease, homeostasis of synchronicity was disrupted in subcortical hub regions such as caudate nucleus and putamen, but also in cortical hub regions, for instance the parietal lobe. Cross-modal spatial correlations of functional MRI data with receptor/neurotransmitter distribution maps showed that Huntington’s disease-specific alterations co-localize with dopamine receptors D1 and D2, as well as dopamine and serotonin transporters. Caudate nucleus synchronicity significantly improved models predicting the severity of the motor phenotype or predicting the classification into premanifest Huntington’s disease or motor manifest Huntington’s disease.
Our data suggest that the functional integrity of the dopamine receptor-rich caudate nucleus is key to maintaining network function. The loss of caudate nucleus functional integrity affects network function to a degree that causes a clinical phenotype. These insights into what happens in Huntington’s disease could serve as a model for what might be a more general relationship between brain structure and function in neurodegenerative diseases in which other brain regions are vulnerable.
Introduction
In Huntington’s disease, a movement disorder with cognitive decline and behavioural abnormalities, the most vulnerable regions to the pathological events caused by the HTT CAG repeat expansion mutation include the striatum, i.e. the caudate nucleus and putamen. Striatal atrophy can be observed a long time before clinical manifestations of Huntington’s disease without causing an overt clinical phenotype.1-3 Clinical manifestations of Huntington’s disease therefore likely reflect the breakdown of network brain function, so normal behaviour can no longer be maintained. Task-based functional MRI has demonstrated abnormal activation in premanifest Huntington’s disease (e.g. Klöppel et al.4 and Wolf et al.5). In addition, resting state functional MRI (rs-fMRI), i.e. fMRI in the absence of a task, has revealed many changes of functional connectivity ‘between’ regions in various networks (for reviews see Gregory and Scahill6 and Pini et al.7). In sensorimotor networks, functional connectivity at rest is reduced before, and increased after, motor signs of disease emerge.8-11 The ongoing degenerative process eventually disrupts the ability of a given network to assume the different functional states needed to maintain, for instance, normal motor performance, so that the first subtle motor signs of Huntington’s disease emerge.12 Hyperconnectivity in motor-manifest Huntington’s disease may then reflect a compensatory effort to maximize network activity of the remaining neuronal populations within the connected regions. This may come at the expense of flexibility of these connections when complex motor tasks require dynamic network activity. For example, the sensorimotor network needs to assume different activity states necessary to initiate, maintain or terminate a movement. This could explain the association of increased functional connectivity at rest with poorer motor performance.10,11
The degenerative process in Huntington’s diseases particularly affects connectivity between key, or hub, regions for network function such as the caudate nucleus, thalamus and prefrontal regions.13,14 It remains less well understood how these important regions themselves function in Huntington’s disease and how their local function relates to their endowment with specific neurotransmitter systems. Conceivably, overall network function depends on intact white matter connections between the above regions and functional integrity of the regions themselves.15 As long as overall network function is maintained carriers of the Huntington’s disease-causing HTT mutation remain in the premanifest phase. In contrast, in the very early clinically manifest stages of Huntington’s disease, the disease process will have affected the connections between regions, function within important hub regions, such as caudate nucleus and putamen, or a mixture of both, ultimately resulting in network dysfunction and the emergence of clinical signs of Huntington’s disease. Caudate nucleus and putamen (striatum) play an important role in movement, cognition and emotion regulation as a hub region within the dopaminergic system16,17; the striatum contains dopamine receptors and transporters that are consequently lost in Huntington’s disease.18-20 Pharmacological interventions targeting the dopaminergic system such as dopamine receptor antagonists or inhibitors of presynaptic vesicular uptake of dopamine can influence the motor phenotype in Huntington’s disease.21 Medication, such as l-dopa or dopamine antagonists, modulates functional connectivity of striatal regions.22 Therefore, striatal function and its role in causing abnormal movements in Huntington’s disease may be closely linked to the dopamine neurotransmitter and transporter system.
Here, we investigated regional brain functional and structural alterations in Huntington’s disease and their relationship to neurotransmitter systems with high expression in important regional brain hubs in Huntington’s disease, in particular caudate nucleus and putamen, both of which are central to maintain normal motor behaviour. We hypothesized that in premanifest Huntington’s disease, function in regional hubs, in particular caudate nucleus and putamen, remains normal despite substantial atrophy. In contrast, in early manifest Huntington’s disease, we expected to see changes in local brain function in association with the presence of clinical symptoms, in particular in the motor domain. Given the clinical evidence of improvements of the degree of motor dysfunction with medication that targets the dopamine transmitter system we further expected to observe local brain dysfunction, in particular in those regions that express dopamine receptors.
Materials and methods
Participants
We included two cohorts (the first cohort was recruited at Ulm university, the second at Aachen university) of mainly right-handed participants (five left-handers) with a molecular genetic diagnosis of a CAG repeat expansion (≥39) in the Huntingtin gene. For each cohort separately, we recruited a healthy volunteer group (controls) matched for age and sex with the respective Huntington’s disease group (Table 1). Premanifest Huntington’s disease participants had a diagnostic confidence level score of ≤2 on the motor part of the Unified Huntington’s Disease Rating Scale (UHDRS23); manifest Huntington’s disease had a diagnostic confidence level score of 4, reflecting the presence of unequivocal motor signs of Huntington’s disease. The first cohort (32 manifest, 23 premanifest, 49 controls) served to generate data for all initial exploratory analyses with the key hypotheses and findings pre-registered at https://osf.io/q2nyr. Data from the second cohort (29 manifest and 39 controls) were used for subsequent independent replication of any effects observed in the first cohort according to the pre-registered analysis plan (https://osf.io/q2nyr).
Demographic, clinical and HTT CAG repeat characteristics of all groups
| – | Cohort 1 | Cohort 2 | ||||
|---|---|---|---|---|---|---|
| ManHD | HC | PreHD | HC | ManHD | HC | |
| n | 32 | 30 | 23 | 19 | 29 | 39 |
| Age, years | 47.9 (8.6) | 46.6 (9.6) | 40.6 (8.6) | 44.2 (9) | 52.2 (9.9) | 50.3 (13.6) |
| Sex (M/F) | 22/10 | 18/12 | 9/14 | 10/9 | 17/12 | 18/21 |
| UHDRS TMS | 20.1 (12.6) * | 0.6 (0.9) | 3.9 (3.2) * | 1 (1.2) | 34.1 (18) | – |
| UHDRS TFC | 11.5 (1.6) * | 13 (0) | 13 (0) | 13 (0) | 8.6 (3.2) | – |
| UHDRS FA | 22.9 (2.4) * | 25 (0) | 25 (0) | 25 (0) | 19.8 (5.4) | – |
| CAG repeats | 43.3 (1.9) | – | 41.8 (1.8) | – | 43.7 (3.7) | – |
| Disease burden | 364 (65.5) | – | 252.4 (73.4) | – | 394.5 (89.7) | – |
| Handedness (L/both/R) | 0/0/32 | 0/0/30 | 0/0/23 | 0/0/19 | 4/0/25 | 1/1/37 |
The first cohort comprised patients with manifest Huntington’s disease (ManHD), their age-matched healthy controls (HC), and pre-manifest Huntington’s disease (preHD) and their age-matched controls; the second cohort consisted of patients with manifest Huntington’s disease and their healthy control group. If available, the mean and standard deviation of the UHDRS subscores, total motor score (TMS), function assessment (FA) and total functional capacity (TFC), the HTT CAG repeats and the disease burden score are given. Significant differences regarding age, sex and clinical scores between premanifest Huntington’s disease or manifest Huntington’s disease and the respective control group are highlighted with asterisks (*P < 0.001). Statistical key figures are listed in Supplementary Table 1. F = female; L = left; M = male; R = right.
Statistical key data of significant co-localizations between functional alteration and neurotransmitter systems
| Cohort | Co-localization | Before atrophy correction | After atrophy correction | |||||
|---|---|---|---|---|---|---|---|---|
| Fisher’s z (r) | Cohen’s d | P-value | Fisher’s z (r) | Cohen’s d | P-value | |||
| 1 | LCOR | D1 | −0.21 | −1.03 | <0.01 | −0.17 | −0.88 | <0.01 |
| D2 | −0.17 | −0.8 | <0.01 | −0.16 | −0.76 | <0.01 | ||
| DAT | −0.18 | −1.09 | <0.01 | −0.15 | −0.92 | <0.01 | ||
| SERT | −0.17 | −1.01 | <0.01 | −0.15 | −0.91 | <0.01 | ||
| 2 | LCOR | D1 | −0.17 | −0.89 | <0.01d | −0.14 | −0.7 | <0.01d |
| D2 | −0.13 | −0.66 | <0.01d | −0.11 | −0.52 | 0.01d | ||
| DAT | −0.17 | −0.74 | <0.01d | −0.15 | −0.63 | <0.01d | ||
| SERT | −0.19 | −0.84 | <0.01d | −0.15 | −0.66 | <0.01d | ||
| 2 | fALFF | 5-HT1b | −0.25 | −1.03 | <0.01 | −0.16 | −0.7 | <0.01 |
| µ | −0.17 | −0.84 | <0.01 | n.s. | n.s. | n.s. | ||
Listed key data are: mean Fisher’s z-transformed correlation coefficient across all subjects, effect size Cohen’s d and P-value. P-values of directed hypothesis testing are labelled with subscript d. DAT = dopamine transporter; n.s. = not significant; SERT = serotonin transporter; µ = µ-opioid receptor.
All participants underwent a thorough neuropsychiatric examination. Participants were clinically characterized using the UHDRS motor scale to derive a total motor score. The UHDRS functional assessment (FA) scale and total functional capacity scale (TFC) were used to measure functional impairment.23
Participants with a history of another neurological disorder, a history of head trauma or learning disabilities were excluded from the study. The burden of Huntington’s disease pathology was calculated using a formula based on age and CAG repeat length (CAGn-35.5 × age).24 Participants with a neurological or a psychiatric disorder (other than Huntington’s disease) according to the Diagnostic and Statistical Manual of Mental Disorders, Fourth Edition (DSM-IV-TR) criteria, substance abuse or dependence were excluded. Participants’ consent was obtained according to the Declaration of Helsinki, and the study was approved by the local ethics committees (Ulm University and Aachen University, Germany). Participants gave written informed consent following a complete description of the study’s aims and procedures.
MRI data
For structural imaging, in the first cohort 3D magnetization-prepared rapid gradient-echo (MPRAGE) data were acquired using a 3 T Magnetom ALLEGRA (Siemens) head MRI system [echo time (TE) = 3.67 ms; repetition time (TR) = 2200 ms; inversion time (TI) = 1200 ms; slice plane = axial; slice thickness = 1.1 mm]. In the second cohort, a 3 T PRISMA (Siemens) head MRI system was used (TE = 2.98 ms; TR = 2300 ms; TI = 900 ms; slice plane = axial; slice thickness = 1 mm).
T2*-weighted (resting-state) images were obtained using echo-planar imaging in an axial orientation (Cohort 1: TR = 2000ms, TE = 30 ms, flip angle 80°, 33 slices, slice thickness 3 mm; Cohort 2: TR = 2210 ms, TE = 30 ms, flip angle 90°, 30 slices, slice thickness 3.1 mm). Participants were explicitly instructed to relax without falling asleep, to keep their eyes closed, not to think about anything special and move as little as possible. None of the patients reported that they had fallen asleep during the rs-fMRI scan.
Preprocessing of imaging data
All resting state fMRI and structural imaging data were preprocessed using Statistical Parametric Mapping software SPM1225 and the CONN toolbox26 implemented in MATLAB (v2020b). Functional images were corrected for head motion and distortions (realign and unwarp) followed by co-registration of functional data to structural images. Functional images were normalized into Montreal Neurological Institute (MNI) space using structural information, resampled to a resolution of 3 mm3 isotropic and spatially smoothed with a 6 mm full width at half maximum (FWHM) Gaussian kernel. The first four frames of the functional images were discarded in order to obtain magnetic equilibrium. Mean white matter and CSF signals as well as 24 parameters of motion27 were regressed out using the CONN toolbox. Motion parameters were used to identify data to be excluded due to excessive head movement (frame-wise displacement > 3 mm and rotation > 2°).
Resting-state functional MRI
To investigate regional neuronal activity at rest we computed the voxel-wise fractional amplitude of low-frequency fluctuations (fALFF). fALFF expresses the contribution of low-frequency fluctuations within a specific frequency band relative to the whole detectable frequency range.28 Mathematically, fALFF is the square root of the ratio of summed, squared bandpass filtered (0.008–0.09 Hz) blood oxygenation level–dependent (BOLD) signal to summed, squared, full spectrum BOLD signal over the whole resting-state time course.28 In addition, as another measure of local activity, we also examined local synchronization as measured by local correlation (LCOR). LCOR is defined as the summed correlation coefficients of BOLD signal in the voxel of interest with other voxels in its proximity, with distances weighted by a Gaussian kernel (25 mm FWHM).29
Voxel-wise group comparisons
For each pair-wise comparison, we first regressed out voxel-wise effects of age and sex from the fALFF and LCOR maps using voxel-wise regression coefficients calculated from all study data. Because manifest Huntington’s disease participants were older than premanifest participants, differences in fALFF and LCOR patterns could result from a mixture of age- and disease-related effects. Therefore, to account for age-related effects, we used voxel-wise regression coefficients calculated from the control data only.30 This step-wise procedure ensured comparability with the spatial correlation analyses, which uses this step-wise procedure to account for the effects of confounds. To adjust for the potential impact of local atrophy on fALFF and LCOR alterations, we repeated all analyses after additionally regressing out the voxel-wise grey matter volumes (spatially smoothed with a 6 mm FWHM Gaussian kernel) from all data for each pair-wise comparison.31
Voxel-wise analyses of variance for group comparisons were conducted in SPM12. For all comparisons, a voxel-wise threshold of P < 0.001 was applied combined with an exact permutation-based (1000 permutations) cluster defining threshold (P < 0.05).32 In addition, to test whether regressing out age removed additional variance associated with Huntington’s disease we repeated the voxel-wise group comparisons of Huntington’s disease and healthy controls without controlling for age.
Spatial correlations between rs-fMRI data and neurotransmitter receptor distributions
We examined whether Huntington’s disease related alterations in fALFF and LCOR were spatially linked to the presence of specific neurotransmitter systems. To this end, we first calculated individual alterations in fALFF and LCOR in each region (the mean of all voxels making up that region) using the Neuromorphometrics atlas (119 regions as provided by SPM12 after excluding white matter and CSF) in each control or Huntington’s disease participant. For each participant, we calculated regional z-scores of fALFF or LCOR relative to the mean of the respective control group [(value of Huntington’s disease participant) – (mean of controls)/(standard deviation of controls)] in each region so that the z-score reflects how much each Huntington’s disease participant differs from normal. Next, for each Huntington’s disease participant we computed a Spearman correlation between these 119 z-scores and the distribution of specific receptor/neurotransmitter maps as derived using positron emission and single photon emission computer tomography in independent healthy cohorts. Maps were available for serotonergic (5-HT1a, 5-HT1b, 5-HT2a), dopaminergic (D1, D2), dopamine uptake transporter (DAT) and serotonin transporters (SERT), as well as for dopamine synthesis capacity measured using fluorodopa PET (FDOPA) integrated into the JuSpace toolbox.33 To approximate a normal distribution, the correlation coefficients were Fisher’s z-transformed. An exact orthogonal permutation-based (n = 10 000) P-value was computed to test whether the Fisher’s z-transformed correlation coefficients were significantly different from a null distribution.34 A detailed description of the workflow within the JuSpace toolbox is provided by Dukart et al.33 After identifying which neurotransmitter systems were associated with functional alterations, we computed ANOVAs to test for the effects of drugs on the respective correlation coefficients. For each participant, we included binary fixed factors indicating whether the drugs taken were known to have a main mechanism of action on the respective neurotransmitter systems. To investigate the effect of atlas choice on our findings, we repeated the spatial correlation analyses using the Schaefer cortical parcellation atlas with 100 regions (17 networks)35 in combination with the subcortical and cerebellar regions (21 regions) from the Neuromorphometrics atlas.
Relationship of structural and functional imaging data with clinical phenotypes
Next, we tested whether the significant co-localizations of fALFF or LCOR with a receptor/transporter identified above related to clinical phenotypes. For this purpose, we computed Spearman correlations of three UHDRS subscores (total motor score, functional assessment, and total functional capacity) with the Fisher z-transformed correlation coefficients that provided a measure of co-localization of fALFF and LCOR alterations with respective neurotransmitter systems. To compare the results in both manifest Huntington’s disease groups, we assessed statistical differences regarding the UHDRS subscore, CAG repeats and disease burden. All analyses were corrected for multiple comparisons using the Benjamini–Hochberg procedure.
We then used linear regression analysis (forward selection; probability of F for entry: P ≤ 0.05) to predict total motor scores in all Huntington’s disease participants, premanifest and clinically manifest, with caudate and putamen volumes (mean of left and right, corrected for total intracranial volume), caudate and putamen LCOR, sex, anti-dopaminergic or serotonergic medication (as dichotomous variable) and disease burden as independent variables. In a step-wise linear regression, independent variables are included one at a time in successive order of incremental predictive value (i.e. the predictor explaining most of the variance is entered first). Next, we predicted the clinical classification of premanifest or clinically manifest Huntington’s disease. We used the classification by the clinicians; as this is often a judgement call rather than based on data, we also used a classification based on a total motor score of 10 (an arbitrary cut-off) or 14, which based on large data sets distinguished with very high confidence healthy individuals from Huntington’s disease patients with motor manifestations.36 For this, we computed binary logistic regression analyses with the same variables as for the above linear regression analysis. We did not include medication because only two premanifest Huntington’s disease participants were on medication.
Data availability
The data underlying this article will be shared on reasonable request to the corresponding author.
Results
Participants
Patients with manifest Huntington’s disease in the first cohort were in the early stages of disease according to their UHDRS total functional capacity score (mean 11.5 SD ± 1.6, so mainly stage 1). In the first cohort, more manifest Huntington’s disease participants were male (χ2 = 4.77; P = 0.03) and they were older [t(53) = 3.13; P = 0.003] than premanifest Huntington’s disease. Participants with manifest Huntington’s disease in the second cohort had significantly higher UHDRS total motor scores [t(57) = −3.49; P < 0.001] and significantly lower functional assessment [t(55) = 2.89; P = 0.006] and total functional capacity scores [t(56) = 4.44; P < 0.001] than the first cohort, whereas CAG repeats, age, sex and disease burden were similar. Manifest patients in the second cohort were still in the early UHDRS total functional capacity stages of Huntington’s disease (mean 8.6, SD ± 3.2, so mainly stage 2). In the first cohort, 12 patients with manifest Huntington’s disease took either dopamine receptor antagonists (tiapride n = 5; quetiapine n = 2; sulpiride, aripiprazole, risperidone each n = 1) or tetrabenazine (n = 2) and 8 patients were on one or more antidepressants (mirtazapine n = 5; citalopram n = 2; venlafaxine n = 1; sertraline n = 3; duloxetine n = 1; agomelatine n = 3). Fifteen patients were on no medication. In the second cohort, 18 patients were on one or more dopamine receptor antagonists (tiapride n = 9; quetiapine n = 4; olanzapine, aripiprazole, risperidone each n = 1) or tetrabenazine (n = 4) and 19 patients took one or more antidepressants (mirtazapine n = 9; citalopram n = 1; venlafaxine n = 3; sertraline n = 3; duloxetine n = 2; fluoxetine n = 1; amitriptyline n = 1). Three patients were on no medication. All participants were on stable medication for at least 6 months before the study.
Demographic and clinical details for both cohorts as well as respective group comparisons are provided in Table 1. Key statistical data from the group comparisons are provided in Supplementary Table 1.
Reduced fALFF and increased local synchronization in important hub regions in manifest Huntington’s disease
Using voxel-wise analyses, we first explored whether manifest and premanifest Huntington’s disease participants differed from controls in the spontaneous resting-state activity (fALFF) or their local synchronization (LCOR). Premanifest participants were similar to their age- and sex-matched controls in voxel-wise fALFF and LCOR. In contrast, fALFF was reduced in early manifest Huntington’s disease in the first cohort relative to controls across many cortical areas, basal ganglia, the limbic system and the cerebellum (Fig. 1A). This included the important hub regions bilateral putamen, caudate nucleus, hippocampus, right inferior and superior parietal cortex and left superior frontal regions. In the more progressed early manifest second cohort further hub regions in addition to those in Cohort 1 showed reduced fALFF such as bilateral thalamus, precuneus and insula (Fig. 1C). Manifest Huntington’s disease participants also had less fALFF than premanifest participants in bilateral inferior and left superior parietal lobe (Supplementary Fig. 1). The reduced local activity in these regions was accompanied by increased local synchronization (higher LCOR) in early manifest Huntington’s disease participants in the cortex (including limbic regions), the thalamus and the cerebellum (Fig. 1A). This pattern was qualitatively similar yet anatomically much more widespread in the clinically more advanced second Huntington’s disease cohort (Fig. 1C). Statistical key figures for clusters with significant group differences are provided in Supplementary Table 2. The results were largely similar but less pronounced when not controlling for the effects of age (Supplementary Fig. 2).
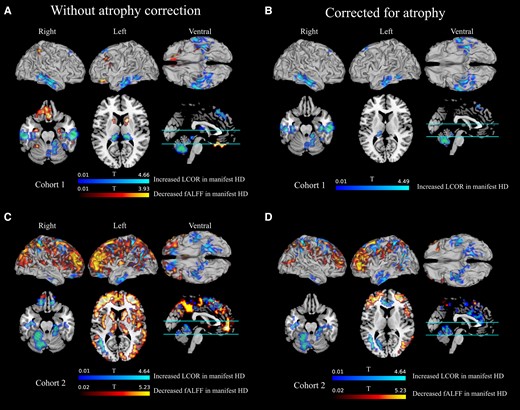
Voxel-wise fALFF and LCOR contrasts of patients with Huntington’s disease relative to their respective healthy controls. In a number of clusters where fALFF was significantly reduced in manifest Huntington’s disease of the first (A and B) or second (C and D) cohort, and LCOR significantly higher in manifest Huntington’s disease. Left panels: the atrophy-uncorrected contrasts; right panels: the atrophy-corrected contrasts. Anatomical regions covered by clusters and the MNI coordinates of the voxel with the peak t-value are listed in Supplementary Tables 2 and 3.
Functional brain alterations may be caused by the underlying atrophy of caudate nucleus [right: t(97) = 6.16, P < 0.001; left: t(97) = 4.97, P = 0.073] and putamen [right: t(97) = 5.2, P = 0.003; left: t(97) = 5.07, P = 0.049] already present in the premanifest Huntington’s disease group. To investigate the extent to which atrophy contributed to Huntington’s disease functional alterations, we regressed out voxel-wise grey matter volumes from all data. In general, this resulted in reduced cluster sizes in the t-contrasts (for statistics, see Supplementary Table 3). No cluster of cortical and subcortical fALFF reductions survived atrophy correction in the first cohort. In the second cohort, the striatal and thalamic fALFF reduction did not survive atrophy correction, whereas clusters comprising frontal, parietal, temporal, occipital and (para-)cingulate areas (cf. Fig. 1D, red) did suggest that in more progressed early manifest Huntington’s disease the functional consequences are more pronounced than would be explained by atrophy. Local synchronicity remained significantly increased after atrophy correction in clusters covering frontal, temporal including limbic and cerebellar areas in both cohorts (cf. Fig. 1B and D, blue) including the important subcortical and cortical hub regions bilateral superior parietal cortex (only Cohort 2), hippocampus and superior frontal cortex, left thalamus (only Cohort 1), bilateral precuneus (only Cohort 2) and the cerebellum.
Huntington’s disease fMRI alterations relate to dopamine and serotonin system distribution
Next, we examined whether the functional alterations observed in Huntington’s disease co-localized with the expression of neurotransmitter systems. To this end, we expressed each Huntington’s disease patient’s fALFF, or LCOR, as a difference to the mean of controls, normalized by the standard deviation (z-score), and correlated this with the spatial distribution of specific neurotransmitter systems derived from independent cohorts of healthy individuals (Table 2; all statistics are listed in Supplementary Table 4). In premanifest Huntington’s disease, no co-localization was found between fALFF or LCOR alteration and the total expression in the brain of any of the evaluated neurotransmitter receptors or transporters. In the manifest Huntington’s disease group of the first cohort, there was no significant co-localization with any of the neurotransmitter receptors or transports in regions with altered fALFF, suggesting that the degree of functional change was not related to any of them (Fig. 2A). In addition, a significant association was observed in the second more advanced early manifest Huntington’s disease cohort between fALFF alterations and the distribution of the serotonergic 5-HT-1B receptor and opioid µ receptor (Fig. 2B). Co-localizations with 5-HT-1B remained significant after correction for atrophy (Supplementary Fig. 3B).
![Co-localizations of Huntington’s disease brain activity and synchronicity alteration (z-score) with receptor/transporter distribution. The figure plots the correlation (Fisher’s z-transformed correlation coefficients) with neurotransmitter maps of the difference of each Huntington’s disease patient’s fALFF (A, Cohort 1; B, Cohort 2) or LCOR (C, Cohort 1; D, Cohort 2) to the mean of controls (z-score). The more the distributions of the correlation coefficients differ from zero, the stronger the correlation of brain activity/synchronicity alteration with the total neurotransmitter signal in the respective cohort of patients with Huntington’s disease. The distribution of Fisher’s z-transformed correlation coefficients was significantly different from null (*P < 0.05) in Cohort 2 for fALFF for 5HT1b (P < 0.001) and the µ-opioid receptor (MU, P = 0.003) and LCOR in both cohorts for the serotonin transporter (SERT, P = 0.001, Cohort 1; P < 0.001, Cohort 2); D1 (P < 0.001; both cohorts), D2 (P = 0.003, Cohort 1; P = 0.006, Cohort 2) and dopamine uptake transporter (DAT, P < 0.001, Cohort 1; P = 0.003, Cohort 2). Because coefficients were negative this indicates a loss of function (fALFF or LCOR) that was spatially correlated to whole-brain expression of the respective neurotransmitter system. Horizontal lines within box plots represent medians, whiskers limit the 1.5-fold of the interquartile range and crosses highlight outliers. Red corresponds to the serotonin system (5HT1a, 5HT1b, 5HT2a, SERT), blue to the dopamine system [D1, D2, fluoro-dopa (FDOPA), DAT], brown to GABAa receptors, beige to the opioid system and green to the noradrenaline transporter (NAT). E–J show the link between strength of co-localization of LCOR alteration and D1 (E–G) or SERT (H–J) expression and motor symptom severity, or functional impairment, derived from the subscores of the Unified Huntington’s Disease Rating Scale total motor score (E and H), functional assessment score (F and I) and total functional capacity score (G and J). Brighter and darker blue (D1) or red (SERT) dots correspond to the Fisher z-transformed correlation coefficients and rating scale scores in manifest Huntington’s disease of the first or the second cohort. P-values are false discovery rate-corrected and ρ the corresponding Spearman correlation coefficients. Lines and coloured backgrounds represent linear fits and the first confidence interval. n.s. = not significant; 1st = Cohort 1; 2nd = Cohort 2.](https://oup.silverchair-cdn.com/oup/backfile/Content_public/Journal/brain/146/8/10.1093_brain_awad043/1/m_awad043f2.jpeg?Expires=1750256895&Signature=ohdllthRyU~GwOGFZu3W~DFFMxwrfgReR8jSbYzPZLWlhQUrhcEuD-kDdzcY~WwnFGlh31VU48lGVjkrQJguwWE92ADKzRrw09YmzwreYWWxpP268xEbByLHsOs5q9FAY9kwjA~zR6o9E9RcpjB4vXgmlfCLMiz4uPdRMBPp~szYXVy6ZXQCnc13OhGNk1CDECSvrr9c3nOlupqCsiVpoCiOS5l3S3zkgtTj9BvBxqozv2gjiBc1TJFemctzxJbgiBqHcwuyliIJ~iSDXu3diOjHnOlek1TxZuDZzRrO2bLDggfjn3DSBHHAKxW1ZDQJjzpsBXzJd9~8g8kqzTb-sg__&Key-Pair-Id=APKAIE5G5CRDK6RD3PGA)
Co-localizations of Huntington’s disease brain activity and synchronicity alteration (z-score) with receptor/transporter distribution. The figure plots the correlation (Fisher’s z-transformed correlation coefficients) with neurotransmitter maps of the difference of each Huntington’s disease patient’s fALFF (A, Cohort 1; B, Cohort 2) or LCOR (C, Cohort 1; D, Cohort 2) to the mean of controls (z-score). The more the distributions of the correlation coefficients differ from zero, the stronger the correlation of brain activity/synchronicity alteration with the total neurotransmitter signal in the respective cohort of patients with Huntington’s disease. The distribution of Fisher’s z-transformed correlation coefficients was significantly different from null (*P < 0.05) in Cohort 2 for fALFF for 5HT1b (P < 0.001) and the µ-opioid receptor (MU, P = 0.003) and LCOR in both cohorts for the serotonin transporter (SERT, P = 0.001, Cohort 1; P < 0.001, Cohort 2); D1 (P < 0.001; both cohorts), D2 (P = 0.003, Cohort 1; P = 0.006, Cohort 2) and dopamine uptake transporter (DAT, P < 0.001, Cohort 1; P = 0.003, Cohort 2). Because coefficients were negative this indicates a loss of function (fALFF or LCOR) that was spatially correlated to whole-brain expression of the respective neurotransmitter system. Horizontal lines within box plots represent medians, whiskers limit the 1.5-fold of the interquartile range and crosses highlight outliers. Red corresponds to the serotonin system (5HT1a, 5HT1b, 5HT2a, SERT), blue to the dopamine system [D1, D2, fluoro-dopa (FDOPA), DAT], brown to GABAa receptors, beige to the opioid system and green to the noradrenaline transporter (NAT). E–J show the link between strength of co-localization of LCOR alteration and D1 (E–G) or SERT (H–J) expression and motor symptom severity, or functional impairment, derived from the subscores of the Unified Huntington’s Disease Rating Scale total motor score (E and H), functional assessment score (F and I) and total functional capacity score (G and J). Brighter and darker blue (D1) or red (SERT) dots correspond to the Fisher z-transformed correlation coefficients and rating scale scores in manifest Huntington’s disease of the first or the second cohort. P-values are false discovery rate-corrected and ρ the corresponding Spearman correlation coefficients. Lines and coloured backgrounds represent linear fits and the first confidence interval. n.s. = not significant; 1st = Cohort 1; 2nd = Cohort 2.
With respect to LCOR, there was a significant negative correlation of LCOR alterations in manifest Huntington’s disease with the distribution of the dopaminergic D1 and D2 receptors as well as of the dopamine and serotonin transporters (Table 2 and Fig. 2C). We next examined the dependence of LCOR alteration on the respective receptor/transporter availability for each atlas region (Fig. 3). In both cohorts, LCOR was higher than normal in regions expressing low levels of D1, D2, DAT and SERT signal while regions with the highest signal of D1, D2 and DAT showed increased (caudate), decreased (pallidum and putamen) or no clear assignment (nucleus accumbens) in local synchronization. Regions rich in SERT showed increased (thalamus, amygdala), decreased (basal forebrain, putamen, pallidum) or no clear assignment (nucleus accumbens) in local synchronization in both cohorts (see corresponding rank-rank-plots of the Spearman correlations in Supplementary Fig. 4).
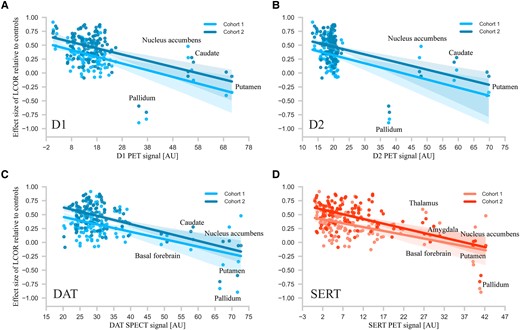
Regional differences in altered synchronicity (LCOR) and their relation to the expression of D1, D2, and transporters of dopamine and serotonin. The figure plots for each region the dependence of effect size (Cohen’s d) of LCOR alterations after atrophy correction in manifest Huntington’s disease with D1 (A, blue), D2 (B, blue) receptor, dopamine transporter (DAT; C, blue) or serotonin transporter (SERT; D, red) availability. The correlations between the amount of receptor/transporter expression and LCOR alterations indicate that LCOR is reduced in subcortical regions expressing the most neurotransmitter/receptor and increased in cortical areas with the least expression. Lines represent linear fits and the first confidence interval.
These associations were also significant when comparing manifest and premanifest Huntington’s disease after adjustment for age (Supplementary Fig. 5A). All of the associations of LCOR alterations with specific neurotransmitter receptors and transporters observed in the first Huntington’s disease cohort were also replicated in comparisons of manifest Huntington’s disease of the second cohort with their respective healthy controls (Fig. 2D) and were similar when correcting for atrophy (Supplementary Fig. 3E and F). When using the Schaefer cortical parcellation atlas in combination with the Neuromorphometrics atlas, we find largely similar associations in both cohorts between functional alterations and the respective neurotransmitter systems with and without atrophy correction (fALFF: Supplementary Figs 6A and B and 7A and B; LCOR: Supplementary Figs 6E and F and 7E and F; Supplementary Table 5).
Because we found co-localizations of functional changes with receptors and transporters of the dopaminergic and serotonergic systems, we examined whether anti-dopaminergic (dopamine receptor antagonists or tetrabenazine) or serotonergic medication influenced the observed spatial correlation coefficients. Of 32 patients with manifest Huntington’s disease in the first cohort, 12 subjects were taking dopaminergic and 8 serotonergic medications. Of 29 patients with manifest Huntington’s disease in the second cohort, 18 were taking dopaminergic and 19 serotonergic medications. Except for a weak significant effect of dopaminergic medication on the co-localization of LCOR with DAT in the first cohort [P = 0.033; F(1,28) = 5.04], dopaminergic or serotonergic medication had no significant effect on the remaining spatial correlation coefficients. Detailed statistics for the respective cohorts can be found in the Supplementary Table 6.
Reduced local synchronization in D1, or SERT, rich regions is associated with symptom severity
We next evaluated whether the strength of the above co-localizations with specific receptors and transporters was also associated with motor or functional impairment observed in the respective manifest Huntington’s disease populations. In the first cohort, the strength of co-localization between LCOR alteration (manifest versus controls) and D1, or SERT, signalling was significantly correlated with UHDRS total motor score (D1: P = 0.004, ρ = −0.5; SERT: P = 0.037, ρ = −0.37) and functional impairment measured with the UHDRS functional assessment (D1: P = 0.003, ρ = 0.5; SERT P = 0.01, ρ = 0.45) and total functional capacity scales (D1: P = 0.002, ρ = 0.53; SERT: P = 0.013, ρ = 0.44), suggesting that reduced local synchronization in D1, or SERT, rich regions is associated with motor signs of Huntington’s disease increase and patients are more affected in their activities of daily living (Fig. 2E–G). The same correlation was found for the LCOR alteration when comparing manifest with premanifest Huntington’s disease (Supplementary Fig. 5B). The correlation between LCOR-D1 co-localization and UHDRS total motor score (not significant after correction for multiple comparisons, P = 0.04, ρ = −0.34) and total functional capacity score (P = 0.005, ρ = 0.5) was replicated in the second manifest Huntington’s disease cohort (Fig. 2H–J and Supplementary Table 7). Following atrophy correction, correlations between clinical scores and the strength of co-localization of D1 with LCOR remained significant in the first (motor: P = 0.007, ρ = −0.47; function: P = 0.017, ρ = 0.42; total functional capacity: P = 0.016, ρ = 0.42) but not in the second cohort (Supplementary Fig. 8A–F and manifest versus premanifest; Supplementary Fig. 8G–L).
Caudate volume and caudate LCOR predict Huntington’s disease motor phenotype
Using a multiple linear regression, we were able to significantly predict total motor score [R2 = 0.64, F(3,78) = 45.86, P < 0.001]. Volume of the caudate (β = −9.68, P < 0.001; explained variance 51%), LCOR of the caudate (β = 81.17, P < 0.001; explained variance 9%) and disease burden (β = 0.05, P = 0.004; explained variance 4%) all explained a significant part of the variance in the total motor score. Anti-dopaminergic medication did not contribute significantly to the model.
Using a logistic regression, we were also able to significantly predict clinical classification into presymptomatic and manifest Huntington’s disease [χ2(2) = 53.42, P < 0.001]. The model explained 67% of the variance in clinical classification and correctly classified 85.5% of cases. Significant predictors in the classification model were volume of the caudate (β = −2.72, P = 0.001) and disease burden (β = 0.02, P = 0.013). When using clinical classification based on a UHDRS total motor score of 10, we were also able to predict the clinical classification [χ2(3) = 66.40, P < 0.001]. The model explained 75% of variance and correctly classified 92.7% of cases. Significant predictors in that classification model were volume of the caudate (β = −2.76, P = 0.001), LCOR of the caudate (β = 17.35, P = 0.027) and disease burden (β = 0.02, P = 0.012).
Discussion
Inheriting the HTT mutation likely promotes events in vulnerable brain regions, such as the striatum, that ultimately result in the loss of neurons, in particular medium spiny striatal neurons.37 From being structurally normal a long time before unequivocal motor manifestations of Huntington’s disease occur, the brains of Huntington’s disease gene carriers develop degenerative changes with no or only very minor motor or cognitive differences to healthy controls.1,38,39 This is accompanied by subtle functional and effective connectivity changes between regions in networks governing motor behaviour or cognition40-42 until the neurodegenerative changes impact brain function to a degree that causes unequivocal clinical signs of Huntington’s disease. It is likely that this event reflects the point in time when brain function can no longer be sufficiently maintained to support normal motor and cognitive functions. In contrast to long-range functional connections, we find that functional activity within cortical and subcortical regions remains normal in the premanifest Huntington’s disease phase despite clear evidence of brain atrophy. As long as in a given network the individual grey matter network hubs can maintain their local functionality, the overall functional network capability may suffice to enable normal behaviour without any clinical signs of disease or compromise in the activities of daily living. Our data of reduced regional functional activity in very early manifest Huntington’s disease suggest that, subsequently, signs of Huntington’s disease emerge when function declines within the important hub regions caudate nucleus, putamen, bilateral superior parietal cortex, hippocampus and bilateral superior frontal regions. As patients advance, the functional abnormalities become more widespread to include further hub regions such as thalamus, precuneus and insula.
As substantial atrophy is not associated with regional functional loss in premanifest Huntington’s disease the relationship between structural and functional changes is therefore not linear within the period leading up to the eventual conversion to manifest disease. Structural loss exceeds functional loss, suggesting that networks subserving essential motor behaviours have some functional reserve to compensate for structural loss.43 When this reserve is exhausted the amount of functional change seems proportional to the degree of atrophy in a narrow time window very early in the motor manifest stage. Even with only slightly more advanced disease, as in the second cohort, the degree of functional change exceeded what would have been predicted if the degree of atrophy related linearly to function. This indicates that the degenerative changes underlying brain atrophy may have to reach a certain threshold to affect function in important network hub regions and cause conversion to clinically manifest disease; following conversion, any further loss of brain tissue can have more pronounced, disproportionate, functional consequences. A model for compensation posits that increased long-range functional network connectivity maintains the level of behaviour despite structural loss.43 Here, we show that a loss of overall activity in important hub regions may affect how these hubs synchronize their remaining activity. The synchronized cooperative efforts of the hubs within a network, in turn, ensure that network performance can maintain normal behaviour. This was the case in premanifest Huntington’s disease where, in addition to normal local activity, a measure of regional synchronicity, LCOR, remained normal, similar to what has been reported for regional homogeneity, a related measure.44 As clinical signs of network dysfunction emerged in early manifest Huntington’s disease, regional synchronicity differed from normal. In contrast to the consistent reduction of fALFF as an indicator for local overall activity, local synchronicity (LCOR) was higher in some regions and lower in others. Independent of structural loss, synchronicity was higher than normal in caudate nucleus, temporal lobe, superior frontal gyrus, supplementary motor area, the limbic system, thalamus and cerebellum while synchronicity was reduced in the putamen.
Local functional activity and synchronicity may depend on the type(s) of neurotransmitters and receptors that contribute to function in a given region. We therefore next related the patterns of several neurotransmitter systems derived from SPECT/PET maps in healthy people to the spatial patterns of structural and functional alterations in Huntington’s disease. The synchronicity was reduced mainly in subcortical regions such as the putamen, which are rich in D1, D2, dopamine transporters and serotonin transporters. However, the dopamine receptor-rich caudate nucleus showed markedly increased synchronicity similar to other important regions that were not associated with these neurotransmitter systems. With the exception of the caudate nucleus the dopamine receptor-rich regions most vulnerable to Huntington’s disease pathogenesis19,45 therefore seem to lose their ability to synchronize their local activity. This, in turn, may prompt cortical network partners to over-synchronize, perhaps in an effort to compensate for the consequences the loss of synchronicity in the basal ganglia has for overall network function or simply because they lack the basal ganglia input they normally receive. The Huntington’s disease–associated degenerative brain changes affecting important network hub regions thus likely compromise their functional ability and, eventually, after passing a threshold, disrupt the functional homeostasis of networks in which these subcortical and cortical regions play an important role. Indeed, connectivity analyses have suggested that connections between rich club hubs were those most vulnerable.13,14 Impaired network function then results in the manifestation of clinical signs of Huntington’s disease. Our data support the assumption that rich club hub function itself determines their influence on network function relevant for behaviour, showing that increasing dysfunction of dopamine receptor-rich basal ganglia was associated with a higher total motor score and more pronounced impairments in activities of daily living. The caudate nucleus, the region first affected pathologically,46,47 may play a particularly prominent role given that motor behaviour was worse as synchronicity and atrophy increased in this region. Importantly, caudate nucleus synchronicity significantly improved the models predicting total motor score (in addition to caudate volume and disease burden) or predicting the classification into premanifest or motor manifest Huntington’s disease. This emphasizes the particularly relevant contribution of this hub region to the Huntington’s disease motor phenotype. The functional connections of the human striatum with many different cortical areas follow a topographical organization so that specific areas in the striatum form functional units with their cortical partners.16 In line with this notion, depending on the striatum’s respective functional connections with the cortex, i.e. limbic, sensory-motor or executive, dopamine release was observed in the corresponding striatal subdivisions.17 In Huntington’s disease, the degenerative process does not affect the whole striatum indiscriminately.48 Therefore, the functional consequences within cortico-basal ganglia circuitry likely depend on which striatal subdivisions are most affected. Thus, functional change within the striatum may also not be homogeneous, as shown by our LCOR data that differed in caudate nucleus and putamen. This could, in turn, contribute to different clinical symptoms in Huntington’s disease including, but not limited to, abnormal motor behaviour.12 As the disease advances, functional brain changes may occur in other important brain regions in association with other neurotransmitter systems, as suggested by the significant association between fALFF alterations and the distribution of the serotonergic 5-HT-1B and opioid µ receptors that was only observed in the second, more advanced Huntington’s disease cohort.
Fractional amplitude of low-frequency fluctuations and LCOR both estimate local activity. However, there are several conceptual differences. fALFF is based on the amplitude of the local BOLD signal, so it may be more susceptible to non-neuronal processes affecting oxygen delivery (such as heart rate, blood pressure, respiration). Restriction to low frequencies removes some, but not all, of these confounding effects. In contrast, LCOR is presumably more robust to such non-neuronal influences and reflects local connectivity/synchronisation. We cannot distinguish synchronized inhibition from synchronized excitation in a given region. Both lead to an increase in LCOR. Neurotransmitter systems, like dopamine or serotonin, may modulate the quality of local neuronal activity, inhibitory or excitatory, rather than overall BOLD amplitude. This may explain why we observed an association with neurotransmitter systems and LCOR rather than fALFF.
We infer on the evolution of the structure–function relationships and their repercussions for behaviour from cross-sectional data. In addition, our receptor/neurotransmitter distribution data derive from the association with the anatomical distribution of neurotransmitter systems in normal brains, with no direct evidence in Huntington’s disease. We therefore interpret our data cautiously. However, the inclusion of two different Huntington’s disease cohorts, each with their own matched control group, is a strength of the cross-sectional approach we have taken. A further limitation is that some participants were medicated with drugs targeting the receptors we were examining, e.g. dopamine receptors. Medication may therefore have influenced the function of the regions they target.22 However, apart from a correlation of anti-dopaminergic medication and DAT data in the first cohort statistical modelling of the influence of anti-dopamine medication or selective serotonin reuptake inhibitors did not change the relationships we report, including for predictions of the motor phenotype. Medication may have had an effect on the motor phenotype and brain function. However, given that medication, in particular anti-dopaminergic medication, had no effect on the prediction model, it must have influenced both function and the motor phenotype in the direction predicted by our regression models. Therefore, we do not think that medication has had a major influence on our data and the conclusions we draw.
Taken together, we show an association between local dysfunction in important network hubs and the emergence of clinical signs of Huntington’s disease that is not dependent on the amount of structural loss similar to what has been described in Huntington’s disease mouse models.49 These network hubs belong to the rich club of highly interconnected cortical and subcortical areas so called because of the amount of connections they have to other hubs, suggesting they play a particularly important role in network function.50 This indicates that the functional integrity of these rich club hub regions is crucial for maintaining functional network homeostasis across all networks in which they are involved, and possibly also between networks.51 The caudate nucleus emerged as functionally particularly relevant. In the caudate nucleus and the putamen medium-spiny GABAergic projection neurons that receive dopaminergic input are the most abundant type of neuron18,52; cholinergic or GABAergic inter-neurons help regulate their activity.53 Once functional homeostasis can no longer be maintained in the striatum, networks subserving for instance motor behaviour start to fail and motor signs of disease emerge. It remains unclear whether this alone suffices to impact network function and cause a clinical phenotype. Alternatively, network dysfunction may not be caused solely when the hubs themselves are functionally compromised but also involves abnormal connectivity between these rich club network partners.13,14 Given the extensive white matter changes that can already be observed in very early manifest Huntington’s disease,54 structural properties of network connections are compromised by Huntington’s disease pathogenesis. This can impair synchronization of information transfer in relation to the integrity of white matter connections between these partners. We have previously shown that close to the predicted onset of manifest Huntington’s disease the timing accuracy of synchronization and desynchronization following transcranial magnetic stimulation input to the motor cortex was affected compared with healthy controls in association with worse performance on a task that requires the repeated initiation, execution and termination of movement.55 The earliest changes in local synchronicity may be observed in hubs, such as the dopamine receptor-rich caudate nucleus, that are particularly vulnerable to Huntington’s disease pathogenesis. Importantly, assessing local synchronicity in the caudate nucleus, in addition to structural measures such as volume, improved predictions of the UHDRS total motor score, a measure of the severity of the Huntington’s disease motor phenotype. This points to the importance of distinguishing between the structural and functional impact of expressing mutant huntingtin in the caudate nucleus. This may be different in other disorders in which other networks and their hub regions, and neurotransmitter systems, seem most vulnerable, such as in Parkinson’s disease or Alzheimer’s disease.56 Insight into what happens in Huntington’s disease could serve as a model for what might be a more general rule in neurodegenerative diseases.
Acknowledgements
We thank all participants for taking part in this research.
Funding
J.D. has received funding from the European Union's Horizon 2020 research and innovation program under grant agreement No. 826421, ‘TheVirtualBrain-Cloud’. S.C. and S.B.E. have received funding from the European Union’s Horizon 2020 research and innovation program under grant agreement No. 945539 (Human Brain Project SGA3). No funding was received towards this work.
Competing interests
The authors report no competing interests.
Supplementary material
Supplementary material is available at Brain online.
References
Author notes
Juergen Dukart and Michael Orth contributed equally to this work.

