


Abstract
Isolated rapid eye movement sleep behaviour disorder (iRBD) is a sleep disorder characterized by the loss of rapid eye movement sleep muscle atonia and the appearance of abnormal movements and vocalizations during rapid eye movement sleep. It is a strong marker of incipient synucleinopathy such as dementia with Lewy bodies and Parkinson’s disease. Patients with iRBD already show brain changes that are reminiscent of manifest synucleinopathies including brain atrophy. However, the mechanisms underlying the development of this atrophy remain poorly understood.
In this study, we performed cutting-edge imaging transcriptomics and comprehensive spatial mapping analyses in a multicentric cohort of 171 polysomnography-confirmed iRBD patients [67.7 ± 6.6 (49–87) years; 83% men] and 238 healthy controls [66.6 ± 7.9 (41–88) years; 77% men] with T1-weighted MRI to investigate the gene expression and connectivity patterns associated with changes in cortical thickness and surface area in iRBD. Partial least squares regression was performed to identify the gene expression patterns underlying cortical changes in iRBD. Gene set enrichment analysis and virtual histology were then done to assess the biological processes, cellular components, human disease gene terms, and cell types enriched in these gene expression patterns. We then used structural and functional neighbourhood analyses to assess whether the atrophy patterns in iRBD were constrained by the brain’s structural and functional connectome. Moreover, we used comprehensive spatial mapping analyses to assess the specific neurotransmitter systems, functional networks, cytoarchitectonic classes, and cognitive brain systems associated with cortical changes in iRBD. All comparisons were tested against null models that preserved spatial autocorrelation between brain regions and compared to Alzheimer’s disease to assess the specificity of findings to synucleinopathies.
We found that genes involved in mitochondrial function and macroautophagy were the strongest contributors to the cortical thinning occurring in iRBD. Moreover, we demonstrated that cortical thinning was constrained by the brain’s structural and functional connectome and that it mapped onto specific networks involved in motor and planning functions. In contrast with cortical thickness, changes in cortical surface area were related to distinct genes, namely genes involved in the inflammatory response, and to different spatial mapping patterns. The gene expression and connectivity patterns associated with iRBD were all distinct from those observed in Alzheimer’s disease.
In summary, this study demonstrates that the development of brain atrophy in synucleinopathies is constrained by specific genes and networks.
Introduction
Isolated rapid eye movement sleep behaviour disorder (iRBD) is a parasomnia characterized by abnormal movements and vocalizations during rapid eye movement sleep that typically develops into dementia with Lewy bodies, Parkinson’s disease, and multiple system atrophy.1,2 As a prodromal synucleinopathy, iRBD patients show brain changes like those seen in manifest synucleinopathies.3 In particular, brain atrophy has been shown to occur in iRBD patients,4 correlates with clinical changes,5-8 especially cognitive impairment,6 and predicts the phenoconversion to dementia with Lewy bodies compared to Parkinson’s disease.9 However, to date, the mechanisms underlying the development of brain atrophy and its patterns in iRBD remain poorly understood.
A collection of observations in humans and experimental findings in animals support the notion that the pathology arises from a prion-like spreading occurring within a brain environment characterized by some cells being more selectively vulnerable to pathology than others.10-12 A recent study tested the prion-like spreading hypothesis and the selective vulnerability hypothesis using an agent-based computational model that simulates (in silico) the propagation of alpha-synuclein based on local gene expression and connectivity.13 The simulations derived from this model were shown to recreate the distribution of alpha-synuclein pathology in the mouse brain after the injection of preformed fibrils.14 When applied to iRBD and Parkinson’s disease, this model demonstrated that the patterns of atrophy could be recreated computationally and that both gene expression and connectivity were determinant factors shaping atrophy.13,15,16 However, in these studies, only the regional expression of two genes, SNCA and GBA, was used to model the agents’ spread, thus limiting the breadth of understanding of the wider genetic correlates that may underlie structural brain changes in synucleinopathies. To our knowledge, no study has yet investigated the patterns of gene expression associated with cortical changes in iRBD.
Imaging transcriptomics is a recent approach that allows a multivariate investigation into the associations between brain anatomy and the transcriptional activity of genes across the whole brain.17 In Parkinson’s disease, this approach has revealed that the regions showing greater progression of atrophy over 2 and 4 years had a greater expression of genes involved in synaptic activity and cell signalling.18 Furthermore, the computational modelling of atrophy spread in Parkinson’s disease has also revealed the involvement of transcripts associated with immune and lysosomal functions.19,20 Imaging transcriptomics has also demonstrated that increased brain iron content in Parkinson’s disease related to genes implicated in metal detoxification and synaptic transmission/signalling.21 In addition, by virtue of arising from a pathological process that spreads through the connectome, many studies have shown that atrophy in neurodegenerative diseases is shaped by connectivity.13,15,22,23 In Parkinson’s disease, the progression of atrophy was shown to map onto specific major functional networks, being significantly more pronounced in the limbic, default mode, and visual networks after 2 years, and then extending to almost all networks in the following years.18 To our knowledge, the gene expression and connectomics underpinnings of cortical changes in prodromal synucleinopathies remain to be investigated.
Since iRBD is an early stage during which clinical features of synucleinopathies are still modest, identifying abnormalities on MRI scans and understanding their underlying mechanisms may offer new insights into potential therapies aimed at slowing or stopping the neurodegenerative process in patients. In this study, our objective was to combine imaging transcriptomics and comprehensive spatial mapping to investigate the normal gene expression and connectivity characteristics of the cortical regions most affected in iRBD. Using a large cohort of polysomnography-confirmed iRBD patients and controls with T1-weighted MRI imaging, we used partial least squares (PLS) regression to identify the gene expression patterns associated with cortical thinning in iRBD and investigated the biological processes, cellular components, human disease gene terms, and cell type enrichment in these patterns. We next investigated if the patterns of cortical thinning in iRBD mapped onto specific neurotransmitter systems, functional networks, cytoarchitectonic classes, and spatial patterns related to cognitive functions. Then, we assessed whether these patterns were specific to cortical thinning by assessing the gene expression and spatial mapping patterns underlying the changes in cortical surface area in iRBD. Finally, to understand whether the patterns were specific to synucleinopathies, the imaging transcriptomics and spatial mapping analyses were repeated in patients with Alzheimer’s disease. We hypothesized that specific gene expression and spatial mapping patterns would underlie cortical thinning in iRBD and that these patterns would be specific to cortical thickness compared to surface area and to iRBD compared to Alzheimer’s disease.
Materials and methods
Participants
A total of 443 participants (182 polysomnography-confirmed iRBD patients and 261 age- and sex-matched controls) with T1-weighted MRI were recruited from the Movement Disorders clinic at the Hôpital de la Pitié-Salpêtrière (France), the Centre for Advanced Research on Sleep Medicine at the Hôpital du Sacré-Cœur de Montréal (Canada), the ForeFront Parkinson’s Disease Research Clinic at the University of Sydney (Australia), Aarhus University Hospital (Denmark), and the Parkinson’s Progression Markers Initiative baseline cohort.24 The participants were part of a previous study that assessed brain atrophy in iRBD (Table 1 for demographics and clinical variables of the different cohorts).15 For up-to-date information on the Parkinson’s Progression Markers Initiative database, visit www.ppmi-info.org. All patients received a polysomnography-proven diagnosis based on the International Classification of Sleep Disorders, third edition.25 The absence of concomitant dementia with Lewy bodies, Parkinson’s disease or multiple system atrophy was confirmed at the neurological evaluation closest in time to the MRI acquisition.26-28 All participants were part of research protocols approved by local ethics committees, and the project was approved by the Research Ethics Board of the McGill University Health Centre.
Demographics and clinical variables of the cohorts after quality control
| Cohort | iRBD patients | Controls | P-value |
|---|---|---|---|
| Total cohort, n | 138 | 207 | |
| Age (SD) | 67.0 (6.3) | 66.2 (7.6) | 0.28 |
| Sex, n (% men) | 112 (81) | 159 (77) | 0.34 |
| MoCA | 26.4 (2.8) | 27.8 (1.7) | <0.001 |
| MDS-UPDRS-III | 7.1 (6.6) | 2.0 (3.5) | <0.001 |
| Paris cohort, n | 41 | 37 | – |
| Age (SD) | 66.6 (5.6) | 64.9 (7.3) | 0.27 |
| Sex, n (% men) | 36 (88) | 30 (81) | 0.41 |
| MoCA | 26.8 (3.0) | 27.2 (2.3) | 0.45 |
| MDS-UPDRS-III | 8.7 (6.9) | 3.6 (4.8) | <0.001 |
| Montreal cohort, n | 48 | 35 | – |
| Age (SD) | 65.8 (6.4) | 65.0 (7.1) | 0.57 |
| Sex, n (% men) | 37 (77) | 21 (60) | 0.09 |
| MoCA | 25.9 (2.7) | 28.2 (1.4) | <0.001 |
| UPDRS-III | 4.3 (3.6) | – | – |
| Sydney cohort, n | 14 | 22 | – |
| Age (SD) | 67.0 (8.0) | 70.0 (5.3) | 0.23 |
| Sex, n (% men) | 12 (86) | 14 (64) | 0.26 |
| MoCA | 27.1 (2.3) | – | – |
| MDS-UPDRS-III | 11.0 (5.7) | – | – |
| Aarhus cohort, n | 16 | 19 | – |
| Age (SD) | 68.2 (6.9) | 67.8 (5.9) | 0.87 |
| Sex, n (% men) | 13 (81) | 14 (74) | 0.70 |
| MoCA | 27.1 (2.1) | 27.1 (2.1) | 0.92 |
| MDS-UPDRS-III | 1.1 (1.5) | – | – |
| PPMI cohort, n | 19 | 94 | – |
| Age (SD) | 70.1 (5.3) | 66.0 (8.4) | 0.010 |
| Sex, n (% men) | 14 (74) | 80 (85) | 0.23 |
| MoCA | 25.8 (3.4) | 28.2 (1.2) | 0.009 |
| MDS-UPDRS-III | 5.5 (6.0) | 1.3 (2.5) | 0.008 |
The subjects presented here are those after quality control. Data are presented as mean (SD). P-values in bold represent significant differences. MDS = Movement Disorders Society; MoCA = Montreal Cognitive Assessment; PPMI = Parkinson’s Progression Markers Initiative; SD = standard deviation; UPDRS-III = Unified Parkinson’s Disease Rating Scale, motor examination.
MRI acquisition
MRI acquisition was performed in every centre to acquire T1-weighted images. The Montreal cohort underwent T1-weighted imaging with a 3 T Siemens TIM Trio scanner with a 12-channel head coil, magnetization-prepared rapid acquisition gradient echo (MPRAGE) sequence with the following parameters: repetition time (TR): 2300 ms, echo time (TE): 2.91 ms, flip angle: 9°, and voxel size: 1 mm³ isotropic. The Paris cohort underwent T1-weighted imaging with a 3 T Siemens TIM Trio scanner with a 12-channel head coil, MPRAGE sequence: TR: 2300 ms, TE: 4.18 ms, inversion time (TI): 900 ms, flip angle: 9°, and voxel size: 1 mm³ isotropic; or a 3 T PRISMA Fit scanner with a 64-channel head coil, MP2RAGE sequence: TR: 5000 ms, TE: 2.98 ms, TI: 700 and 2500 ms, flip angle: 4° and 5°, GRAPPA: 3, and voxel size: 1 mm³ isotropic. The Sydney cohort was imaged with a GE Discovery MR750 3 T scanner with an 8-channel head coil, BRAVO sequence: TR: 5800 ms, TE: 2.6 ms, flip angle: 12°, and voxel size: 1 mm³ isotropic. The Aarhus cohort was imaged with a 3 T Siemens MAGNETOM Skyra scanner with a 32-channel head coil, MPRAGE sequence: TR: 2420 ms, TE: 3.7 ms, TI: 960 ms, flip angle: 9°, and voxel size: 1 mm³ isotropic. The T1-weighted images from the Parkinson’s Progression Markers Initiative cohort are described elsewhere.24
Quantification of atrophy
Quantification of cortical thickness and surface area was performed previously.15 Briefly, from the 443 scans available, 409 passed quality control and underwent surface-based processing with FreeSurfer (version 6.0.0) to generate cortical thickness and surface area maps. All maps were inspected visually by a trained rater (S.R.)29,30 and excluded if major reconstruction errors (score >2) were found, yielding 345 maps from 138 iRBD patients and 207 controls matched for age (iRBD: 67.0 ± 6.3 years, controls: 66.2 ± 7.6, P = 0.28) and sex (iRBD: 81% men, controls: 77% men, P = 0.34). Cortical thickness and surface area values were parcellated using the 34-region Desikan–Killiany atlas and W-scored to control the effects of age, sex, and centre observed in controls.31,32 For the purpose of W-scoring, the Parkinson’s Progression Markers Initiative data were treated as coming from one single centre. Since cortical surface area scales with head size,33 surface area values were divided by the total intracranial volume before W-scoring. Cortical thickness and surface area W-scores were then z-scored and entered in separate PLS regression models to investigate their associations with whole-brain transcriptional activity. The primary analyses were done with cortical thickness as the predicted variable to understand the bases of cortical atrophy in iRBD; the same analyses were repeated with surface area to investigate the contrast between different cortical metrics.
Regional gene expression extraction
To assess the genetic features of the regions showing cortical changes in iRBD, we extracted from the Allen Human Brain Atlas the regional gene expression data from the same 34 regions used for measuring atrophy.34 The Allen Human Brain Atlas provides the expression of more than 20 000 genes quantified across 3702 brain tissue samples from six post-mortem brains.35 Its whole-brain spatial coverage makes it the most comprehensive gene expression atlas of the adult human brain to date, and it is widely used in imaging transcriptomics for extracting regional gene expression data from user-defined parcellations.17
For the main analyses, we extracted the microarray data from the six post-mortem brains [ages: 24, 31, 39, 49, 55, and 57 years old; five (83%) male and one (17%) female] provided by the Allen Human Brain Atlas using abagen (version 0.1.3; https://github.com/rmarkello/abagen).35 First, microarray probes were reannotated based on previous data36; probes not matched to a valid Entrez ID were discarded. Probes were then filtered based on their expression intensity relative to background noise,37 such that probes with intensity less than the background in ≥50% of samples across donors were discarded. When multiple probes indexed the expression of the same gene, we selected and used the probe with the most consistent pattern of regional variation across donors (i.e. differential stability)38:
where ρ is Spearman’s rank correlation of the expression of a single probe p across regions in two donors Bi and Bj, and N is the total number of donors. Here, regions corresponded to the structural designations provided in the ontology from the Allen Human Brain Atlas.34
The Montreal Neurological Institute coordinates of tissue samples were updated to those generated via non-linear registration using Advanced Normalization Tools (https://github.com/chrisfilo/alleninf). Samples were assigned to brain regions in the provided atlas if their Montreal Neurological Institute coordinates were within 2 mm of a given parcel. To reduce the potential for misassignment, sample-to-region matching was constrained by hemisphere and gross structural divisions (i.e. cortex, subcortex/brainstem, and cerebellum, such that e.g. a sample in the left cortex could only be assigned to an atlas parcel in the left cortex).36 All tissue samples not assigned to a brain region in the provided atlas were discarded.
Inter-subject variation was addressed by normalizing tissue sample expression values across genes using a robust sigmoid function39:
Where xmed is the median and IQRx is the normalized interquartile range of the expression of a single tissue sample across genes. Normalized expression values were then rescaled to the unit interval:
Gene expression values were then normalized across tissue samples using an identical procedure. Samples assigned to the same brain region were averaged separately for each donor and then across donors, yielding a regional expression matrix. Since four of the six post-mortem brains did not have available gene expression in the right hemisphere, the main analyses were performed using the gene expression from the left hemisphere. The resulting gene expression region of interest values were z-scored, entered as predictors in PLS regression, and used for the main analyses performed in this study.
Although the gene expression data were extracted from post-mortem brains with similar sex proportion (83% male, 17% female) as in the iRBD (81% male, 19% female) and control groups (77% male, 23% female), the average age differed significantly (post-mortem brains: 42.5 ± 13.4 years, P = 0.006 versus iRBD, P = 0.007 versus controls). We therefore tested whether our findings were robust to age effects on gene expression by extracting different subsets of gene expression from the post-mortem brains, namely from the two oldest brains (55 and 57 years, average: 56.0 years), from the three older post-mortem brains (49, 55, and 57 years old, average: 53.7 years), and using a leave-one-out procedure whereby one of the six brains was left out at each iteration and gene expression calculated on the remaining five brains (average age at each iteration: 39.6, 40.0, 41.2, 43.2, 44.8, and 46.2 years). In addition, to investigate the effect of laterality, we also extracted the gene expression data from the right hemisphere (two of the six brains) and repeated these analyses with these data.
Partial least squares regression
Partial least squares regression was used to identify the pattern of gene expression associated with cortical thickness W-scores in iRBD. PLS regression performs a dual decomposition of two matrices X and Y to derive components from X (34 regions × 15 633 genes) that account for the maximal amount of covariance explained by Y (34 thickness W-scores). To test significance, the empirical variance explained by each component was tested against the variance observed in 10 000 null models in which atrophy was randomly permuted between regions (random null models). Since the brain is characterized by a high level of spatial autocorrelation between regions,40 to demonstrate that the gene-atrophy associations were not due to lower-order spatial gradients, the empirical variance was compared to 10 000 spatially-constrained null models in which regions were shuffled using a spherical reassignment procedure that preserved spatial autocorrelation between regions (spatial null models).40 A PLS component was considered significant when fewer than 5% of the null models explained more variance than the original atrophy vector.
To identify the genes that contributed the most to the components associated with cortical changes, a bootstrapping resampling procedure was performed by randomly shuffling the rows of X and Y and by repeating the PLS regression with the shuffled matrices; this was repeated 5000 times to generate the null distribution and standard errors for each gene expression weight. Bootstrap ratios were calculated as the ratio between the weight of each gene expression and its bootstrap-estimated standard error and interpreted as a z-score.41 The gene lists were then ranked from the highest to the lowest scores based on the bootstrap ratios and used as inputs for gene set enrichment analysis (GSEA).
Gene set enrichment analyses
To examine the translational relevance of transcriptomic correlates of atrophy in iRBD, WebGestalt 2019 (http://www.webgestalt.org)42 was used to perform GSEA and identify the biological processes, cellular components, and human diseases gene terms enriched in the genes predicting cortical thickness W-scores in iRBD. GSEA assesses whether the genes located at the top or bottom of a ranked gene list, in this case derived from the bootstrapping resampling procedure, occurred more frequently than expected by chance.43 The Gene Ontology knowledge base (April 2019, http://geneontology.org) was used for biological process and cellular component gene terms, whereas the DisGeNET (version 5.0, May 2017, https://www.disgenet.org), Online Mendelian Inheritance in Man (OMIM; https://www.omim.org), and GLAD4U (November 2018, http://glad4u.zhang-lab.org/index.php) knowledge bases were used separately for human disease gene terms. The minimal and maximal number of genes for enrichment was set to 3 and 2000, respectively. Statistical correction for multiple testing was performed by running 1000 random permutations and adjusting P-values with the false discovery rate (FDR) method; for interpretability, only the top 10 most significant terms retrieved on the positive and negative ends were interpreted.
We also performed over-representation analysis in WebGestalt 2019 to investigate whether the genes most reliably associated with thickness W-scores were enriched for gene terms related to specific biological processes, cellular components, and human diseases compared to the complete gene set. The target list was composed of the genes with a bootstrap ratio weight ± 5.0 (corresponding to z-scores less than P < 0.0001), whereas the background list was composed of all the genes extracted from the Allen Human Brain Atlas. To ensure that the enrichment patterns were not due to the choice of a particular gene ontology platform, we repeated the over-representation analyses using GOrilla (http://cbl-gorilla.cs.technion.ac.il)44 to assess the biological process and cellular component gene terms enriched in the target lists (i.e. negatively or positively weighted genes with bootstrap ratios ± 5.0) compared to the same background list. We also repeated the PLS regression and gene enrichment analyses using the gene expression matrices extracted from the different subsets of post-mortem brains (i.e. oldest brains, older brains, and using the leave-one-out procedure) and from the post-mortem brains with right hemisphere gene expression data.
Virtual histology
We next used virtual histology to investigate whether the genes predicting cortical thickness W-scores in iRBD were enriched for specific brain cell types. Using single-cell RNA sequencing from five post-mortem studies performed on human cortical samples (see Seidlitz et al. 45 for a description of the different samples),18 the regional expression of the genes associated with astrocytes, endothelial cells, microglia, excitatory neurons, inhibitory neurons, oligodendrocytes, and oligodendrocyte precursor cells were extracted for the 34 regions and averaged across genes to generate an average regional gene expression for each of the seven cell types.46 Spearman’s correlation coefficients were computed between each cell type’s average regional gene expression and the regional cortical thickness W-scores. An association was considered significant when below the Bonferroni-corrected threshold of P < 0.0071 (seven correlations) and tested against 10 000 null models with and without preservation of the spatial autocorrelation between brain regions.
Structural and functional neighbourhood analysis
According to the prion-like spread hypothesis, pathology propagates between cells by following the constraints imposed by the brain’s architecture (connectivity).47 Here, we tested whether structural and functional connectivity constrained the cortical changes observed in iRBD by assessing whether the cortical thickness W-scores of each region were associated with the average cortical thickness W-scores measured in the structurally or functionally connected neighbours of each region. Unlike analyses involving gene expression, which were restricted to the left hemisphere, these network analyses were performed using both hemispheres. To identify the structural and functional neighbours of each region, the diffusion-weighted and resting-state functional MRI data from 70 healthy participants (28.8 ± 9.1 years, 27 females) were used to generate individual structural and functional connectivity maps. These data were processed previously48 and used in several studies assessing the impact of connectivity on atrophy.18,49-51 After exclusion of four connectivity maps with aberrant scores (three structural, one functional), the individual structural matrices were transformed into a group-consensus structural connectivity matrix that preserved the brain’s edge length distribution52; self-connections were converted to zero.
To assess the impact of structural connectivity, the structural neighbourhood change Di was quantified by averaging the structural change observed in the total number N of nodes j that had a structural connection with each region i (i.e. structural neighbours):
To assess the impact of functional connectivity, the functional neighborhood change was calculated by averaging the structural change observed in all the structural neighbours j weighted by the strength of the functional connection between region i and neighbour j (FCij):
Spearman’s correlation coefficients were calculated between the cortical thickness W-scores in iRBD, and the structural and functional neighbourhood change quantified in each region. The empirical correlation coefficients were tested against the correlations observed in sets of 10 000 randomized spatial and random null models. Additional analyses were also performed to investigate the correlations between the local cortical thickness W-scores in every region and the average change observed in regions that were not part of the region’s structural or functional neighbourhood.
Spatial mapping of cortical changes to brain systems
We performed a comprehensive mapping study of the cortical changes in iRBD by assessing whether the thickness W-scores were significantly more pronounced in specific brain systems, namely neurotransmitter systems, intrinsic functional networks, cytoarchitectonic classes, and spatial correlates of cognitive functions. For the neurotransmitter systems, the previously curated regional density maps of 18 receptors, transporters, and receptor binding sites associated with dopamine [D1,53 D2,54,55 dopamine transporter (DAT)56], serotonin [5-HT1A,57 5-HT1B,57,58 5-HT2A,59 5-HT4,59 5-HT6,60 serotonin transporter (5-HTT)59], noradrenaline [noradrenaline transporter (NET)],61 acetylcholine [α4β2,62 M1,63 vesicular acetylcholine transporter (VAChT)46,64,65], GABA (GABAA/BZ),66 glutamate (mGluR5),46,67,68 histamine (H3),69 endocannabinoids (CB1),70 and opioids (μ)71 were generated from the PET images of 1238 healthy individuals (718 males and 520 females between 18 and 68 years old depending on the tracer; see Supplementary Table 3 in Hansen et al.46 for demographic and methodological details for each PET tracer). These maps were parcellated into the same 68 regions used for measuring atrophy and separately z-scored. When several maps were available for a tracer, a weighted average map was generated based on the number of subjects used for each map. Spearman’s correlation coefficients were used to test the association between cortical thickness W-scores and the regional density of each map. Correlations surviving the Bonferroni-corrected threshold for each set of associations (P < 0.0028) were tested against sets of 10 000 randomized spatial and random null models.
We next investigated whether cortical thickness W-scores in iRBD were more pronounced in regions with a specific functional time course and laminar organization, using, respectively, the Yeo parcellation72,73 and the extended version of the von Economo and Koskinas atlas.73-75 The Yeo parcellation attributes every region to one of seven resting-state networks (i.e. visual, sensorimotor, dorsal attention, ventral attention, limbic, frontoparietal, and default-mode networks), whereas the von Economo and Koskinas atlas attributes every region to one of seven cortical lamination (cytoarchitectonic) classes [i.e. primary motor cortex, association cortices 1 and 2, primary and secondary sensory areas (dysgranular cortex), primary sensory cortex (agranular cortex), limbic regions, and insular cortex]. For each network and class, the cortical thickness W-scores were averaged and tested against sets of 10 000 randomized spatial and random null models.
We also tested the correspondence between the patterns of cortical thickness W-scores in iRBD and the probabilistic maps of the association between voxels and several cognitive processes. A total of 123 cognitive processes from the Cognitive Atlas (https://www.cognitiveatlas.org)46,76 were selected and their activation maps obtained from the meta-analytic activation maps available as part of the Neurosynth database (http://www.neurosynth.org).77 Neurosynth is a meta-analytic tool that provides a quantitative keyword-based summary of brain activation patterns based on more than 15 000 functional MRI studies. Every regional value represented the probability of each of the 68 cortical regions to be activated during the functional task associated with the cognitive process. Spearman’s correlations were performed to test the association between cortical thickness W-scores and the regional functional activation pattern of each cognitive process. Correlations surviving the Bonferroni-corrected threshold (P < 0.00041) were tested against sets of 10 000 randomized spatial and random null models.
Comparison to Alzheimer’s disease (reference group)
We next investigated whether the gene expression and connectivity patterns associated with cortical changes in iRBD were specific to synucleinopathies or shared across the spectrum of neurodegenerative diseases by performing the same analyses in a group of patients with a clinical diagnosis of Alzheimer’s disease. To do this, 101 patients with Alzheimer’s disease and T1-weighted MRI were obtained from the Alzheimer’s Disease Neuroimaging Initiative database (adni.loni.usc.edu).78,79 The Alzheimer’s Disease Neuroimaging Initiative was launched in 2003 as a public-private partnership, led by Principal Investigator Michael W. Weiner, MD. The primary goal of the Alzheimer’s Disease Neuroimaging Initiative has been to test whether the serial MRI, PET, other biological markers, and clinical and neuropsychological assessment can be combined to measure the progression of mild cognitive impairment and early Alzheimer’s disease. The 101 patients with Alzheimer’s disease were matched for age (66.2 ± 4.9 years) with the iRBD (67.0 ± 6.3 years, P = 0.24) and control groups (66.2 ± 7.6, P = 0.97) and processed similarly.15 Briefly, the scans from Alzheimer’s disease patients were processed using FreeSurfer 6.0, rated visually based on the same previously published criteria,29,30 and excluded if they presented with scores >2 out of 4 (i.e. major reconstruction errors). This led to the exclusion of 23 patients and resulted in a sample of 78 scans of patients with Alzheimer’s disease (66.0 ± 4.9 years), which was also matched for age to the iRBD (P = 0.24) and control groups (P = 0.83). Regional cortical thickness values were extracted from these 78 surfaces, harmonized with ComBat to correct for scanner variance,80 W-scored to generate regional values controlled for the effects of age and sex seen in controls,31,81 and averaged between patients to generate a vector representing the cortical thickness changes associated with Alzheimer’s disease. The imaging transcriptomics and comprehensive spatial mapping analyses described previously were repeated to investigate whether the genetic and connectivity patterns associated with cortical thickness changes in Alzheimer’s disease differed from those found in iRBD.
Data availability
The regional cortical thickness and surface area values are available at https://github.com/srahayel/SIR-RBD.
Results
Demographics and cortical changes in iRBD
Of the 443 participants,15 34 (7.7%) did not pass deformation-based quality control and 64 (15.6%) did not pass surface-based quality control, resulting in a final sample of 138 patients and 207 controls from which measures of cortical morphometry were derived. All measurements were converted to W-scores, which can be thought of as z-scores representing deviation from the expected mean of control subjects, while correcting for age, sex, and centre.31,32 The groups did not differ in age (iRBD: 67.0 ± 6.3, controls: 66.2 ± 7.6, P = 0.28) and sex (iRBD: 81% men, controls: 77% men, P = 0.34, Table 1 for demographics and clinical characteristics).
Vertex-wise comparisons of cortical thickness between patients and controls are reported elsewhere15; they showed that iRBD patients have significant thinning in the left posterior temporal and inferior parietal cortices, the left orbitofrontal and dorsolateral prefrontal cortices, and the right temporal and lateral occipital cortices after controlling for age, sex, and centre and multiple comparisons (Fig. 1A).15 The vertex-wise comparisons of cortical surface area, correcting additionally for total intracranial volume, also revealed increased cortical surface area in iRBD patients compared to controls in the left inferior temporal and entorhinal cortices (Supplementary Fig. 1).15

Patterns of gene expression underlying cortical thinning in iRBD. (A) Vertex-wise patterns showing the significant changes in cortical thickness in iRBD patients compared to controls. (B) Violin plots showing the percentage of variance in cortical thickness W-scores explained by gene expression; the dot represents the empirical variance, and the asterisk indicates the components that were significant against random and spatial null models. (C) Scatterplot of the association between thickness W-scores and the regional weights of the first component. (D) Brain renderings of the thickness W-scores and the regional weights of the first component. (E) Density plots of each gene’s bootstrapped weight on the first component; gene set enrichment analysis was performed on all genes, whereas over-representation analysis was performed on genes with bootstrap ratios ± 5.0. C = component; RM = random null models; SM = spatial null models.
Cortical thinning associates with mitochondrial function
Partial least squares regression was performed to compare spatial patterns of gene expression versus cortical thinning in iRBD. Of the five components tested, only the first explained significantly more variance in thickness than random null models (60.7% versus 23.4%, Prandom < 0.0001) and spatial null models that preserved the spatial autocorrelation between brain regions (60.7% versus 29.9%, Pspatial = 0.0005) (Fig. 1B). The regional weights of the significant component were positively associated with cortical thickness W-scores in iRBD patients (r = 0.78, P < 0.0001) (Fig. 1C), meaning that the genes negatively weighted on the component were more expressed in regions with greater cortical thinning and that the genes positively weighted on the component were less expressed in regions with greater cortical thinning (Fig. 1D).
We next applied GSEA to examine the translational relevance of the genes whose expression overlapped with cortical thickness changes in iRBD. The genes were ranked based on bootstrap ratio (Fig. 1E), and the resulting ranked gene list was intersected with several knowledge bases to identify the biological processes, cellular components, and human disease gene terms enriched at the top (positively weighted genes) or bottom (negatively weighted genes) of the list. In terms of biological processes, the genes most strongly expressed in association with greater cortical thinning (negatively weighted genes) were enriched for oxidative phosphorylation, with the most enriched terms being nicotinamide adenine dinucleotide (reduced form, NADH) dehydrogenase complex (complex I) assembly (normalized enrichment score: -2.44, PFDR < 0.0001), mitochondrial respiratory chain complex assembly (−2.37, PFDR < 0.0001), and trivalent inorganic cation transport (−2.32, PFDR < 0.0001) (Fig. 2A and Table 2). Of the 15 633 genes used as input, 554 (3.5%) genes were robustly associated with thickness W-scores in iRBD (i.e. bootstrap ratio weight ± 5.0), with 332 (60%) being negatively weighted and 222 (40%) being positively weighted (Fig. 1E). When assessing the enrichment of these genes compared to the complete gene list, over-representation analysis showed that the genes most strongly expressed in association with cortical thinning were particularly enriched for macroautophagy (Fig. 2B).
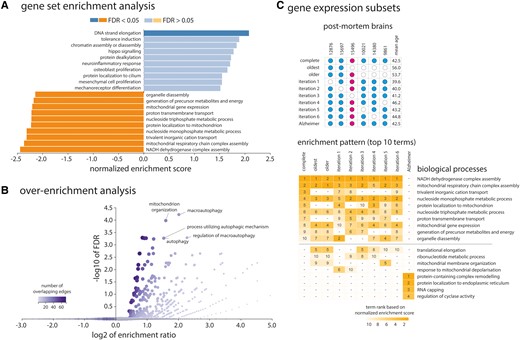
Enrichment analyses of the genes associated with cortical thinning in iRBD. (A) The top 10 biological process terms from the Gene Ontology Consortium knowledge base that are enriched in the positively and negatively weighted gene sets predicting cortical thinning in iRBD. Terms are ranked based on the normalized enrichment score; darker coloured bars present significantly enriched terms after FDR correction. (B) Volcano plot of the over-representation analysis showing the biological process terms enriched in the genes most strongly associated with cortical thinning in iRBD (bootstrap ratio < −5.0). The colour bar represents the number of overlapping edges for each gene category and the size of the dot represents the size of the gene category. (C) Additional gene enrichment analyses performed on different subsets of post-mortem brains (different gene expression matrices) showed that the enriched patterns in association with cortical thinning in iRBD were stable and different from Alzheimer’s disease. The upper grid represents the different post-mortem brains selected for each analysis, with post-mortem brain #15496 being a female donor. The lower grid represents the top 10 biological process terms obtained in each analysis, with numbers representing the respective ranking of the term based on the normalized enrichment score. GO = Gene Ontology.
Biological processes enriched in the genes predicting cortical thinning in iRBD
| GO identifier | GO term | Gene set size | Number of leading edge IDs | Enrichment score | Normalized enrichment score | FDR P- value |
|---|---|---|---|---|---|---|
| Negatively weighted (more expressed) genes | ||||||
| GO:0010257 | NADH dehydrogenase complex assembly | 58 | 44 | −0.622 | −2.442 | <0.0001 |
| GO:0033108 | mitochondrial respiratory chain complex assembly | 88 | 57 | −0.551 | −2.365 | <0.0001 |
| GO:0072512 | trivalent inorganic cation transport | 32 | 14 | −0.668 | −2.315 | <0.0001 |
| GO:0009123 | nucleoside monophosphate metabolic process | 275 | 126 | −0.467 | −2.313 | <0.0001 |
| GO:0070585 | protein localization to mitochondrion | 132 | 53 | −0.492 | −2.227 | 0.00019 |
| GO:0009141 | nucleoside triphosphate metabolic process | 262 | 120 | −0.450 | −2.220 | 0.00016 |
| GO:1902600 | proton transmembrane transport | 121 | 53 | −0.498 | −2.218 | 0.00014 |
| GO:0140053 | mitochondrial gene expression | 158 | 69 | −0.476 | −2.203 | 0.00012 |
| GO:0006091 | generation of precursor metabolites and energy | 405 | 173 | −0.420 | −2.175 | 0.00011 |
| GO:1903008 | organelle disassembly | 93 | 50 | −0.509 | −2.142 | 0.00028 |
| Positively weighted (less expressed) genes | ||||||
| GO:0022616 | DNA strand elongation | 21 | 11 | 0.638 | 2.081 | 0.015 |
| GO:0002507 | tolerance induction | 13 | 7 | 0.664 | 1.889 | 0.093 |
| GO:0006333 | chromatin assembly or disassembly | 119 | 37 | 0.392 | 1.838 | 0.102 |
| GO:0035329 | hippo signalling | 32 | 19 | 0.486 | 1.777 | 0.140 |
| GO:0008214 | protein dealkylation | 31 | 14 | 0.473 | 1.727 | 0.182 |
| GO:0150076 | neuroinflammatory response | 32 | 12 | 0.472 | 1.709 | 0.176 |
| GO:0033687 | osteoblast proliferation | 21 | 12 | 0.507 | 1.656 | 0.240 |
| GO:0061512 | protein localization to cilium | 39 | 12 | 0.407 | 1.550 | 0.265 |
| GO:0010463 | mesenchymal cell proliferation | 34 | 13 | 0.430 | 1.548 | 0.252 |
| GO:0042490 | mechanoreceptor differentiation | 44 | 15 | 0.380 | 1.517 | 0.267 |
The top 10 biological process terms enriched in the genes predicting cortical thinning in iRBD are reported ranked based on the normalized enrichment score. Bold values represent the terms significantly enriched after applying FDR correction. GO = Gene Ontology.
In terms of cellular components, GSEA revealed that the genes more expressed in association with cortical thinning were significantly enriched for components localized to the mitochondrion, including the mitochondrial membrane (−2.84, PFDR < 0.0001), respiratory chain (−2.80, PFDR < 0.0001), mitochondrial protein complex (−2.72, PFDR < 0.0001), and NADH dehydrogenase complex (−2.65, PFDR < 0.0001) (Table 3). In terms of human disease gene terms, the genes more expressed with cortical thinning in iRBD were enriched for terms related to mitochondrial diseases and lactic acidosis (Table 4).
Cellular components enriched in the genes predicting cortical thinning in iRBD
| GO identifier | GO term | Gene set size | Number of leading edge IDs | Enrichment score | Normalized enrichment score | FDR P value |
|---|---|---|---|---|---|---|
| Negatively weighted (more expressed) genes | ||||||
| GO:0044455 | mitochondrial membrane part | 206 | 128 | −0.589 | −2.843 | <0.0001 |
| GO:0070469 | respiratory chain | 86 | 61 | −0.656 | −2.799 | <0.0001 |
| GO:0098798 | mitochondrial protein complex | 248 | 135 | −0.554 | −2.724 | <0.0001 |
| GO:0030964 | NADH dehydrogenase complex | 45 | 35 | −0.699 | −2.645 | <0.0001 |
| GO:0005743 | mitochondrial inner membrane | 414 | 200 | −0.501 | −2.596 | <0.0001 |
| GO:0016469 | proton-transporting two-sector ATPase complex | 40 | 22 | −0.689 | −2.497 | <0.0001 |
| GO:0070069 | cytochrome complex | 27 | 17 | −0.682 | −2.258 | <0.0001 |
| GO:1905368 | peptidase complex | 85 | 37 | −0.526 | −2.230 | <0.0001 |
| GO:0005759 | mitochondrial matrix | 432 | 183 | −0.428 | −2.230 | <0.0001 |
| GO:0043209 | myelin sheath | 152 | 75 | −0.473 | −2.179 | <0.0001 |
| Positively weighted (less expressed) genes | ||||||
| GO:0044815 | DNA packaging complex | 52 | 34 | 0.598 | 2.416 | <0.0001 |
| GO:0032993 | protein-DNA complex | 129 | 46 | 0.400 | 1.911 | 0.012 |
| GO:0032039 | integrator complex | 17 | 6 | 0.611 | 1.900 | 0.009 |
| GO:0000790 | nuclear chromatin | 297 | 111 | 0.320 | 1.704 | 0.043 |
| GO:0017053 | transcriptional repressor complex | 78 | 27 | 0.384 | 1.693 | 0.037 |
| GO:0005790 | smooth endoplasmic reticulum | 31 | 16 | 0.445 | 1.602 | 0.068 |
| GO:0044450 | microtubule organizing center part | 155 | 38 | 0.325 | 1.588 | 0.064 |
| GO:0016605 | PML body | 91 | 20 | 0.335 | 1.514 | 0.079 |
| GO:0005697 | telomerase holoenzyme complex | 19 | 9 | 0.477 | 1.502 | 0.079 |
| GO:0045178 | basal part of cell | 41 | 19 | 0.395 | 1.501 | 0.073 |
The top 10 cellular component terms enriched in the genes predicting cortical thickness changes in iRBD are reported ranked based on the normalized enrichment score. Bold values represent the terms significantly enriched after applying FDR correction. GO = Gene Ontology; PML = promyelocytic leukaemia.
Human disease gene terms enriched in the genes predicting cortical thinning in iRBD
| Term | Description | Gene set size | Number of leading edge IDs | Enrichment score | Normalized enrichment score | FDR P-value |
|---|---|---|---|---|---|---|
| Negatively weighted (more expressed) genes | ||||||
| DisGeNET | ||||||
| C0001125 | acidosis, lactic | 87 | 48 | −0.606 | −2.586 | <0.0001 |
| C0347959 | lactic acidemia | 85 | 47 | −0.602 | −2.550 | <0.0001 |
| C1167918 | CSF lactate increased | 33 | 22 | −0.690 | −2.410 | <0.0001 |
| C0006114 | cerebral oedema | 23 | 15 | −0.702 | −2.230 | <0.001 |
| C0023264 | Leigh disease | 33 | 21 | −0.629 | −2.216 | <0.001 |
| C0424551 | impaired exercise tolerance | 42 | 22 | −0.599 | −2.211 | <0.001 |
| C1836440 | increased serum lactate | 52 | 27 | −0.571 | −2.178 | 0.001 |
| C4021546 | abnormal mitochondria in muscle tissue | 17 | 12 | −0.751 | −2.177 | 0.001 |
| C1145670 | respiratory failure | 73 | 40 | −0.528 | −2.149 | 0.002 |
| C1855020 | acute necrotizing encephalopathy | 14 | 11 | −0.771 | −2.126 | 0.003 |
| OMIM | ||||||
| 252010 | mitochondrial complex I deficiency | 20 | 15 | −0.640 | −2.019 | <0.001 |
| PharmGKB | ||||||
| PA447172 | mitochondrial diseases | 349 | 161 | −0.464 | −2.352 | <0.0001 |
| PA166048819 | acidosis, respiratory | 78 | 49 | −0.552 | −2.300 | <0.0001 |
| PA443242 | acidosis | 117 | 66 | −0.514 | −2.281 | <0.0001 |
| PA445837 | thiamine deficiency | 54 | 25 | −0.570 | −2.201 | 0.001 |
| PA165108683 | pyruvate dehydrogenase complex deficiency | 26 | 12 | −0.657 | −2.197 | <0.001 |
| PA443243 | acidosis, lactic | 64 | 24 | −0.544 | −2.196 | <0.001 |
| PA447190 | cytochrome-c oxidase deficiency | 55 | 30 | −0.555 | −2.168 | 0.002 |
| PA446467 | mitochondrial encephalomyopathies | 48 | 24 | −0.572 | −2.146 | 0.002 |
| PA165857066 | anemia, hemolytic, congenital nonspherocytic | 10 | 7 | −0.820 | −2.082 | 0.006 |
| PA165108373 | biotinidase deficiency | 44 | 22 | −0.558 | −2.077 | 0.006 |
The human disease terms enriched in the genes predicting cortical thinning in iRBD using the DisGeNET, OMIM, and PharmGKB knowledge bases. Terms are reported ranked based on the normalized enrichment score. Only terms enriched after applying FDR correction are shown.
In contrast, the genes less strongly expressed in association with greater cortical thinning (positively weighted genes) were enriched for DNA strand elongation (normalized enrichment score: 2.08, PFDR = 0.015) (Fig. 2A and Table 2) and localized to nuclear-related cellular components, namely the DNA packaging complex (2.42, PFDR < 0.0001), protein-DNA complex (1.91, PFDR = 0.012), integrator complex (1.90, PFDR = 0.009), nuclear chromatin (1.70, PFDR = 0.043), and transcriptional repressor complex (1.69, PFDR = 0.037) (Table 3). No human disease gene terms were significantly enriched for these genes.
To test the robustness of our findings, we repeated the analyses using the GOrilla platform. This revealed similar results (Supplementary Tables1 and 2). When extracting gene expression from different subsets of post-mortem brains, namely from the oldest brains, the older brains, and using a leave-one-out procedure, we found that the negatively weighted genes predicting cortical thinning in iRBD were all enriched for the same biological processes as in the main GSEA analyses (Fig. 2C), suggesting that the enrichment pattern associated with atrophy in iRBD is robust to variations in post-mortem brain age. Finally, we explored whether the gene expression extracted from the right hemisphere (two of the six brains) predicted cortical thickness changes in the right hemisphere of iRBD patients. We identified one component that predicted significantly more variance in cortical thickness changes than null models that preserved spatial autocorrelation between brain regions (Pspatial = 0.028), explaining 37.7% of the variance in cortical changes. However, in contrast to the left hemisphere, the genes associated with right hemisphere cortical thinning on this component were not enriched for any specific biological process.
Using single-cell messenger RNA sequencing data from post-mortem human brain samples,45 virtual histology showed that the pattern of cortical thickness W-scores in iRBD patients did not associate significantly with the gene expression of any of the seven cell types investigated (Supplementary Fig. 2 and Supplementary Table 3).
The connectome constrains cortical changes in iRBD
A diverse collection of clinical, experimental, and computational studies support that alpha-synuclein pathology behaves in a prion-like fashion,10,12,13,82-84 including in iRBD.15 Here, we used a structural and functional neighbourhood analysis to investigate whether the patterns of cortical thinning in iRBD were constrained by the connectome. We tested whether the thickness W-score of each region was dependent on the average thickness W-scores of its connected neighbours. We found that the greater the cortical thinning in a region in iRBD, the greater the thinning in the neighbourhood of regions sharing a structural (r = 0.55, Pspatial = 0.013, Prandom < 0.001) or a functional connection (r = 0.52, Pspatial = 0.011, Prandom < 0.001) (Fig. 3). In contrast, the change in local thickness was negatively related with the change in thickness observed in structurally non-connected regions (r = −0.67, Pspatial = 0.006, Prandom < 0.001) but not significantly related with the change in thickness observed in functionally non-connected regions (r = −0.35, Pspatial = 0.084, Prandom = 0.004) (Fig. 3). Taken together, these results support the idea that connectivity constrains thickness changes in iRBD.

The connectome constrains cortical thinning in iRBD. Brain renderings showing the associations between the deviation in cortical thickness W-scores in iRBD and (A) structural and (B) functional connectivity. The edge thickness on the brain plots represents the interregional connection strength, whereas the node size and colour represent the local deviation in the W-score in iRBD compared to controls (i.e. the larger and redder, the greater the change in thickness). The scatterplots show the associations, for connected regions and non-connected regions, between the deviations in W-scores and the average W-scores observed in structural or functional neighbours. The violin plots show the empirical correlation against sets of 10 000 correlations generated from spatial and random null models. The asterisk indicates associations that were significant against null models.
Cortical thinning in iRBD is associated with dopamine transporter density
We next sought to determine whether the pattern of cortical changes in iRBD associated with specific neurotransmitter systems. First, we tested the relationships between the cortical thickness W-scores and the regional tracer density values of 18 receptors, transporters, and receptor binding sites associated with dopamine, serotonin, noradrenaline, acetylcholine, GABA, glutamate, histamine, cannabinoids, and opioids.46 Regions that showed cortical thinning in iRBD had a lower density of DAT (r = 0.51, Pspatial = 0.0008, Prandom < 0.0001), 5-HTT (r = 0.51, Pspatial = 0.003, Prandom < 0.0001) and D1 (r = 0.39, Pspatial = 0.014, Prandom = 0.0003), and a higher density of NET (r = -0.36, Pspatial = 0.041, Prandom = 0.002) (Fig. 4A); however, only the DAT association was significant after Bonferroni correction.
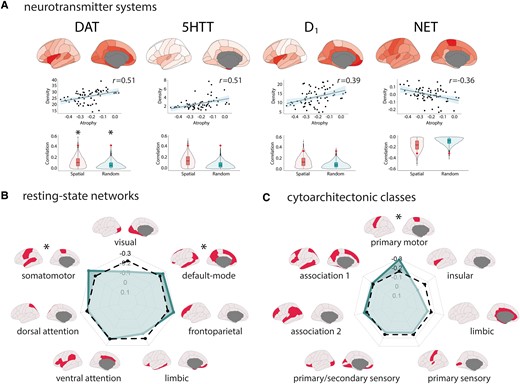
Cortical thinning in iRBD map onto specific regional tracer density, resting-state networks, and cytoarchitectonic classes. (A) Brain renderings and scatterplots showing the tracer density maps of the receptors, transporters, and binding sites associated with cortical thickness W-scores in iRBD. The violin plots show the empirical correlations tested against distributions of correlations from sets of spatial and random null models. The asterisk indicates the significant associations after Bonferroni correction. Radar charts showing the correlation between cortical thickness W-scores in iRBD and (B) resting-state networks and (C) cytoarchitectonic classes. The regular line represents the empirical correlations, and the dashed line represents the average correlation observed in sets of 10 000 spatial null models. The asterisk indicates the networks and classes where the observed spatial correlation was significantly different from the null correlation.
Cortical thinning in iRBD maps onto the motor system
We next investigated whether the patterns of cortical thickness W-scores in iRBD mapped onto specific resting-state networks, cytoarchitectonic classes, and functional correlates of cognition. In terms of resting-state networks, we found that cortical thinning in iRBD was more pronounced in the somatomotor (average atrophy: −0.32, Pspatial = 0.017, Prandom = 0.001) and default-mode networks (−0.27, Pspatial = 0.033, Prandom = 0.036) (Fig. 4B). The correspondence with cytoarchitectonic classes revealed that cortical thinning in iRBD was more pronounced in the primary motor cortex (−0.39, Pspatial = 0.006, Prandom = 0.0009) (Fig. 4C). The correspondence between cortical thickness changes and the spatial correlates of cognitive processes also revealed a greater cortical thinning In regions more activated during tasks related to planning (r = −0.48, Pspatial = 0.010, Prandom < 0.0001) and action (r = −0.45, Pspatial = 0.026, Prandom < 0.0001) (Supplementary Fig. 3).
Cortical thinning and surface area have distinct underlying patterns
Most large-scale studies of human cortical morphometry find that cortical thickness and surface area measured by MRI are dissociable and independent.85-87 To investigate whether the gene and spatial patterns were specific to cortical thinning, we applied the same analyses to cortical surface area W-scores in iRBD. For the gene expression analyses, PLS regression identified one component that explained significantly more variance in cortical surface area W-scores than null models (random null: 42.7% versus 23.4%, Prandom = 0.015; spatial null: 42.7% versus 26.3%, Pspatial = 0.036) (Supplementary Fig. 1). Positively weighted genes on the component were more expressed in association with greater surface area, whereas negatively weighed genes were less expressed in association with greater surface area (Supplementary Fig. 1). The positively weighted genes were enriched for processes involved in the inflammatory response and metal detoxification, whereas the negatively weighted genes were not significantly enriched for any biological process or cellular component gene term (Supplementary Fig. 4 and Supplementary Table 4). These enrichment patterns were similar for both gene enrichment platforms (Supplementary Tables 1 and 2). When applying virtual histology, in contrast to cortical thickness, we found that greater regional cortical surface area occurred in regions with a greater expression of genes specific to astrocytes (r = 0.61, Pspatial = 0.0011, Prandom = 0.0001), microglia (r = 0.52, Pspatial = 0.0053, Prandom = 0.001), and oligodendrocyte precursor cells (r = 0.53, Pspatial = 0.0049, Prandom = 0.0007) (Supplementary Fig. 2 and Supplementary Table 5).
For the connectivity and spatial mapping analyses, the structural and functional neighbourhood analysis showed that the regional cortical surface area W-scores in iRBD were also positively associated with the change in surface area in the regions sharing a structural (r = 0.22, Pspatial = 0.054, Prandom = 0.012) or functional connection (r = 0.27, Pspatial = 0.021, Prandom = 0.012) (Supplementary Fig. 5), supporting that the connectome also constrains the surface area changes in iRBD but to a lesser degree. We also found that greater cortical surface area in iRBD was related to a lower density of GABAA/BZ, 5-HT6, NET, 5-HT1B and M1, and to a higher density of 5-HT1A and 5-HT4 (Supplementary Fig. 6); however, only GABAA/BZ remained significant after multiple comparison correction. Finally, we found that cortical surface area was decreased in the visual resting-state network and increased in the limbic resting-state network (Supplementary Fig. 7). Cytoarchitectonically, cortical surface area was decreased in the primary and secondary sensory areas and increased in the limbic areas (Supplementary Fig. 7). Decreased cortical surface area in iRBD associated with regions more activated during tasks related to gaze and fixation (Supplementary Fig. 3). Collectively, this demonstrates that cortical thinning in iRBD is associated with gene expression and spatial mapping patterns that are different from those underlying changes in cortical surface area.
Genetic and connectivity patterns are specific to synucleinopathies
Next, to understand whether the patterns associated with cortical changes were specific to synucleinopathies or shared with other neurodegenerative diseases, we repeated the same analyses and investigated the genetic and connectivity underpinnings of cortical thickness changes in a sample of 78 T1-weighted MRI scans from patients with Alzheimer’s disease from the Alzheimer’s Disease Neuroimaging Initiative database [age: 66.0 ± 4.9 years, 38/78 (49%) men, education: 15.0 ± 3.2 years, Montreal Cognitive Assessment: 23.4 ± 2.0, 37/78 (47%) APOE ε4 heterozygous carriers, 13/78 (17%) APOE ε4 homozygous carriers].78,79
For cortical thickness, in line with what is expected from Alzheimer’s disease,88,89 we found that the regions that had the lowest W-scores (i.e. greater cortical thinning) were the entorhinal cortex (W-score = −0.18), medial orbitofrontal cortex (−0.13), insula (−0.12), and temporal pole (−0.10) (Supplementary Fig. 8). PLS regression revealed one component of gene expression that explained 49.9% of the variance in cortical thickness changes in Alzheimer’s disease (Pspatial = 0.0083, Prandom = 0.0028): the genes more strongly expressed in association with cortical thinning in Alzheimer’s disease were enriched for four biological processes: the protein-containing complex remodelling (PFDR = 0.0013), with APOE being the gene with the largest bootstrap ratio inside this set (−7.7), the localization of proteins to the endoplasmic reticulum (PFDR = 0.0019), RNA capping (PFDR = 0.0064), and the regulation of cyclase activity (PFDR = 0.033) (Supplementary Table 6 and Supplementary Fig. 8). These enriched terms are all different from those identified in iRBD (Fig. 1C). In terms of cellular components, the gene patterns enriched in association with cortical thinning localized to the GTPase complex (PFDR = 0.024), the glial cell projection (PFDR = 0.028), the cytosolic part (PFDR = 0.027), the pigment granule (PFDR = 0.038), and the ribosome (PFDR = 0.039) (Supplementary Table 6). There were no human disease gene terms significantly associated with changes in cortical thickness in Alzheimer’s disease.
For the spatial mapping analyses, in contrast to iRBD, greater cortical thinning was found in regions with a greater density of 5-HT1A (r = −0.69, Pspatial = 0.0003), D2 (r = −0.63, Pspatial < 0.0001), and μ opioid receptor (r = −0.58, Pspatial = 0.0003) (Supplementary Fig. 9). Cortical thinning in Alzheimer’s disease appeared more prominent in the limbic resting-state network (average atrophy = −0.06, Pspatial = 0.027) and cytoarchitectonically in the insular (average atrophy = −0.12, Pspatial = 0.015) and limbic areas (average atrophy = −0.06, Pspatial = 0.039) (Supplementary Fig. 9). The correspondence between cortical thickness changes and the spatial correlates of cognitive processes revealed a greater cortical thinning in regions involved in semantic memory (r = −0.49, Pspatial < 0.0001), memory retrieval (r = −0.46, Pspatial < 0.0001), valence (r = −0.46, Pspatial = 0.0001), emotion (r = −0.44, Pspatial = 0.0002), thought (r = −0.43, Pspatial = 0.0003), and recall (r = −0.43, Pspatial = 0.0003).
Taken together, these results show that the genetic and connectivity patterns underlying cortical thickness changes in iRBD differ from those associated with Alzheimer’s disease, supporting that the patterns identified in iRBD are specific to synucleinopathies.
Discussion
Patients with iRBD demonstrate brain atrophy even prior to the development of motor and cognitive features associated with synucleinopathy.4-6,8,9,15,90,91 Brain atrophy in iRBD is associated with motor and cognitive features, predicts conversion towards dementia, and appears to reflect the spread of abnormal alpha-synuclein isoforms in the brain.5,6,8,9,15,92 To better understand the pathophysiology of iRBD, we used an imaging transcriptomics approach with comprehensive spatial mapping to investigate the gene correlates and the spatial patterning of cortical thinning in iRBD. We found that cortical thinning is associated with mitochondrial function and macroautophagy and that the pattern of thinning is constrained by the structural and functional architecture of the connectome. We further demonstrated that the pattern of thinning maps onto specific brain systems related to motor and planning functions. We also showed that these gene and spatial mapping patterns were specific to cortical atrophy in iRBD in that cortical surface area changes in the same patients related to different genes and brain networks. Moreover, we showed that the gene and spatial mapping patterns in iRBD differed from those seen in Alzheimer’s disease, supporting the idea that our patterns were specific to iRBD and not shared across the neurodegenerative spectrum. Altogether, this study provides insight into the processes underlying the development of cortical atrophy in synucleinopathies.
Several pathogenic events associate with the development and progression of synucleinopathies including mitochondrial dysfunction, abnormal protein degradation, and inflammation.93,94 In this study, we found that cortical thinning in iRBD was increased in regions with a greater expression of genes involved in mitochondrial functioning, particularly in the NADH dehydrogenase complex (or complex I). Complex I deficiency in the substantia nigra is a hallmark of Parkinson’s disease95 and is found in the brain and peripheral tissues of Parkinson’s disease patients.96-98 In the present study, the genes that were the most robustly associated with cortical thinning in iRBD were also enriched for macroautophagy, a major autophagic pathway that engulfs material to be degraded into autophagosomes before fusing with lysosomes for degradation.99 A previous study in Parkinson’s disease that used imaging transcriptomics to assess the gene expression correlates of brain atrophy progression over 4 years found that the regions with the greatest atrophy progression were enriched for genes involved in synaptic transmission and cell signalling.18 This supports the sequence of events by which pathologic alpha-synuclein first interferes with mitochondrial functioning, then leads to synaptic dysfunction,100-102 and eventually manifests as cortical thinning in patients, including during the prodromal period.
We also found that the pattern of cortical thinning in iRBD followed the constraints imposed by the brain’s structural and functional architecture. According to the prion-like spread hypothesis, alpha-synuclein pathology propagates between cells and imposes its abnormal template onto native alpha-synuclein proteins, amplifying the pathological process.47 We recently provided evidence in favour of this hypothesis using a computational spreading model of alpha-synuclein (agent-based Susceptible-Infected-Removed model),13 showing that the distribution of alpha-synuclein pathology quantified in mice injected with preformed fibrils could be recreated based on connectivity and gene expression.14 Importantly, the agent-based Susceptible-Infected-Removed model was also able to recreate the atrophy patterns observed in iRBD and Parkinson’s disease, supporting the prion-like spread model in synucleinopathies.13,15,16 The constraining effect of both the structural and functional connectome on atrophy in iRBD is in line with this. A logical corollary of this spreading hypothesis is that if alpha-synuclein pathology spreads via connections and that connectivity constrains the atrophy in iRBD, then it is expected that the atrophy in iRBD maps onto specific brain systems and associated intrinsic networks. This is what we observed: the pattern of cortical thinning in iRBD was significantly more pronounced in the motor and default-mode networks, whereas the pattern of cortical surface area changes in iRBD was more pronounced in limbic and visual networks. These network findings are in line with the spatial patterning of atrophy progression reported in Parkinson’s disease over 2 years,18 anchoring further our atrophy pattern within the prodromal spectrum of synucleinopathies.
In this study, a W-scored parcellated map of cortical changes in iRBD was used to unveil the gene expression and spatial mapping underpinnings of atrophy in iRBD. This parcellated map was generally convergent with the vertex-based map of cortical thickness differences between iRBD patients and controls (Fig. 1A) but also showed some discrepancies. Whereas the lateral brain changes were found on both maps (given the resolution difference between the two maps), the medial changes, particularly in the medial frontal cortex, were not found on both maps. This may be explained by the fact that the two plots differed in the method of thickness estimation and in the parcellation used. The vertex-based map (Fig. 1A) was derived from an analysis performed at each vertex of the cortical sheet and showed the thresholded clusters where cortical thickness was significantly decreased in iRBD compared to controls after controlling for age, sex, and centre and correcting for multiple comparisons. The parcellated map (Fig. 1D) represented the pattern of how much the average cortical thickness in every region deviated from the expected average thickness values in controls when controlling for the effects of age, sex, and centre. One interpretation for the apparent discrepancy in the medial frontal cortex may be that the thickness changes occur irregularly throughout this quite large region: the agglomeration of all the thickness values over the region may have revealed an average pattern of thinning that was not seen when performing local analysis with thresholded clustering. In other words, the smoothing extent of vertex-based analyses is always by definition much smaller than the one implicit to parcellation analyses.
In this study, we found that the atrophy patterns in the left and right hemispheres of the brain were linked to different patterns of gene expression. The atrophy in the left hemisphere was associated with the expression of genes involved in energy production and waste removal, while the atrophy in the right hemisphere was not significantly associated with any specific biological processes (despite being significantly predicted by regional gene expression). One interpretation for this observation is that the gene expression data from the right hemisphere, which came from only two of the six post-mortem brains, were unreliable. Another possibility is that there is a lateralized effect of gene expression in the brain whereby brain changes appear in one hemisphere in regions with higher expression of genes involved in mitochondrial function and then manifest in the opposite hemisphere through other prion-like mechanisms such as connectivity to the disease epicentre. Also, importantly, the absence of enrichment for any specific biological processes among the genes associated with atrophy in the right hemisphere does not necessarily mean that these genes do not play a role in the selective vulnerability of some brain regions. It simply means that the genes do not cluster around a specific function. Further research is needed to understand the lateralized brain changes and their underlying causes in iRBD.
Our findings also revealed the presence of a dichotomy in the underlying genetic and connectomics bases of cortical thinning and cortical surface area changes in iRBD. Unlike cortical thickness where thinning is generally the event expected from aging and neurodegeneration,103 surface area was increased in certain areas compared to healthy individuals,15 as previously found in a population-based MRI study of healthy adults showing that a higher genetic risk of Parkinson’s disease is associated with greater cortical surface area.104 In our study, greater cortical surface area was associated with a greater expression of genes involved in the inflammatory response. Similarly, virtual histology revealed that increased surface area related to genes associated with astrocytes and microglia. This supports the link between inflammation and synucleinopathies, particularly in the prodromal stages,93 where the activation of toxic microglia may lead to the production of proinflammatory cytokines, which in turn produce cellular damage and cell death. In addition, we found that greater surface area occurred in regions with greater expression of genes involved in metal detoxification. This is in line with a study that used quantitative susceptibility mapping and imaging transcriptomics and identified that the regions showing the greatest iron deposition in Parkinson’s disease were those with a greater expression of genes involved in metal detoxification.21
That distinct gene expression and spatial mapping patterns get reflected in the thickness and surface area changes in iRBD is not surprising given that thickness and surface area relate to distinct genetic determinants and developmental trajectories.85,86 According to the radial unit hypothesis, cortical thickness corresponds to the number of cells inside cortical columns, whereas cortical surface area corresponds to the number of ontogenetic columns that populate perpendicularly the cortex.105 In addition, cortical surface area is subject to tangential expansion due to cellular processes such as synaptogenesis, gliogenesis, and myelination that occur over a longer period than the processes involved in cortical thickness.106 Cortical thickness and surface area are differentially affected in Parkinson’s disease and iRBD and in healthy adults with a higher risk of Parkinson’s disease,15,104,107 but the biological explanation for this remains unclear. Based on the current study, it can be hypothesized that unlike thickness, the surface area changes, which related to inflammation, astrocytes, and microglia, may not necessarily relate to the pathological effects occurring locally. Indeed, microglia and astrocytes are proliferating and circulating cells that can take up alpha-synuclein from the extracellular space, migrate over long distances in the brain, and seed pathology in remote regions.108 This is supported by our neighbourhood analysis showing that although the connectome exerted a constraining effect on both surface area and thickness, it explained 27–30% of the variance in thickness but only 5–7% of the variance in surface area. In line with that, whereas a computational spreading model of alpha-synuclein pathology based on gene expression and connectivity was previously shown to recreate cortical thickness changes in iRBD, it could not recreate cortical surface area changes,15 suggesting that other selective vulnerability or propagation factors explain these changes. As revealed by our spatial mapping analyses, one of these may be the regional density of GABA: greater surface area in iRBD mapped onto regions with lower GABAA/BZ receptor density. In addition to its neurotransmission role, GABA modulates inflammation by regulating the proliferation of immune cells and by decreasing the secretion of cytokines.109,110 It may therefore be that changes in cortical surface area occur in regions where there is less potential for GABA to exert its immunomodulatory effects. Although more studies are needed to understand the relationship between surface area and inflammation in the brain of prodromal patients, it nonetheless demonstrates how an approach combining structural MRI, imaging transcriptomics, and comprehensive spatial mapping can be used to generate hypotheses on disease mechanisms in the prodromal phase.
This study has some limitations. First, the gene expression data from the Allen Human Brain Atlas were extracted from post-mortem brains of people aged between 24–57 years with different medical histories, causes of death, and post-mortem intervals.34,36 Gene expression data were also unavailable for the right hemisphere in four of the six post-mortem brains.34 Future studies should investigate more closely the gene expression predictors of atrophy from brain-wide transcriptomics data extracted from post-mortem brains that were age-matched with iRBD patients and controls. However, despite this limitation, we demonstrated that the gene expression pattern predicting thinning in iRBD was robust to variations in the selection of post-mortem brains. Similarly, the different brain maps used for the comprehensive spatial mapping analyses were derived from participants who were not age-matched to the iRBD patients and controls. Future studies should repeat the same analyses using spatial maps derived from large cohorts of older participants without ongoing neurodegenerative mechanism, once these become available in the literature. Second, the participants who did not pass quality control after cortical surface processing were older (iRBD: 70.5 ± 7.3 years, controls: 68.9 ± 9.3 years) than the participants who passed quality control (iRBD: 67.0 ± 6.3, controls: 66.2 ± 7.6 years, P = 0.007 in iRBD, P = 0.08 in controls). Given that the quality control in both groups failed more in older people, this is unlikely to affect the findings as the MRIs are used to map the distribution of atrophy of patients versus controls. In addition, stringent quality control is important because they actually increase trust in findings. To minimize the risks of sampling bias, future studies should however perform more manual edits of processed cortical surfaces instead of only excluding surfaces based on visual inspection. Third, the brain atrophy measurements used in this work were derived from T1-weighted images. Post-mortem brain examinations in Parkinson’s disease have shown that alpha-synuclein pathology may present first in the axonal processes before being found in cell bodies,111 suggesting that assessment of metrics from the white matter may reveal additional information about the dynamics of atrophy occurring in the prodromal phase. Fourth, the interpretation of findings in this study was limited to patients with a synucleinopathy in the prodromal phase. Future studies should apply a similar processing and analytical framework to Parkinson’s disease and dementia with Lewy bodies to improve the comparability of findings between the prodromal and manifest phases of synucleinopathies. Fifth, only a few iRBD patients have to date converted to a manifest synucleinopathy. Once the conversion rate becomes higher, it will be possible to study the atrophy patterns between conversion phenotypes.
In sum, the present study shows that mitochondrial and macroautophagy dysfunction underlie the cortical thinning occurring in iRBD and that cortical thinning maps onto specific networks in the brain.
Acknowledgements
S.R. reports a scholarship from the Canadian Institutes of Health Research. J.-F.G. holds a Canada Research Chair in Cognitive Decline in Pathological Aging. Z.G.-O. is supported by the Fonds de recherche du Québec–Santé Chercheur-Boursier award and is a William Dawson Scholar. A.D. is supported by the Canadian Institutes of Health Research and the Healthy Brains for Healthy Lives program of the Canada First Research Excellence Fund.
Data used in the preparation of this article were partly obtained from the Parkinson’s Progression Markers Initiative (PPMI) database (www.ppmi-info.org/access-data-specimens/download-data). For up-to-date information on the study, visit www.ppmi-info.org. The PPMI—a public-private partnership—is funded by the Michael J. Fox Foundation for Parkinson’s Research and funding partners, including 4D Pharma, AbbVie Inc., AcureX Therapeutics, Allergan, Amathus Therapeutics, Aligning Science Across Parkinson’s (ASAP), Avid Radiopharmaceuticals, Bial Biotech, Biogen, BioLegend, Bristol Myers Squibb, Calico Life Sciences LLC, Celgene Corporation, DaCapo Brainscience, Denali Therapeutics, The Edmond J. Safra Foundation, Eli Lilly and Company, GE Healthcare, GlaxoSmithKline, Golub Capital, Handl Therapeutics, Insitro, Janssen Pharmaceuticals, Lundbeck, Merck & Co., Inc., Meso Scale Diagnostics, LLC, Neurocrine Biosciences, Pfizer Inc., Piramal Imaging, Prevail Therapeutics, F. Hoffman-La Roche Ltd and its affiliated company Genentech Inc., Sanofi Genzyme, Servier, Takeda Pharmaceutical Company, Teva Neuroscience, Inc., UCB, Vanqua Bio, Verily Life Sciences, Voyager Therapeutics, Inc., and Yumanity Therapeutics, Inc.
For the Alzheimer’s disease data, data collection and sharing was funded by the Alzheimer's Disease Neuroimaging Initiative (ADNI) (National Institutes of Health Grant U01 AG024904) and DOD ADNI (Department of Defense award number W81XWH-12–2–0012). ADNI is funded by the National Institute on Aging, the National Institute of Biomedical Imaging and Bioengineering, and through generous contributions from the following: AbbVie, Alzheimer’s Association; Alzheimer’s Drug Discovery Foundation; Araclon Biotech; BioClinica, Inc.; Biogen; Bristol-Myers Squibb Company; CereSpir, Inc.; Cogstate; Eisai Inc.; Elan Pharmaceuticals, Inc.; Eli Lilly and Company; EuroImmun; F. Hoffmann-La Roche Ltd and its affiliated company Genentech, Inc.; Fujirebio; GE Healthcare; IXICO Ltd.; Janssen Alzheimer Immunotherapy Research & Development, LLC.; Johnson & Johnson Pharmaceutical Research & Development LLC.; Lumosity; Lundbeck; Merck & Co., Inc.; Meso Scale Diagnostics, LLC.; NeuroRx Research; Neurotrack Technologies; Novartis Pharmaceuticals Corporation; Pfizer Inc.; Piramal Imaging; Servier; Takeda Pharmaceutical Company; and Transition Therapeutics. The Canadian Institutes of Health Research is providing funds to support ADNI clinical sites in Canada. Private sector contributions are facilitated by the Foundation for the National Institutes of Health (www.fnih.org). The grantee organization is the Northern California Institute for Research and Education, and the study is coordinated by the Alzheimer’s Therapeutic Research Institute at the University of Southern California. ADNI data are disseminated by the Laboratory for Neuro Imaging at the University of Southern California.
A portion of the data used in preparation of this article were obtained from the Alzheimer’s Disease Neuroimaging Initiative (ADNI) database (adni.loni.usc.edu). As such, the investigators within the ADNI contributed to the design and implementation of ADNI and/or provided data but did not participate in analysis or writing of this report. A complete listing of ADNI investigators can be found at: https://adni.loni.usc.edu/wp-content/uploads/how_to_apply/ADNI_Acknowledgement_List.pdf
Funding
The work performed in Paris was funded by grants from the Programme d’investissements d’avenir (ANR-10-IAIHU-06), the Paris Institute of Neurosciences—IHU (IAIHU-06), the Agence Nationale de la Recherche (ANR-11-INBS-0006), Électricité de France (Fondation d’Entreprise EDF), Biogen Inc., the Fondation Thérèse et René Planiol, the Fonds Saint-Michel; by unrestricted support for research on Parkinson’s disease from Energipole (M.M.) and Société Française de Médecine Esthétique (M.L.); and by a grant from the Institut de France to I.A. (for the Alice Study).
The work performed in Montreal was supported by the Canadian Institutes of Health Research, the Fonds de recherche du Québec–Santé, and the W. Garfield Weston Foundation. J.-F.G. reports grants from the Fonds de recherche du Québec—Santé, the Canadian Institutes of Health Research, the W. Garfield Weston Foundation, the Michael J. Fox Foundation for Parkinson’s Research, and the National Institutes of Health. R.B.P. reports grants and personal fees from the Fonds de recherche du Québec–Santé, the Canadian Institutes of Health Research, the Parkinson Society of Canada, the W. Garfield Weston Foundation, the Michael J. Fox Foundation for Parkinson’s Research, the R. Howard Webster Foundation, and the National Institutes of Health. Z.G.-O. reports funding from the Michael J. Fox Foundation, Canadian Consortium for Neurodegeneration in Aging, Fonds de recherche du Québec–Santé, and ‘Healthy Brains, Healthy Lives’ initiative. This work was also funded by awards from the Canadian Institutes of Health Research Foundation Scheme and the ‘Healthy Brain, Healthy Lives’ initiative to A.D.
The work performed in Sydney was supported by a Dementia Team Research Grant from the National Health and Medical Research Council (#1095127). S.L. is supported by a Leadership Fellowship from the National Health and Medical Research Council (#1195830). E.M. reports funding from the National Health and Medical Research Council (#2008565). K.E.M. reports funding from Parkinson Canada, Parkinson’s Movement Disorder Foundation, University of Waterloo International Research Partnership grant, and Natural Sciences and Engineering Research Council of Canada.
The work performed in Aarhus was supported by funding from the Lundbeck Foundation, Parkinsonforeningen (The Danish Parkinson Association), and the Jascha Foundation.
Competing interests
None of the authors report any competing interests related to the current work.
Supplementary material
Supplementary material is available at Brain online.
Appendix 1
Contributors involved in the ICEBERG study group
Steering committee: Marie Vidailhet, Jean-Christophe Corvol, Isabelle Arnulf, Stéphane Lehéricy.
Clinical data: Marie Vidailhet, Graziella Mangone, Jean-Christophe Corvol, Isabelle Arnulf, Sara Sambin, Jonas Ihle, Caroline Weill, David Grabli, Florence Cormier-Dequaire, Louise Laure Mariani, Bertrand Degos.
Neuropsychological data: Richard Levy, Fanny Pineau, Julie Socha, Eve Benchetrit, Virginie Czernecki, Marie-Alexandrine Glachant.
Eye movement: Sophie Rivaud-Pechoux, Elodie Hainque.
Sleep assessment: Isabelle Arnulf, Smaranda Leu Semenescu, Pauline Dodet.
Genetic data: Jean-Christophe Corvol, Graziella Mangone, Samir Bekadar, Alexis Brice, Suzanne Lesage.
Metabolomics: Fanny Mochel, Farid Ichou, Vincent Perlbarg, Benoit Colsch, Arthur Tenenhaus.
Brain MRI data: Stéphane Lehéricy, Rahul Gaurav, Nadya Pyatigorskaya, Lydia Yahia-Cherif, Romain Valabrègue, Cécile Galléa.
DaTscan imaging data: Marie-Odile Habert.
Voice recording: Dijana Petrovska, Laetitia Jeancolas.
Study management: Vanessa Brochard, Alizé Chalançon, Carole Dongmo-Kenfack, Christelle Laganot, Valentine Maheo.
References
Author notes
Ziv Gan-Or and Alain Dagher contributed equally to this work.

