


Abstract
While frontotemporal dementia has been considered a neurodegenerative disease that starts in mid-life or later, it is now clearly established that cortical and subcortical volume loss is observed more than a decade prior to symptom onset and progresses with ageing. To test the hypothesis that genetic mutations causing frontotemporal dementia have neurodevelopmental consequences, we examined the youngest adults in the GENFI cohort of pre-symptomatic frontotemporal dementia mutation carriers who are between 19 and 30 years of age.
Structural brain differences and improved performance on some cognitive tests were found for MAPT and GRN mutation carriers relative to familial non-carriers, while smaller volumes were observed in C9orf72 repeat expansion carriers at a mean age of 26 years.
The detection of such early differences supports potential advantageous neurodevelopmental consequences of some frontotemporal dementia-causing genetic mutations. These results have implications for the design of therapeutic interventions for frontotemporal dementia. Future studies at younger ages are needed to identify specific early pathophysiologic or compensatory processes that occur during the neurodevelopmental period.
Introduction
Frontotemporal dementia (FTD) is a devastating progressive neurodegenerative disease that is highly heritable and currently incurable. Frontotemporal dementia is the second most common young-onset neurodegenerative dementia, most commonly diagnosed in individuals in their forties to sixties. However, symptoms can start decades before full clinical diagnostic criteria are met, with some individuals diagnosed as young as in their twenties.1 Nearly a decade ago, the first international cohort studies of patients with genetic FTD and their adult biological family members were launched, and these have enabled the detailed study of the pre-symptomatic window comparing at-risk FTD mutation carriers to their biologically related non-carriers. These studies have delineated the symptom onset and main features of the course of the most common genetic causes of FTD: MAPT, C9orf72 and GRN.2–4 Several symptoms and biomarkers that change as preclinical mutation carriers approach their age of expected onset have also been identified, including apathy,5 brain atrophy and connectivity6 and rising CSF NfL levels.7 Interestingly, several of these recent studies have observed group differences between pre-symptomatic mutation carriers versus non-carriers in brain structure even at the time of first assessment.8 While FTD has been considered a neurodegenerative disease that starts in mid-life or later, it is now clearly established that cortical and subcortical volume loss is observed more than a decade prior to symptom onset2,3 and progresses with ageing.9 These emergent findings raise a major question for the field of FTD: is genetic FTD a neurodevelopmental disorder?
Neurodevelopmental disorders refer to conditions that affect the development of the nervous system with manifestations in childhood. The brain is known to have a long and complex development and maturation period, extending up to the third decade of life.10 Several lines of research point in the direction of a possible neurodevelopmental effect of FTD-causing mutations. MAPT, C9orf72 and GRN genes all have high penetrance and are expressed in the prenatal period.11–15 While studies using knockout and transgenic mouse models to study GRN, MAPT and C9orf72 have typically normal or only subtle phenotypes in the neurodevelopmental period and early life stages, each of these three main genes associated with FTD have roles that are likely active during neurodevelopment including microtubule stabilization, neurite outgrowth and stabilization (MAPT),16,17 lysosomal function and regulation of inflammation (GRN, C9orf72).18–20 Moreover, there are scattered clues in the human literature pointing towards potential neurodevelopmental consequences. Higher rates of childhood dyslexia and other language related learning disabilities were observed in patients who develop primary progressive aphasias (the majority of which are language subtypes of FTD) and their first-degree relatives.21 In a small series of pre-symptomatic carriers of MAPT mutations, impairments in performance on frontal executive tasks were observed several decades before expected symptom onset, prompting the authors to raise a neurodevelopmental hypothesis for this form of genetic FTD.22 In pre-symptomatic MAPT mutation carriers, mesial temporal lobe atrophy was observed in 20% of participants in their thirties.23 In a family carrying a GRN mutation, abnormal white matter connectivity was detected in GRN presymptomatic mutation carriers whose average age was 37 years compared to non-carriers (mean age 43 years).24 Furthermore, increased prevalence of psychotic disorders, including typical age-of-onset schizophrenia (teens to twenties), has been reported in offspring of C9orf72 repeat expansion carriers.25
Clues from other neurodegenerative diseases further support the hypothesis that pathophysiologic changes in some mid and late-life neurodegenerative diseases may occur decades before the appearance of clinical symptoms and diagnosis and possibly during early brain development. In Huntington’s disease, another neurodegenerative disorder with mid-life symptom onset, the KIDS-HD and CHANGE-HD studies have identified multiple differences in brain structure in youth mutation carriers at 6 and 7 years of age, who have CAG repeat lengths predictive of adult-onset disease.25 Some of these effects are likely a direct result of the pathogenic effects of the mutation, including smaller intracranial volumes, while others which may represent compensatory changes, such as striatal hypertrophy and increased basal ganglia functional connectivity.26,27 Intriguing questions have been raised as to whether genetic mutations causing some mid-life onset disorders like Huntington’s disease or spinocerebellar ataxia persist not only because their deleterious effects occur after the age of reproduction, but also because they may confer early life advantages.28,29 This hypothesis is further supported by study of young carriers of the Huntington gene expansions who show enhanced cognitive performance30 and reduced anxiety and depression compared to familial non-carriers.31 Neurodevelopmental effects of the Huntington’s disease gene CAG repeat expansion have recently been confirmed during human embryonic brain development as early as 13 weeks gestation.32 These included mislocalized junctional complexes and the mutant protein huntingtin, abnormal neuroprogenitor cell polarity and differentiation and altered mitosis and cell cycle progression.32 This represents perhaps the strongest evidence to date of the neurodevelopmental effects of a hereditary adult-onset neurodegenerative disorder.
In the Genetic Frontotemporal Dementia Initiative (GENFI) cohort, in comparison to non-carriers from the same families, mutation carriers reported subtle changes in mood and behaviour at the time of the baseline assessments, independent of age.33 In the absence of paediatric research data on mutation carriers, we evaluated data from the youngest adult GENFI participants, those between the ages of 19 and 29 years, to explore whether changes in symptoms, cognition or brain structure may be present during neurodevelopment (up through the third decade of life). In this age range, we consider neurodegenerative changes to be unlikely to confound findings, as the mean expected time to disease onset is approximately 30 years, a time-frame well before the 2 years prior to phenotype conversion, when increases in biomarkers of neurodegeneration such as NfL are elevated in mutation carriers.7 The objectives of the present study were to determine whether young adults between the ages of 19 and 29 years who carry FTD causing gene mutations show differences compared with familial age-matched non-carriers in: (i) brain structure as measured by cortical and subcortical volumes and cortical thickness; and (ii) functional outcomes as indexed by behavioural and cognitive assessments.
Materials and methods
Participants
Young adults between the ages of 18 and 29 years inclusive who enrolled in the GENFI multi-centre cohort study were included. The GENFI consortium includes research centres across Europe and Canada (http://genfi.org.uk/) and enrolls adults with known pathogenic mutations in the GRN or MAPT genes or with a pathogenic expansion in the C9orf72 gene (greater than 30 repeats). The cohort is comprised of symptomatic mutation carriers, pre-symptomatic mutation carriers and non-mutation carriers from the same families. The majority (∼71%) of at-risk family members in the GENFI study were not aware of their genetic status at the time of the assessments. Baseline data from the presymptomatic young adults’ first GENFI assessments were included, including participant and informant clinical scales of behavioural and cognitive symptoms and MRI. Presymptomatic (unaffected) designation was made by the local GENFI site physicians based on participants considered not to be showing signs of FTD and not meeting consensus criteria for behavioural variant FTD, amyotrophic lateral sclerosis, nonfluent primary progressive aphasia, semantic variant primary progressive aphasia, corticobasal syndrome or other dementia. The data analysed below represent those available from GENFI data freeze #5 (2012–19). This includes participants from Phase 1 (GENFI1; 2012–15) and Phase 2 (GENFI2; 2015–19) of GENFI. Data are presented in ways to ensure continued blinding of participants’ genetic status. Mutation carriers were compared with non-carriers of the same gene group (e.g. MAPT mutation carriers versus non-carriers from MAPT mutation families) for all analyses to reduce potential confounds related to language and family differences.
Written informed consent was obtained from all participants. The study was approved by the local ethics committee for each of the GENFI sites.
Neuroimaging
Participants completed volumetric T1-weighted MRI acquired with the GENFI protocol with a 1.1-mm isotropic resolution on a 3 T scanner (Siemens Trio, Siemens Skyra, Siemens Prisma, Philips Achieva, GE Discovery MR750) or 1.5 T scanner (Siemens, GE). Preprocessing of volumetric MRI scans was performed as previously reported,34 including visual quality control checks, bias field correction and whole brain parcellated using the geodesic information flow algorithm.35 We combined regions of interest (ROIs) to calculate the volumes of the whole brain (total brain volume which includes all grey and white matter), lobes or regions (grey matter in frontal, temporal, parietal, occipital, cingulate and insula), subcortical structures including the amygdala, hippocampus, thalamus and basal ganglia (caudate + pallidum + putamen) as well as cerebellum36 and total CSF (ventricles and non-ventricular CSF). The cingulate and insula were included as specific regions, as they are known to be amongst the earliest regions affected in many forms of FTD.2,37 Left and right volumes were summed, and total intracranial volume (TIV), which includes all grey matter, white matter and CSF, was computed with SPM12 v6470 (Statistical Parametric Mapping, Wellcome Trust Centre for Neuroimaging, London, UK) running under MATLAB R2014b (MathWorks, Natick, MA, USA).38 T1-weighted MRI were also processed for vertex-wide cortical thickness analysis with Civet 2.1 (http://www.bic.mni.mcgill.ca/ServicesSoftware/CIVET-2-1-0-Introduction) through the Cbrain platform.39 All outputs were visually inspected for quality control.
Behavioural and cognitive measures
Symptoms
Clinicians completed the GENFI Symptom Scales with participants and their study informant to evaluate the presence of symptoms across the following five domains: behavioural, neuropsychiatric, cognitive, language, and motor. The presence and severity of each symptom was indicated using a five-point Likert scale (0 = absent, 0.5 = questionable/very mild, 1 = mild, 2 = moderate, 3 = severe). Symptom ratings of questionable/very mild, mild, moderate, severe were coded as ‘symptom endorsement’ and absent coded as ‘symptom absent’.
Cambridge Behavioural Inventory Questionnaire-Revised
For the Cambridge Behavioural Inventory Questionnaire-Revised (CBI-R),9 study informants used a 5-point Likert scale to indicate whether participants demonstrated symptoms in the following domains: memory and orientation, everyday skills, self-care, abnormal behaviour, mood, beliefs, eating habits, sleep, stereotypic and motor behaviours, and motivation. Symptom reports reflected endorsement 4 weeks prior to the assessment, with higher scores indicating greater frequency of symptoms.
GENFI Neuropsychology Battery
The GENFI Neuropsychology Battery, comprised of tests as previously reported,2 was administered to all participants. This included the following tests and indices: Digit Span Forward (maximum number of consecutive digits correctly produced), Digit Span Backward (maximum), Digit Symbol (from the Wechsler Adult Intelligence Scale), Boston Naming Test (30 item), Verbal Fluency (Animals), Verbal Fluency (Letter), Block Design (correct trials, timed), Free and Cued Selective Reminding Test (FCSRT), D-KEFS Color-Word Interference Task (CWIT: total ‘errors’ and ‘time’ to completion), Mini-Social Cognition and Emotion Assessment (MiniSEA) comprised of the Faux-pas Test and Facial Recognition Task, Benson Figure Copy, Recall, and Recognition, Logical Memory Tests (subset of Wechsler Memory Scale).
Statistical analysis
Neuroimaging
Analyses of covariance (ANCOVAs) examining interactions and main effects of genetic status (carrier versus non-carrier) × sex × scanner type (vendor, model and field strength), with age at time of scan and TIV as covariates were conducted on global and regional brain volumes. Given the sample sizes available, only main effects of genetic status significant after controlling for sex, scanner type, age and TIV are reported. Benjamini–Hochberg correction for multiple tests was used to control for multiple comparisons using P < 0.05 for the false discovery rate.41 For regions showing main effects of genetic status and genetic status × scanner type interactions, the potential impact of scanner specific effects was examined and the results qualified as detailed below. Additional sensitivity analyses including only patients with 3 T MRI scans were performed for all contrasts. Voxel-wise cortical thickness analyses were performed in SurfStat using general linear models, controlling for the effects of age, sex and scanner site. We tested for group contrasts (genetic carriers versus controls):
and for the age by genetic status interaction:
Analyses were performed separately for each genetic group and results were corrected with false discovery rate <0.05.
GENFI symptom scales
Owing to skewing of scores, as most symptoms were not endorsed by many participants, χ2 tests were used to examine mutation group level differences in each of the five symptom domains. Specifically, separate tests were used to detect differences in frequency of symptoms for each domain between carriers versus non-carriers for each of the three gene groups.
GENFI Neuropsychology Battery and Cambridge Behavioural Inventory-Revised
A series of one-way ANCOVAs with genetic status (carriers, non-carriers) as the independent variable, and age and sex as covariates, was used to detect differences between mutation carriers and non-carriers on neuropsychology measures common in GENFI 1 and GENFI 2. For variables unique to the GENFI 1 and GENFI 2 cohorts, separate GENFI 1 or GENFI 2 analyses were performed and are presented in Supplementary Table 1. Years of education was not included in the main analysis to avoid obscuration of potential neurodevelopmental effects on cognition that could also have affected scholastic achievement, but, where applicable, secondary sensitivity analyses were conducted with years of education as an additional covariate. The dependent measures included scores on Digit Span Forward, Digit Span Backward, Digit Symbol, Boston Naming Test, Verbal Fluency Animals, Verbal Fluency Letter, Block Design and CBI-R. The dependent variables unique to GENFI1 included immediate and delayed scores on the logical memory tests and for GENFI 2 included Benson Figure Recall, Benson Figure Recognition, FCSRT Free Recall, FCSRT Total, FCSRT Delayed Free Recall, CWIT Errors, CWIT Time and MiniSEA Total. Given the available sample sizes, only main effects of genetic status, after controlling for sex and age, are reported. Observations greater than ±3 standard deviations (SD) were deemed outliers. One outlier was detected on the Block Design measure and one on the verbal fluency task; removal of these outliers did not affect the statistical results.
Data availability
The raw data of this project is part of GENFI. De-identified participant data can be accessed on reasonable request to the corresponding author and [email protected].
Results
Participants
Ninety-two young adults in GENFI met the inclusion criteria for the study and were designated as presymptomatic (unaffected) by their local site physicians. The FTLD-CDR global rating was 0 for all but five who had ratings of 0.5, two of whom were mutation carriers and three non-carriers. MRI scans passing quality checks were available from 85 of the 92 young adult GENFI participants from data freeze 5 (Table 1). Fifty-two per cent were mutation carriers (41 non-carriers, 44 carriers). Amongst the mutation carriers, there were 17 C9orf72, nine MAPT and 16 GRN carriers. The mean age at time of participation was 25 years (range 19–29), and mean level of education was 14 years (range 8–18). All of these young adults were designated as unaffected/presymptomatic participants by the site physicians. There were no significant differences in age at time of scan or sex distribution comparing the mutation carriers versus non-carriers for each of the three gene groups. MAPT carriers had more years of education than the MAPT non-carriers [Mcarriers = 15.5 years (SD 1.5) Mnon-carriers 14.1 years (SD 1.7), P < 0.05].
MRI volumetric analysis of mutation carriers versus non-carriers
| Total | Carrier | Non-carrier | C9orf72 carriers | C9orf72 non- carriers | C9orf72 contrasts | MAPT carriers | MAPT non- carriers | MAPT contrasts | GRN carriers | GRN non-carriers | GRN contrasts | |
|---|---|---|---|---|---|---|---|---|---|---|---|---|
| n | 85 | 44 | 41 | 17 | 15 | − | 11 | 13 | − | 16 | 13 | − |
| Age (SD) | 25.7 (2.9) | 25.7 (3.2) | 25.8 (2.6) | 25.9 (3.3) | 25.8 (2.1) | F = 0.01, P = 0.95 | 24.8 (3.7) | 25.8 (3.6) | F = 0.38, P = 0.54 | 25.9 (2.68) | 25.9 (2.27) | F = 0.1, P = 0.9 |
| Education, years (SD) | 14.35 (2.23) | 14.6 (2.1) | 14.1 (2.3) | 14.0 (2.45) | 14.4 (2.20) | F = 0.23, P = 0.63 | 15.5 (1.5) | 14.1 (1.7) | F = 4.9, P = 0.04* | 14.6 (1.9) | 13.6 (3.0) | F = 1.3, P = 0.26 |
| Mean age of onset in family | – | 56.1 (6.7) | 55.4 (8.4) | 55.3 (7.9) | 58.2 (6.3) | – | 54.3 (6.6) | 52.7 (4.8) | – | 58.1 (5.2) | 54.9 (12.1) | – |
| Handedness | – | – | – | – | – | χ2 = 1.4, P = 0.23 | – | – | χ2 = 4.1, P = 0.04 | – | – | χ2 = 0.06, P = 0.81 |
| Right | 73 | 37 | 36 | 16 | 12 | – | 8 | 13 | – | 13 | 11 | |
| Left | 12 | 7 | 5 | 1 | 3 | – | 3 | 0 | – | 3 | 2 | |
| Sex | – | – | – | – | – | χ2 = 0.13, P = 0.72 | – | – | χ2 = 0.24, P = 0.63 | – | – | χ2 = 0.17 P = 0.68 |
| Male | 40 | 21 | 19 | 9 | 7 | – | 7 | 7 | – | 5 | 5 | – |
| Female | 45 | 23 | 22 | 8 | 8 | – | 4 | 6 | – | 11 | 8 | – |
| Brain volumes | ||||||||||||
| TIVa | – | – | – | 1 390 903 | 1 450 461 | F = 1.73, P = 0.21 | 1 501 219 | 1 375 417 | F = 9.88, P = 0.01** | 1 437 451 | 1 373 921 | F = 6.77, P = 0.03** |
| Total brain | – | – | – | 1 166 301 | 1 205 228 | F = 15.02, P = 0.001** | 1 201 246 | 1 206 018 | F = 0.08, P = 0.79 | 1 123 944 | 1 143 427 | F = 4.48, P = 0.06 |
| Total CSF | – | – | – | 249 971 | 241 656 | F = 1.52, P = 0.23 | 250 306 | 244 399 | F = 0.55, P = 0.47 | 232 339 | 222 586 | F = 1.45, P = 0.24 |
| Frontal lobes | – | – | – | 185 756 | 192 530 | F = 2.81, P = 0.11 | 192 501 | 186 598 | F = 1.44, P = 0.26 | 180 518 | 182 866 | F = 0.32, P = 0.58 |
| Temporal lobes | – | – | – | 125 657 | 131 026 | F = 3.95, P = 0.07 | 132 589 | 130 117 | F = 0.00, P = 0.98 | 123 905 | 123 288 | F = 1.78, P = 0.21 |
| Parietal lobes | – | – | – | 95 994 | 99 841 | F = 0.17, P = 0.69 | 99 570 | 97 354 | F = 1.52, P = 0.25 | 93 592 | 95 352 | F = 0.68, P = 0.43 |
| Occipital lobes | – | – | – | 73 183 | 77 445 | F = 0.96, P = 0.34 | 75 198 | 76 833 | F = 0.08, P = 0.78 | 72 467 | 73 832 | F = 0.24, P = 0.64 |
| Cingulate | – | – | – | 30 155 | 30 789 | F = 0.39, P = 0.54 | 31 106 | 31 461 | F = 0.11, P = 0.75 | 29 934 | 28 600 | F = 9.91, P = 0.009** |
| Insula | – | – | – | 11 545 | 11 838 | F = 0.79, P = 0.39 | 12 207 | 11 332 | F = 1.71, P = 0.23 | 11 177 | 11 694 | F = 0.21, P = 0.65 |
| Cerebellum | – | – | – | 104 739 | 107 168 | F = 0.03, P = 0.87 | 112 314 | 115 886 | F = 0.16, P = 0.70 | 105 285 | 106 223 | F = 0.82, P = 0.39 |
| Amygdala | – | – | – | 3471 | 3528 | F = 0.12, P = 0.74 | 3678 | 3566 | F = 0.46, P = 0.52 | 3499 | 3527 | F = 16.41, P = 0.002 |
| Hippocampus | – | – | – | 7679 | 7902 | F = 0.09, P = 0.77 | 8190 | 8199 | F = 0.39, P = 0.55 | 7880 | 8036 | F = 0.00 P = 0.98 |
| Thalamus | – | – | – | 10 975 | 12 045 | F = 12.3, P = 0.003** | 11 256 | 13 011 | F = 4.81, P = 0.06 | 11 561 | 10 838 | F = 41.85, P < 0.001 |
| Basal ganglia | – | – | – | 20 487 | 20 650 | F = 0.11, P = 0.74 | 19 650 | 21 116 | F = 4.19, P = 0.08 | 19 203 | 20 015 | F = 2.10, P = 0.18 |
Brain volume contrasts indicate main effect of genetic status when controlling for age, TIV, sex and scanner type. Mean volumes in mm3, corrected for age at visit and TIV mm3.
P < 0.05.
Bolded values significant after FDR correction and accounting for scanner effects. For non-bolded imaging contrasts with significant P-values, scanner effects preclude conclusion about group differences.
TIV contrast controlled for age, sex and scanner type.
Behavioural and cognitive data were available from 91 young adult GENFI participants from Data freeze 5 (Table 2), of which 49% were mutation carriers and 51% were mutation non-carriers. Again it was observed that the MAPT carriers had more years of education than the MAPT non-carriers [Mcarriers = 15.2 years (SD 2.0) Mnon-carriers 143.6 years (SD 1.9), P = 0.05]. There were no other statistically significant differences in age, years of education, handedness or sex between carriers and non-carriers within, and collapsed across, the three genetic groups.
Demographics, behavioural and cognitive assessments of GENFI young adult mutation carriers versus non-carriers
| Total | Carriers | Non-carriers | C9orf72 Carriers | C9orf72 non-Carriers | C9orf72 contrasts | MAPT Carriers | MAPT non-carriers | MAPT contrasts | GRN carriers | GRN non-carriers | GRN contrasts | |
|---|---|---|---|---|---|---|---|---|---|---|---|---|
| GENFI1 + GENFI2 | ||||||||||||
| n | 92 | 45 | 47 | 17 | 18 | − | 12 | 16 | − | 16 | 13 | − |
| Age (SD) | 25.5 (2.9) | 25.7 (3.1) | 25.4 (2.8) | 25.8 (3.3) | 25.9 (2.2) | t = 0.13, P = 0.90 | 24.9 (3.6) | 25.0 (3.1) | t = 0.06, P = 0.95 | 25.8 (2.55) | 25.0 (3.17) | t = 0.8, P = 0.46 |
| Education, Yrs (SD) | 14.2 (2.3) | 14.6 (2.2) | 13.8 (2.5) | 14.0 (2.5) | 14.1 (2.6) | t = 0.07, P = 0.95 | 15.2 (2.0) | 13.6 (1.9) | t = 2.01, P = 0.05 | 14.7 (1.99) | 13.6 (3.01) | t = 1.10, P = 0.28 |
| Mean age of onset in family, Yrs (SD) | 55.6 (7.7) | 55.8 (6.9) | 55.4 (8.4) | 53.2 (13.3) | 59.2 (6.3) | t = 1.7, P = 0.09 | 53.4 (7.1) | 51.8 (4.9) | t = 0.73, P = 0.47 | 58.1 (5.2) | 54.9 (12.1) | t = 1.0, P = 0.34 |
| Handedness | – | – | – | – | – | t = 1.0, P = 0.33 | – | – | t = 1.3, P = 0.21 | – | – | t = 0.23, P = 0.82 |
| Right | 79 | 37 | 42 | 16 | 15 | − | 9 | 15 | − | 13 | 11 | − |
| Left | 13 | 7 | 6 | 1 | 3 | − | 3 | 1 | − | 3 | 2 | − |
| Sex | – | – | – | – | – | t = 0.49, P = 0.63 | – | – | t = 0.22, P = 0.83 | – | – | t = 0.39, P = 0.70 |
| Male | 48 | 24 | 24 | 8 | 10 | − | 5 | 6 | − | 11 | 8 | − |
| Female | 44 | 21 | 23 | 9 | 8 | − | 7 | 10 | − | 5 | 5 | − |
| Neuropsych, mean (SD) | ||||||||||||
| Digit Span Forward | – | – | – | 6.6 (1.1) | 6.7 (1.1) | F = 0.04, P = 0.84 | 6.8 (0.9) | 6.0 (0.9) | F = 5.8, P = 0.03* | 7.1 (0.1) | 6.5 (1.1) | F = 2.5, P = 0.13 |
| Digit Span Backward | – | – | – | 5.1 (0.9) | 5.1 (1.7) | F = 0.02, P = 0.90 | 5.4 (1.2) | 4.8 (1.1) | F = 1.91, P = 0.18 | 5.2 (1.1) | 4.9 (1.2) | F = 1.0, P = 0.32 |
| Digit Symbol | – | – | – | 60.3 (7.3)a | 61.8 (15.2) | F = 0.2, P = 0.69 | 66.7 (11.0) | 60.4 (10.9) | F = 1.81, P = 0.19 | 68.2 (7.8) | 60.0 (14.5) | F = 4.5, P = 0.047* |
| Boston Naming | – | – | – | 27.4 (1.8) | 27.5 (2.2) | F = 0.02, P = 0.90 | 27.5 (1.9) | 27.9 (1.6) | F = 0.28, P = 0.60 | 27.4 (1.) | 27.7 (1.6) | F = 0.3, P = 0.58 |
| Verbal Fluency (Animals) | – | – | – | 22.7 (4.5) | 24.9 (7.3) | F = 1.5, P = 0.24 | 22.4 (4.7) | 23.1 (8.9) | F = 0.06, P = 0.82 | 25.8 (5.14) | 23.5 (5.2) | F = 1.4, P = 0.26 |
| Verbal Fluency (FAS) | – | – | – | 35.1 (10.5) | 41.1 (12.1) | F = 2.1, P = 0.16 | 42.3 (7.5) | 29.8 (7.2) | F = 18.6, P = 0.0003* | 37.4 (14.1) | 42.8 (9.3) | F = 1.3, P = 0.26 |
| Block Design | – | – | – | 50.1 (17.7)a | 56.0 (9.2) | F = 1.4, P = 0.25 | 57.4 (10.8) | 54.0 (11.5) | F = 0.62, P = 0.44 | 57.6 (10.4) | 52.7 (15.2) | F = 1.1, P = 0.31 |
| CBI | – | – | – | 3.2 (3.5)b | 3.6b (5.2) | F = 0.1, P = 0.79 | 2.75 (5.4) | 5.9 (8.3) | F = 1.6, P = 0.22 | 3.7 (4.2)b | 3.5 (5.1)b | F = 0.01, P = 0.94 |
*P < 0.05. Significant results bolded. Independent sample t-tests or one-way analyses of covariance were used to discern group differences for relevant variables. F statistics indicate main effects of genetic status.
One data-point missing (C9orf72 expansion carrier).
Data-points missing (C9orf72: two carriers, two non-carriers; GRN: one carrier, one non-carrier).
C9orf72
MRI analysis
Young adult C9orf72 repeat expansion carriers had significantly smaller total brain volumes [P < 0.005; partial eta squared (η2p) = 0.50] and thalamic volumes (P < 0.005; η2p = 0.45) in comparison to C9orf72 non-carriers (Table 1). No differences were observed for TIV or total CSF volumes. Mean volumes were non-significantly lower in carriers relative to non-carriers in all of the remaining regions apart from the caudate. There were no significant genetic status × scanner or genetic status × sex interactions. There was no significant difference in vertex-wide cortical thickness between expansion carriers and non-carriers.
Behavioural and cognitive assessments
No statistically significant differences between carriers and non-carriers were found in symptom frequencies across all domains (Supplementary Table 1). No significant differences between C9orf72 repeat expansion carriers versus non-carriers were observed in the other behavioural scales or cognitive tasks (Table 2 and Supplementary Tables 1–3).
MAPT
MRI analysis
Young adult MAPT mutation carriers had larger TIV than non-carriers. There were no significant differences in brain or CSF volumes between young adult MAPT carriers and non-carriers when TIV was adjusted for. There was no significant difference in vertex-wide cortical thickness between MAPT mutation carriers and non-carriers.
Behavioural and cognitive assessments
MAPT mutation carriers performed better than non-carriers on verbal fluency (letter) performance (F = 18.6, P < 0.001) and digit span forward (F = 5.8, P < 0.05) (Fig. 1). Sensitivity analyses, adding education as a covariate and adding site as a variable retained the significant main effect of genetic status on both verbal fluency (P < 0.001) and digit span forward (P < 0.05).

Main effect of genetic status on cognitive performance in young adult MAPT mutation group. MAPT mutation carriers show enhanced performance on (A) digit span forward and (B) verbal fluency in comparison to non-carriers. Small circles represent individual scores; large circles represent group means.
No statistically significant differences between carriers and non-carriers were found for the CBI-R or in GENFI symptom list endorsement frequencies across all domains (Table 2 and Supplementary Tables 2 and 3).
GRN
MRI analysis
GRN mutation carriers were found to have significantly larger TIV and cingulate volume (P < 0.01; η2p = 0.48) relative to non-carriers when adjusted for TIV (Table 1). There were no other significant differences once scanner type interactions were accounted for, including no significant difference in vertex-wide cortical thickness between GRN mutation carriers and non-carriers.
Behavioural and cognitive assessments
GRN mutation carriers performed better on the digit symbol task than non-carriers (F = 4.459, P < 0.05) (Fig. 2). Sensitivity analyses adding education covariate and adding site as a variable supported the pattern of findings (P = 0.07). No statistically significant differences in symptom frequencies across all domains were found between GRN mutation carriers and non-carriers. No statistically significant differences between carriers and non-carriers were found in symptom frequencies across all domains (Table 2 and Supplementary Tables 2 and 3).
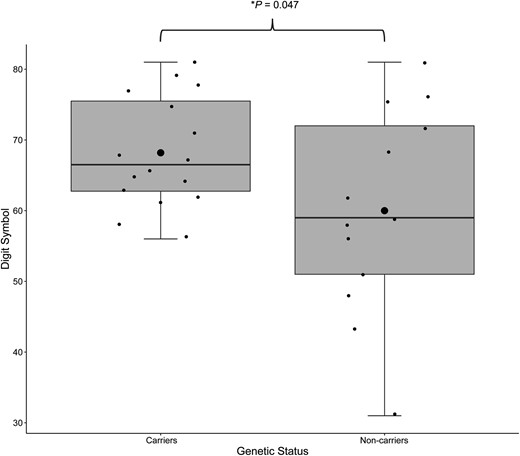
Main effects of genetic status on cognitive performance in the young adult GRN mutation group. GRN mutation carriers show enhanced performance on digit symbol in comparison to non-carriers. Small circles represent individual scores; large circles represent group means.
MRI sensitivity analyses
Sensitivity analyses conducted for all three gene groups including only participants with 3 T MRI scans (n = 82) demonstrated the same pattern of significant and non-significant imaging findings as reported above.
Discussion
These data demonstrate early effects of MAPT, C9orf72 and GRN mutations on brain structure and function, detectable in the third decade of life. The presence of structural differences nearly 30 years prior to expected symptom onset, at ages when the frontal lobes are still maturing suggests there are neurodevelopmental consequences of some forms of genetic FTD. The regions and patterns of volumetric differences varied according to the gene, with hints of potentially advantageous consequences early in life for MAPT and GRN mutations.
Patients with FTD due to C9orf72 repeat expansions most commonly develop behavioural variant FTD or amyotrophic lateral sclerosis, although can present with a non-fluent primary progressive aphasia or corticobasal syndrome phenotype.2 In young adult C9orf72 repeat expansion carriers, the findings of reduced total brain and thalamic volumes are in line with studies of older symptomatic and presymptomatic FTD cohorts. Thalamic atrophy is a predominant structural change in symptomatic patients with C9orf72-associated FTD, amyotrophic lateral sclerosis or FTD/amyotrophic lateral sclerosis.42–46 The current findings extend prior findings in older presymptomatic C9orf72 expansion carriers of expanded 3rd ventricular volumes approximately 14 years prior to expected symptom onset8 and a subgroup analysis of C9orf72 repeat expansion carriers 40 years of age or younger that identified differences in thalamic volumes.47 Indications that an alternate pathophysiologic process could drive these early structural differences is found in non-human models of C9orf72 during the neurodevelopmental period, where the repeat expansion is associated with multiple cellular level effects including impaired axonal genesis, cellular motility and increased neuronal apoptosis.48 Whether the smaller thalamic and total brain volumes are due to early hallmark FTD pathology causing atrophy or due to neurodevelopmental effects of C9orf72 on other critical processes is not yet known given the lack of brain tissue evaluations available at these younger ages. However, the preserved TIV with smaller total brain volumes and smaller thalamic volumes would favour volume loss and early neurodegeneration.
While informants’ reports of neuropsychiatric symptoms in C9orf72 expansion carriers versus non-carriers did not reach significance, a prior family history study identified a higher prevalence of what are traditionally considered neurodevelopmental disorders including autism and schizophrenia (hazard ratios of 2.7 and 4.9, respectively).25 In another cohort, a retrospective inquiry and chart review of C9orf72 expansion carriers versus non-carriers reported some increase in behavioural traits, including a fixed pattern of behaviours, excessive buying and obsessive physical exercise in the years prior to FTD conversion,49 although Lee et al.50 found no differences in behaviour or psychiatric histories between carriers and non-carriers at a mean age of 43 years. The lack of neuropsychiatric symptom differences in the present study relative to these prior reports may be due to the prospective symptom ascertainment in our sample, at a time when the majority of participants and their informants were unaware of their genetic status. Other potential reasons for the lack of detection of reported behavioural symptoms in the current study in comparison to findings from Devenney et al.25 and Gossink et al.49 may reflect differences between a clinical sample versus research sample. Specifically, participants who enroll in ongoing clinical research studies requiring multiple assessments and MRI scans are less likely to have significant psychiatric disorders at time of participation. Finally, the neuropsychiatric symptom rating scales used were broad, but did not probe each domain in detail, and thus a more detailed elicitation of potentially relevant symptoms using tools sensitive to subclinical phenomenon such prodromal psychosis or autistic traits may be more sensitive in pre-symptomatic states. These measures, as well as assessment of potential enrollment biases and differences within GENFI families between research participants and non-participants have been added to the GENFI-3 protocol.
Affected patients with GRN mutations most commonly present with behavioural variant FTD, although the other FTD clinical subtypes including non-fluent primary progressive aphasia and corticobasal syndrome have been reported.51 In contrast to the smaller brain volumes observed in the young adult C9orf72 expansion carriers, larger total intracranial and cingulate cortex volumes were observed in GRN mutation carriers versus familial non-carriers, the latter in particular a region commonly atrophied early in the course of symptomatic GRN FTD.3,52 Cognition was generally preserved in the GRN young adult carriers and was better than non-carriers on the digit-symbol task, one measure of processing speed. While larger brain volumes in young adult GRN mutation carriers may appear unexpected, youths carrying the huntingtin (HTT) gene mutation have larger striatal volumes relative to familial non-carriers, prior to accelerated atrophy.53 We cannot yet comment on rates of change from this cross-sectional analysis, but delineation of the trajectories of these regions will be possible with further longitudinal data collection in the young adult GENFI participants. Of note, given that in this age range grey matter structures undergo a normative period of volume reduction as part of the maturation process,54 a finding of larger volume can reflect abnormal maturational processes that are advantageous or disadvantageous. Larger brain volumes have been reported prior to atrophy in presenilin 1 (PSEN1) mutation carriers.55 The findings of generally preserved cognitive performance and the lack of atrophy in young adult GRN mutation carriers fit with recent data from large international cohorts that indicate changes in brain volume and NfL levels start within a few years’ proximity to overt conversion to symptomatic genetic FTD,6,7,56,57 in which the average age of diagnosis is ∼61 years.1 Our findings of preserved cognition and brain volumes in GRN carriers support optimism that a window of opportunity exists in adult pre-symptomatic participants in which potential mitigation of low GRN levels in GRN carriers might delay or prevent subsequent neurodegeneration. The identification of hypertrophy of the relevant cingulate region in young adult GRN carriers suggests examination of such regions for potential early advantageous or compensatory cellular responses during neurodevelopmental phases may hold promise to identify new critical pathways and therapeutic targets.
Like GRN mutation carriers, MAPT mutation carriers also had larger TIV relative to non-carriers. While symptomatic and older presymptomatic MAPT carriers commonly show behavioural or language-related deficits and atrophy in anterior temporal regions,2,3,58–61 the young adult MAPT mutation carriers showed no other structural brain differences and performed as well or better than familial non-carriers on cognitive tests and informant-based symptom ratings. These findings are generally consistent with those from the entire GENFI cohort and from independent cohorts of MAPT carriers where mean brain volumes did not differ between pre-symptomatic mutation carriers versus controls,62 although in some a small subset of presymptomatic carriers had lower volumes. Specifically, in an independent cohort of MAPT presymptomatic carriers with a mean age of 40 years, mean brain volumes did not differ from those of non-carriers, although frequency maps identified 20% of MAPT carriers in their thirties as having lower mesial temporal volumes.23 Similarly, in a GENFI study examining different atrophy patterns in MAPT mutation carriers, 84% of presymptomatic MAPT carriers were categorized as having normal brain volume (mean age of 38 years), while ∼16% were assigned to the temporal or frontotemporal atrophy subtype.63 Notably, group assignment was highly stable during longitudinal follow-up (range: 1–5 years). In a subset analysis, six presymptomatic mutation carriers with CDR 0, mean age 39 years, showed smaller volumes in anterior temporal and frontal regions.64 Longitudinal observations of young MAPT carriers are required to examine whether higher brain volumes may be present at younger ages, as observed in HTT mutation carriers,53 and in this study in young adult GRN mutation carriers. Additionally, larger cohorts that enable modeling of the different MAPT mutation types during neurodevelopmental periods are needed given the heterogeneous clinical presentations and neuroimaging patterns associated with different MAPT variants.23,63
The finding that MAPT carriers were rated as having more education and better cognitive performance than MAPT non-carriers was an unpredicted finding, although the Tau-4R-P301L MAPT mouse transgenic shows early life enhanced memory performance and increased long term potentiation in the hippocampus.65 The higher educational attainment with aspects of improved cognitive performance, coupled with larger TIV in young MAPT carriers, suggests the possibility of antagonistic pleiotropy, where early advantageous consequences of a mutation come with later adverse effects such as poorer repair capacity in middle and old age.28,66 In two small cohorts of MAPT presymptomatic mutation carriers with different mutation types, elevated tau tracer binding was observed in most of the pre-symptomatic patients in their forties to sixties.67,68 However, the youngest carrier, who was ∼30 years prior to estimated disease onset, showed no tau tracer binding. We suggest that together the evidence supports the likely presence of cellular advantageous or compensatory processes, which delay such accumulation of pathologic tau aggregations early in neurodevelopmental periods and represent an understudied opportunity for new therapeutic development. Given the limited sample size, this intriguing result of potential early life advantages with gradual accumulation of pathology only reaching a threshold to cause atrophy or functional changes close to mid-life requires replication before further interpretation.
Limitations of the present study include the relatively small sample size for comparison of cognitive performance, particularly given differences in language and education levels. Due to the relatively small number of participants per family for the majority of GENFI participants, including some with no other participating family members, the study lacked power to include family and site as variables in the primary analysis, although site related variance was included in post hoc sensitivity analyses of cognitive findings. The finding of total brain volumetric differences in the C9orf72 expansion carriers but lack of significant differences in cortical thickness may indicate that differences in both subcortical grey matter and white matter regions are present and contribute to the observed volumetric differences. In GRN carriers, the absence of changes in cortical thickness in the cingulate cortex may reflect the differential power of the ROI versus voxel-wise approaches to detect differences or that volume is influenced by factors other than cortical thickness, such as surface area.
In summary, this examination of the youngest adults from families with genetic FTD identifies early brain volume loss in C9orf72 mutation carriers <30 years of age, increased TIV and early hypertrophy of the anterior cingulate in young adult GRN carriers, and increased TIV with relatively normal brain structure and enhanced cognitive performance in young adult MAPT carriers. These results support long raised speculations and hypotheses about potential neurodevelopmental origins of some forms of FTD and identify structural changes in young adult mutation carriers, some of which may have early advantages but deleterious consequences later in life. Longitudinal follow-up and establishment of younger cohorts will enable further essential prospective comparison of structural and functional trajectories in mutation carriers with familial non-carriers, as well as examination of mutation specific effects, to uncover key neurodevelopmental changes that may set the stage for or delay the onset of FTD.
Acknowledgements
We thank the GENFI research participants for their contribution to the study.
Funding
This project was supported by Canadian Institutes of Health Research as part of a Centres of Excellence in Neurodegeneration grant, and by Canadian Institutes of Health Research operating grants (327387; 452843; 70797). The Dementia Research Centre is supported by Alzheimer's Research UK, Alzheimer's Society, Brain Research UK, and The Wolfson Foundation. This work was supported by the National Institute for Health Research (NIHR) Queen Square Dementia Biomedical Research Unit and the University College London Hospitals Biomedical Research Centre, the Leonard Wolfson Experimental Neurology Centre (LWENC), and the UK Dementia Research Institute, which receives its funding from UK DRI Ltd, funded by the UK Medical Research Council, Alzheimer's Society and Alzheimer's Research UK. This work was also supported by the MRC UK GENFI grant (MR/M023664/1), the Italian Ministry of Health (CoEN015 and Ricerca Corrente), the Alzheimer's Society grant (AS-PG-16-007), the Bluefield Project and the EU Joint Programme – Neurodegenerative Disease Research (GENFI-PROX grant 2019-02248). M.B. is supported by a Fellowship award from the Alzheimer’s Society, UK (AS-JF-19a-004-517). M.B.’s work was also supported by the UK Dementia Research Institute which receives its funding from DRI Ltd., funded by the UK Medical Research Council, Alzheimer’s Society and Alzheimer’s Research UK. J.D.R. is supported by the Miriam Marks Brain Research UK Senior Fellowship and has received funding from an MRC Clinician Scientist Fellowship (MR/M008525/1) and the NIHR Rare Disease Translational Research Collaboration (BRC149/NS/MH). J.B.R. is funded by the Wellcome Trust (103838) and the National Institute for Health Research Cambridge Biomedical Research Centre. This work was funded by the Deutsche Forschungsgemeinschaft (DFG, German Research Foundation) under Germany’s Excellence Strategy within the framework of the Munich Cluster for Systems Neurology (EXC 2145 SyNergy – ID 390857198). It is also funded by the Ministry of Health, Italy (S.S.). R.V.’s work is supported by the Mady Browaeys Fonds voor Onderzoek naar Frontotemporale Degeneratie. R.S.-V.’s work is supported by Instituto de Salud Carlos III (grant number 20/00448), cofunded by the EU. ANR-PRTS PrevdemALS study funding (I.L.B.). Several authors of this publication (J.C.vS., M.S., A.D., M.O., R.V., I.L.B., J.D.R.) are members of the European Reference Network for Rare Neurological Diseases (ERN-RND) - Project ID No 739510.
Competing interests
The authors report no competing interests.
Supplementary material
Supplementary material is available atBrainonline.
Appendix 1
List of GENFI consortium authors
Aitana Sogorb Esteve, Carolin Heller, David L. Thomas, Emily G. Todd, Jennifer Nicholas, Hanya Benotmane, Henrik Zetterberg, Imogen J. Swift, Kiran Samra, Rachelle Shafei, Carolyn Timberlake, Thomas Cope, Timothy Rittman, Alberto Benussi, Enrico Premi, Roberto Gasparotti, Silvana Archetti, Stefano Gazzina, Valentina Cantoni, Andrea Arighi, Chiara Fenoglio, Elio Scarpini, Giorgio Fumagalli, Vittoria Borracci, Giacomina Rossi, Giorgio Giaccone, Giuseppe Di Fede, Paola Caroppo, Pietro Tiraboschi, Sara Prioni, Veronica Redaelli, David Tang-Wai, Ekaterina Rogaeva, Miguel Castelo-Branco, Morris Freedman, Ron Keren, Sandra Black, Sara Mitchell, Rosa Rademakers, Jackie Poos, Janne M. Papma, Lucia Giannini, Rick van Minkelen, Yolande Pijnenburg, Benedetta Nacmias, Camilla Ferrari, Cristina Polito, Gemma Lombardi, Valentina Bessi, Michele Veldsman, Christin Andersson, Hakan Thonberg, Linn Öijerstedt, Vesna Jelic, Paul Thompson, Tobias Langheinrich, Albert Lladó, Anna Antonell, Jaume Olives, Mircea Balasa, Nuria Bargalló, Sergi Borrego-Ecija, Ana Verdelho, Carolina Maruta, Catarina B. Ferreira, Gabriel Miltenberger, Frederico Simões do Couto, Alazne Gabilondo, Ana Gorostidi, Jorge Villanua, Marta Cañada, Mikel Tainta, Miren Zulaica, Myriam Barandiaran, Patricia Alves, Benjamin Bender, Carlo Wilke, Lisa Graf, Annick Vogels, Mathieu Vandenbulcke, Philip Van Damme, Rose Bruffaerts, Koen Poesen, Pedro Rosa-Neto, Serge Gauthier, Agnès Camuzat, Alexis Brice, Anne Bertrand, Aurélie Funkiewiez, Daisy Rinaldi, Dario Saracino, Olivier Colliot, Sabrina Sayah, Catharina Prix, Elisabeth Wlasich, Olivia Wagemann, Sandra Loosli, Sonja Schönecker, Tobias Hoegen, Jolina Lombardi, Sarah Anderl-Straub, Adeline Rollin, Gregory Kuchcinski, Maxime Bertoux, Thibaud Lebouvier, Vincent Deramecourt, Beatriz Santiago, Diana Duro, Maria João Leitão, Maria Rosario Almeida, Miguel Tábuas-Pereira, Sónia Afonso.

