


Abstract
Although delirium is a significant clinical and public health problem, little is understood about how specific vulnerabilities underlie the severity of its presentation. Our objective was to quantify the relationship between baseline cognition and subsequent delirium severity.
We prospectively investigated a population-representative sample of 1510 individuals aged ≥70 years, of whom 209 (13.6%) were hospitalized across 371 episodes (1999 person-days assessment). Baseline cognitive function was assessed using the modified Telephone Interview for Cognitive Status, supplemented by verbal fluency measures. We estimated the relationship between baseline cognition and delirium severity [Memorial Delirium Assessment Scale (MDAS)] and abnormal arousal (Observational Scale of Level of Arousal), adjusted by age, sex, frailty and illness severity. We conducted further analyses examining presentations to specific hospital settings and common precipitating aetiologies.
The median time from baseline cognitive assessment to admission was 289 days (interquartile range 130 to 47 days). In admitted patients, delirium was present on at least 1 day in 45% of admission episodes. The average number of days with delirium (consecutively positive assessments) was 3.9 days. Elective admissions accounted for 88 bed days (4.4%). In emergency (but not elective) admissions, we found a non-linear U-shaped relationship between baseline global cognition and delirium severity using restricted cubic splines. Participants with baseline cognition 2 standard deviations below average (z-score = −2) had a mean MDAS score of 14 points (95% CI 10 to 19). Similarly, those with baseline cognition z-score = + 2 had a mean MDAS score of 7.9 points (95% CI 4.9 to 11). Individuals with average baseline cognition had the lowest MDAS scores. The association between baseline cognition and abnormal arousal followed a comparable pattern. C-reactive protein ≥20 mg/l and serum sodium <125 mM/l were associated with more severe delirium.
Baseline cognition is a critical determinant of the severity of delirium and associated changes in arousal. Emergency admissions with lowest and highest baseline cognition who develop delirium should receive enhanced clinical attention.
Introduction
Delirium is a severe neuropsychiatric syndrome characterized by acute changes in arousal, inattention and other mental status changes. Its clinical importance is well-established: it affects one in four older inpatients, and in multiple settings, delirium is associated with adverse outcomes such as mortality, inpatient falls, delayed discharges and significant patient and carer distress.1–5 Delirium is also associated with future cognitive impairment and incident dementia.6,7 There is wide variability in the natural history of delirium.8 Although we know that older age, previous cognitive impairment and frailty are delirium risk factors,9,10 the combination of baseline cognition and acute illness could result in different degrees of delirium symptomatology. The influence of baseline cognition on subsequent delirium phenomenology has not been considered comprehensively. Yet, an empirical understanding of this relationship could affect delirium detection, assessment and management because the clinical significance of delirium symptoms might have different implications if framed in the context of a known baseline cognitive state.
Existing studies linking baseline cognitive function to delirium severity have used the methodological advantage of prospective follow-up in elective surgical populations.11–13 However, most delirium in secondary care presents in unselected unscheduled medical admissions with a much greater range of pre-existing cognitive impairment and frailty.14 Previous work in acute medical patients has assessed baseline cognition in two ways. First, by establishing a binary dementia diagnosis, or second by using cognitive testing on admission only in patients initially without delirium.15,16 This is a crucial issue because around two-thirds of delirium is present on admission.15,17 Very few reports in medical patients have assessed delirium severity in relation to baseline cognition.18–20 More broadly, we do not fully understand the overlap between delirium severity and arousal changes.21 Abnormal arousal may be a key driver to mortality after delirium, although its detailed quantification is under-represented in many delirium severity scales.22 Finally, we know little about the specific aetiological precipitants that might be associated with more severe delirium in general hospital settings.
To understand the influence of baseline cognition on delirium phenomenology (including abnormal arousal) across the whole spectrum of hospital presentations, we needed to characterize cognitive function in a stable community sample and then at each subsequent acute hospitalization systematically: (i) assess the severity of delirium on each day; (ii) relate this to baseline cognitive function; and (iii) understand the relationship between hospital setting, aetiological factors and delirium risk. We hypothesized that lower baseline cognition would lead to greater severity of delirium symptoms in the event of acute hospitalization.
Materials and methods
Population
The Delirium and Population Health Informatics Cohort is a prospective longitudinal population-representative sample of older adults aged ≥70 years in the London Borough of Camden, a central city region with a population of 260 000 residents (Fig. 1).7,23 The National Health Service in England provides >95% of healthcare, and Camden is served by a single primary care system (the Camden Clinical Commissioning Group representing 39 general practices) and two acute hospitals (University College Hospital, Royal Free Hospital). This report is a planned analysis of the participants recruited between January 2017 and December 2018. Our overall prespecified power calculations were for a separate outcome: a 2-year change in cognition at follow-up in the whole cohort. We anticipated that a minimum of 11% of the cohort would need to be admitted to provide meaningful estimates describing the relationship between baseline cognition and incident delirium.23
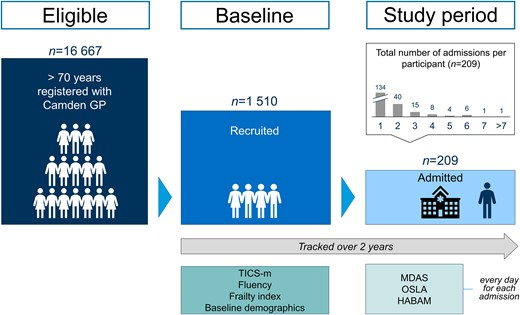
Participant flow diagram. Cohort structure showing sample and schedule of assessments.
Eligible participants were aged ≥70 years and registered with a Camden-based general practitioner. Based on the coded problems in the primary care record, we did not approach those with severe hearing impairment, aphasia, or who could not speak English sufficiently to undertake any basic cognitive assessment or were in the terminal phase of illness. In addition to the primary care lists, we over-sampled from memory clinics and patients recently discharged from secondary care in an 8:1:1 ratio. Invitations were sent by letter. All individuals, or their nominated proxies, gave consent to participate. The direct sampling from memory clinics facilitated the inclusion of participants with pre-existing cognitive impairments and dementia.
Baseline assessments
Most participants were assessed through telephone interviews. However, we enabled eligible participants with previously unidentified yet significant hearing impairment to be assessed at a home visit. Cognitive function was the primary measure, assessed using the modified Telephone Interview for Cognitive Status (TICS-m), which covers orientation, attention, naming, praxis, calculation and immediate and delayed recall of a 10-item non-semantically related word list.24 We supplemented this with the two verbal fluency tasks (generating words beginning with the same letter, number of animals) from the Addenbrooke’s Cognitive Examination to improve the measurement of executive function in the battery.24,25 Through interview and real-time access to all health and social care records through the Camden Integrated Digital Record, we assessed the following domains: socio-demographic factors, index of multiple deprivation, general health, co-morbidities, medications, health behaviours, hearing, vision, quality of life, dental health, continence, falls, depression, personal and instrumental activities of daily living. Frailty was quantified using a frailty index, representing the proportion of accumulated health deficits (0 to 1). This was derived using 28 items drawn from the baseline assessment and calculated in line with standard procedures.26 However, we did not include cognitive items to avoid collinearity with the primary cognitive measure. Further details for ascertaining baseline covariates have previously been published.23 For these analyses, we also checked to assess the extent to which inclusion or exclusion of specific frailty index items might have affected the fundamental relationships between frailty and delirium and found the index to be robust (Supplementary Table 1).
Hospital assessments
All participants admitted to either of the acute hospitals were automatically flagged through daily electronic alerts and reviewed in person each day (Monday to Friday) from the day of admission by a researcher. We did not assess participants presenting to the emergency department who were discharged from there. At each assessment, we evaluated participants for changes in cognitive or physical function using the Memorial Delirium Assessment Scale (MDAS), Observational Scale of Level of Arousal (OSLA) and the Hierarchical Assessment of Balance and Mobility (although this last measure does not form part of this analysis).21,27,28 We recorded additional information on acute aetiology, medications, illness severity (NEWS) and laboratory findings. The NEWS integrates clinically abnormal physiological indices (heart rate, blood pressure, respiratory rate, oxygen saturations, supplemental oxygen requirements, alertness) giving a score from 0 to 20.29,30 Higher scores indicate risk of immediate deterioration, with scores above 4 indicating need for clinical review for escalation of care. Although NEWS2, which includes a measure of confusion, was introduced over the course of the study, this component had not been reliably implemented in routine care.30
Ascertainment of delirium
We used the Diagnostic and Statistical Manual of Mental Disorders (DSM) IV criteria as the case ascertainment for the primary outcome because it is the most widely used definition and allows comparative estimates with other studies. Delirium was ascertained for every day of hospital admission using all available information. Complete interview questions are available on the Dementias Platform UK. On each day, we determined delirium to be present if individuals met criteria A (disturbance of consciousness), B (change in cognition and/or perception) and C (acute and fluctuates). By virtue of their inpatient admission, all participants were deemed to fulfil Criterion D (physiological consequence of a general medical condition).
Statistical analyses
Outcome measures
Delirium severity
MDAS assesses 10 domains of delirium symptoms (awareness, orientation, short-term memory, digit span, attention capacity, disorganized thinking, perceptual disturbance, delusions, psychomotor activity, sleep–wake cycle, each scored out of 3) to give a 30-point measure of delirium severity. Abnormal arousal: the OSLA was designed to quantify grades of arousal changes in delirium, specifically quantifying eye opening, eye contact, posture and movement.21 It has 15 points, with higher scores representing deviations in arousal level in either direction, i.e. hyperactive or hypoactive.
Exposures
Baseline cognition
For the composite cognitive score, the TICS-m was scored out of 53 points, verbal fluency scored out of 14 points, summed to 67 points and standardized as a z-score (score-mean)/standard deviation. In the hospital setting, we separately examined elective and emergency admissions, as well as those presenting to surgical and internal medicine services. For the aetiology, we explored possible effects of broad aetiological categories based on laboratory results: C-reactive protein (≥20 mg/l); white cell count (<4 × 10⁹ cells/l; 4–11 × 109 cells/l; ≥ 11 × 109 cells/l); acute kidney injury (defined by the NHS England patient safety alert algorithm31); anaemia (haemoglobin <100 g/l) and hyponatraemia (<125 mM; 125–135 mM; 135–145 mM; ≥ 145 mM).
Frailty was quantified using a frailty index, as described before. Education was categorized as: up to primary (6 years of school); up to secondary (12 years school) and degree level or above. We also adjusted for time from baseline assessment to first admission to account for any possible interval change in cognition.
Missing data
Whole assessments that were missing due to falling on a weekend or public holiday (missing at random) were forwards-filled (Friday carried to Saturday) and backwards-filled (Sunday carried from Monday) in 24-h intervals for up to 4 days. Imputation is primarily a statistical technique. However, for backwards filling, this approach has the advantage of automatically carrying over information from the next working day’s chart review. Otherwise, data were assumed to be missing at random.
Models
In exploratory analyses, we examined the distribution of MDAS and OSLA scores by tertiles of baseline cognition (Supplementary Fig. 1), which suggested the underlying relationships might be non-linear. We investigated this by fitting restricted cubic splines with three knots. We used the default knot positioning from the Stata mkspline function, which operationalizes Harrell’s recommended percentiles with the additional restriction that the first and last knots are bound by the fifth-smallest and fifth-largest values of baseline cognition, respectively.32 We found equivalent results using fractional polynomials, a complementary technique for describing non-linear relationships (Supplementary Table 2 and Supplementary Fig. 2).
Models were estimated for each admission in each individual using mixed-effects linear regression, where each day’s MDAS or OSLA scores were the dependent variable, adjusted by age, sex, baseline cognition [standardized as (score-mean)/standard deviation], frailty index, NEWS and time from baseline assessment to first admission.
Sensitivity analysis
Because MDAS items 2 (disorientation) and 3 (short-term memory impairment) may be higher because of previous cognitive impairment (i.e. worse baseline cognitive scores), we performed a sensitivity analysis, replicating the principal models with these items removed (modified outcome score/24 points).
After estimating each model, we checked assumptions using plots of the standardized residuals. We performed all analyses using Stata v.17.0 (StataCorp, TX, USA).
Data availability
Complete de-identified participant data, along with study protocols, and a variable dictionary, are available through the Dementias Platform UK Data Portal: https://portal.dementiasplatform.uk.
Results
Of 1510 participants recruited, median age was 77 [interquartile range (IQR) 73 to 82], and 57% were female (Table 1). We undertook home assessments in n = 32 participants because hearing impairment precluded telephone interview. Over the study period (follow-up to July 2021), 209 participants (13.6%) were hospitalized across 371 episodes, with 1566 days of data collection, totalling 1999 person-days of assessment following imputation to account for weekends and bank holidays (Fig. 1). Elective admissions accounted for 6% episodes (22/371) and 88 bed days (4.4%). In emergency admissions, hospitalized individuals had lower baseline TICS-m cognitive scores (mean 35.5 versus 38.8 points, P < 0.01) and more frailty (frailty index 0.25 versus 0.15, P < 0.01) than those not hospitalized. Individuals admitted once accounted for 114 (55%) hospital episodes; the rest were admitted multiple times (median number recurrent admissions 2, IQR 2 to 4). The median time from baseline cognitive assessment to admission was 289 days (IQR 130 to 447 days).
Characteristics of the cohort in relation to hospitalization and delirium status
| Whole cohort | Hospitalized | Delirium | |||
|---|---|---|---|---|---|
| n = 1511 | n = 209 | P | n = 115 | P | |
| Whole cohort | |||||
| Age | 77.8 (6.2) | 80.7(6.4) | <0.01 | 81.9 (6.6) | 0.03 |
| Female | 57% | 54% | 0.56 | 55% | 0.95 |
| Education | – | – | <0.01 | – | <0.01 |
| ȃDegree level | 65% | 50% | 40% | ||
| ȃUp to secondary (12 y schooling) | 21% | 26% | 30% | ||
| ȃUp to primary (6 y schooling) | 14% | 24% | 30% | ||
| White ethnicity | 94% | 92% | 0.45 | 89% | 0.56 |
| Frailty Index (SD) | 0.15 (0.13) | 0.25 (0.16) | <0.01 | 0.30 (0.17) | <0.01 |
| TICS-m (total, SD) | 38.8 (5.9) | 35.5 (8.3) | <0.01 | 33.8 (8.7) | <0.01 |
| Fluency (words, SD) | 15.6 (6.2) | 13.0 (7.0) | <0.01 | 11.6 (6.8) | <0.01 |
| Fluency (animals, SD) | 19.0 (7.0) | 15.0 (7.8) | 13.3 (7.4) | ||
| Self-rated health (poor/very poor) | 18% | 42% | <0.01 | 49% | 0.62 |
| Past medical history | |||||
| ȃMyocardial infarction | 21% | 34% | <0.01 | 37% | 0.86 |
| ȃDiabetes mellitus | 12% | 19% | <0.01 | 19% | 0.22 |
| ȃHypertension | 50% | 62% | <0.01 | 61% | 0.35 |
| ȃStroke | 9% | 14% | <0.01 | 16% | 0.11 |
| ȃCancer | 24% | 28% | 0.09 | 25% | 0.13 |
| ȃCOPD | 14% | 25% | <0.01 | 28% | 0.75 |
| Any impaired PADL | 9% | 23% | <0.01 | 31% | <0.01 |
| ȃToileting | 4% | 5% | <0.01 | 7% | 0.31 |
| ȃDressing | 4% | 9% | <0.01 | 12% | 0.17 |
| ȃBathing | 4% | 11% | <0.01 | 16% | 0.12 |
| Any impaired IADL | 73% | 84% | <0.01 | 90% | <0.01 |
| ȃShopping | 18% | 41% | <0.01 | 52% | 0.05 |
| ȃWalking outside | 15% | 34% | <0.01 | 43% | 0.04 |
| Length of stay (days, IQR) | – | 2 (1–4) | 4 (2–8) | <0.01 | |
| Hospitalization | |||||
| Presenting complaint (top five systems) | |||||
| ȃGeneral (malaise, fever) | – | 14% | 15% | 0.48 | |
| ȃRespiratory (dyspnoea, cough) | – | 14% | 9% | 0.03 | |
| ȃNeurological (delirium, weakness) | – | 5% | 9% | 0.02 | |
| ȃCV (chest pain, palpitations) | – | 6% | 6% | 0.99 | |
| ȃGI (abdominal pain, diarrhoea) | – | 7% | 5% | 0.32 | |
| Sodium | – | 137 (5.3) | 139 (4.1) | <0.01 | |
| Potassium | – | 4.2 (0.6) | 4.4 (0.6) | <0.01 | |
| Creatinine | – | 93.6 (66.3) | 92.7 (52.3) | 0.04 | |
| Haematocrit | – | 0.34 (0.05) | 0.36 (0.05) | <0.01 | |
| White cell count | – | 9.7 (7.6) | 9.2 (4.5) | 0.61 | |
Hospitalization = sample hospitalized at least once, P-values in hospitalized patients refers to comparison with whole cohort; P-values in patients with delirium refers to comparison with all hospitalized patients. Delirium = any occurrence of delirium during any admission, P-values refer to comparisons with hospitalized sample. COPD = chronic obstructive pulmonary disease; CV = cardiovascular; GI = gastrointestinal; IADL = instrumental activities of daily living; PADL = personal activities of daily living.
The commonest presenting symptoms were general malaise and fever (15%), respiratory (dyspnoea, cough, 9%) and neurological complaints (confusion, 9%) (Table 1). Patients with delirium were less likely to have a respiratory presentation. There were some small statistically significant absolute differences in initial laboratory values (sodium, potassium, creatinine) for delirium patients, but these were unlikely to be clinically relevant (Table 1).
Delirium status
On any given day (point prevalence), 29% of all hospitalized participants fulfilled DSM-IV criteria for delirium. At any assessment, participants met DSM-IV criteria A, B and C 69, 68 and 41% of the time (Table 2). Over the course of an admission, delirium was ascertained in 45% of inpatients (prevalent delirium at admission in 35%, incident delirium developing after admission in 10%). The average number of days with delirium (consecutively positive assessments) was 3.9 days.
Point prevalence of delirium features in hospitalized sample contributing to DSM-IV case ascertainment from 1999 inpatient assessments
| Criterion A: disturbance of consciousness 69% | Criterion B: change in cognition and/or perception 68% | Criterion C: acute and fluctuating change 41% | |||
|---|---|---|---|---|---|
| Item 1 ≥ 2: reduced level of consciousness | 33% | Item 2 ≥ 2: disorientation (time/place questions 5/10 errors) | 32% | Item 10 ≥ 3: sleep–wake cycle disturbance | 17% |
| Item 4 ≥ 2: impaired digit span (5 forwards or 3 backwards errors) | 10% | Item 3 ≥ 2: short-term memory impairment (≥2 errors on 3-item delayed recall) | 31% | Observed fluctuations in arousal | 6% |
| Item 5 ≥ 2: inattention | 30% | Item 6 ≥ 2: disorganized thinking | 15% | Observed motor fluctuations | 5% |
| Inattention during interview | 4% | Item 7 ≥ 2: perceptual disturbance | 13% | Informant report of fluctuations | 22% |
| Dozes off during interview | 1% | Item 8 ≥ 2: delusions | 25% | MDAS or OSLA score different from previous assessment by ≥1 SD | 5% |
| Distracted by environmental stimuli | 3% | Informant report ‘more confused’ | 7% | – | – |
| OSLA total ≥2 | 31% | 'Odd thoughts' described on direct questioning | 2% | – | – |
| MOTYB >5 mistakes | 13% | Hallucinations described on direct questioning | 3% | – | – |
| Serial 7 score lower than baseline | 16% | 'Strange things' described on direct questioning | 1% | – | – |
| – | – | Three sentences to complete (three-choice answer) (any error) | 8% | – | – |
| – | – | Two sentences to complete (free choice answer) (either error) | 7% | – | – |
| – | – | Two-stage sequencing command (either error) | 7% | – | – |
Each MDAS item is rated 0, 1, 2 or 3. Criterion present if one or more symptom/sign positive. Note MDAS item 9 (decreased or increased psychomotor activity) is not used in the case definition. MOTYB = months of the year backwards; Informants = health care staff and/or family/carers.
Measures contributing to Criterion A included abnormal OSLA scores (31%) and inability to perform months of the year backwards (13%). In those able to undertake serial subtractions of 7 from 100 at baseline, 16% could not do so on hospitalization. Digit span was impaired in 10% of individuals.
Components of Criterion B included short-term memory impairment in 31% of cases and 32% could not answer at least 5/10 orientation questions correctly. Disorganized thinking was apparent in 15% of individuals. There was evidence of perceptual disturbance in 13%.
There was fluctuation (Criterion C) in OSLA or MDAS scores (differing from the previous assessment by ≥1 SD) 5% of the time. Informants (ward staff and/or visitors) described fluctuations in arousal or motor function in 22%. New severe sleep–wake cycle disturbance was present in 17%.
Baseline cognition and delirium severity
Overall, there was a non-linear relationship between baseline cognition and delirium severity (Table 3 and Fig. 2). MDAS scores were higher when baseline cognition was both low and high. The negative relationship between baseline cognition and delirium severity for the first spline and positive relationship with the second spline led to MDAS scores of 14 (95% CI 10 to 19) points at z-score = −2 and MDAS of score 7.9, 95% CI 4.9 to 11 at z-score = +2) (Fig. 2). The lowest MDAS severity scores were seen in those at the midpoint of baseline cognition (z-score = 0).
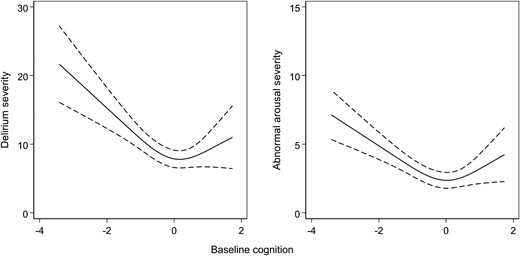
Variation in delirium severity and abnormal arousal and baseline cognition.Left: Delirium severity measured by MDAS scores. Right: Abnormal arousal severity measured by OSLA scores. Restricted cubic splines fitted across the range of baseline cognition (z-scores), defined by the TICS-m and augmented by two verbal fluency tasks.
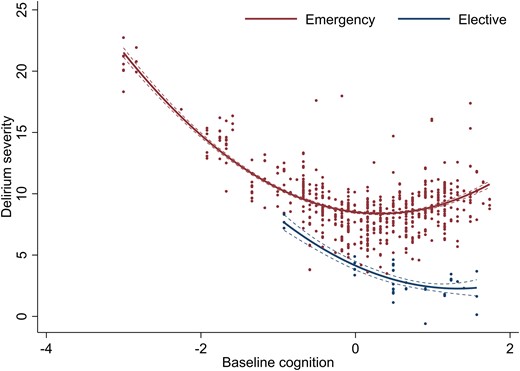
Variation in delirium severity and baseline cognition, stratified by admission type. Delirium severity measured by MDAS scores. Quadratic terms fitted across the range of baseline cognition (z-scores), defined by the TICS-m and augmented by two verbal fluency tasks.
Delirium severity, by setting and/or possible aetiology, before and after adjustment by baseline cognition
| Adjustment per aetiology/setting | Multivariable adjustment | |||||||
|---|---|---|---|---|---|---|---|---|
| β | 95% CI | P | β | 95% CI | P | |||
| Cognition (first spline) | −5.00 | −7.11 | −2.89 | <0.01 | −4.56 | −6.53 | −2.59 | <0.01 |
| Cognition (second spline) | 4.81 | 2.11 | 7.52 | <0.01 | 4.34 | 1.73 | 6.96 | <0.01 |
| Elective admission | −4.83 | −6.85 | −2.81 | <0.01 | −2.95 | −5.91 | −0.34 | 0.03 |
| Elective × cognition (second spline) | – | – | – | −2.10 | −3.92 | −0.27 | 0.03 | |
| Cognition (first spline) | −4.97 | −7.07 | −2.87 | <0.01 | – | – | – | |
| Cognition (second spline) | 4.94 | 2.21 | 7.67 | <0.01 | – | – | – | |
| CRP ≥20 mg/l | 1.33 | −0.01 | 2.68 | 0.05 | 2.28 | 0.75 | 3.81 | <0.01 |
| Cognition (first spline) | −4.99 | −7.08 | −2.89 | <0.01 | – | – | – | |
| Cognition (second spline) | 4.92 | 2.18 | 7.66 | <0.01 | – | – | – | |
| White cell count | ||||||||
| ȃ< 4 × 10⁹ cells/l | −3.10 | −6.08 | −0.12 | 0.04 | −3.37 | −6.74 | −0.27 | 0.03 |
| ȃ4–11 × 109 cells/l | – | – | – | – | – | |||
| ȃ≥11 × 109 cells/l | −0.48 | −1.36 | 0.41 | 0.29 | −2.00 | −4.00 | −0.52 | 0.01 |
| Cognition (first spline) | −4.87 | −6.92 | −2.82 | <0.01 | – | – | – | |
| Cognition (second spline) | 4.77 | 2.08 | 7.45 | <0.01 | – | – | – | |
| Acute kidney injury | −1.35 | −4.17 | 1.47 | 0.35 | −1.89 | −4.48 | 0.69 | 0.15 |
| Cognition (first spline) | −4.88 | −6.92 | −2.85 | <0.01 | – | – | – | |
| Cognition (second spline) | 4.73 | 2.01 | 7.45 | <0.01 | – | – | – | |
| Haemoglobin <100 g/l | 0.61 | −1.14 | 2.35 | 0.50 | 0.64 | −1.38 | 2.66 | 0.53 |
| Cognition (first spline) | −4.96 | −6.94 | −2.98 | <0.01 | – | – | – | |
| Cognition (second spline) | 4.70 | 2.02 | 7.38 | <0.01 | – | – | – | |
| Sodium | ||||||||
| ȃ<125 mM/l | 8.58 | 4.35 | 12.80 | <0.01 | 8.72 | 4.48 | 13.0 | <0.01 |
| ȃ125–135 mM/l | 1.31 | −0.67 | 3.28 | 0.19 | 1.07 | −0.84 | 2.97 | 0.27 |
| ȃ135–145 mM/l | – | – | – | – | – | – | ||
| ȃ≥145 mM/l | 0.77 | −0.14 | 1.68 | 0.10 | 1.49 | 0.03 | 2.95 | 0.05 |
Coefficients represent MDAS points (out of 30). First spline = restricted cubic spline describing first slope for lower cognition towards an inflection midpoint (knot). Second spline = restricted cubic spline describing second slope for higher cognition after an inflection midpoint (knot). All multivariable estimates also adjusted by age, sex, frailty index and NEWS (coefficients not shown). Acute kidney injury derived by algorithm from NHS England https://www.england.nhs.uk/wp-content/uploads/2014/06/psa-aki-alg.pdf. CRP = C-reactive protein.
Sensitivity analyses with disorientation and short-term memory items removed from the MDAS showed similar a similar bimodal distribution of scores (Supplementary Table 3 and Supplementary Fig. 3).
Baseline cognition and abnormal arousal
The relationship between baseline cognition and abnormal arousal followed a comparable pattern. At the extremes of baseline cognition, OSLA scores were higher (OSLA 6.2, 95% CI 4.8 to 7.6 points at z-score = −2; OSLA 5.2, 95% CI 3.7 to 6.6 at z-score = + 2) (Fig. 2). Again, the lowest OSLA scores were recorded in those with baseline cognition z-scores of 0.
Hospital setting and delirium severity
Elective admissions were associated with lower MDAS scores (Table 3). There was an interaction between higher baseline cognition (second spline) and elective status. This effect countered the positive base coefficient (β = 4.3, 95% CI 1.7 to 7.0) with negatively sloping estimates (elective β = −3.0, 95% CI −5.9 to −0.34; interaction β = −2.1, 95% CI −3.9 to −0.27) (Table 3). Together, this meant the relationship between baseline cognition and delirium severity was linear in elective, but not emergency settings (Fig. 3). Surgical admissions (regardless of elective or emergency status) were also associated with lower MDAS scores (−3.4 points, 95%CI −6.2 to −0.5, P = 0.02) (Supplementary Table 4). However, on further adjustment by elective or emergency setting, this association was no longer significant.
Aetiology and delirium severity
In all cases, adjusting for possible aetiological precipitants derived from laboratory results contemporaneous with delirium assessments did not alter the underlying relationship between baseline cognition and MDAS scores (Table 3). In mutually adjusted models, CRP above ≥20 mg/l and severe hyponatraemia (Na < 125 mM/l) were associated with increased delirium severity. Lower and higher total white cell counts (outside the range 4–11 × 109 cells/l) were associated with lower MDAS scores. Concurrent acute kidney injury or anaemia was not related to delirium severity (Table 3).
Discussion
For the first time in a sample of unscheduled admissions, we showed that baseline cognition had a bimodal relationship with delirium severity and abnormal arousal, even after accounting for conventional physiological measures of illness severity, laboratory indicators of aetiologies and frailty. That is, emergency patients with both low and higher baseline cognition had a higher severity of delirium. This was not the case for the small number of elective admissions, where the more established linear relationship between baseline cognition and delirium severity was evident. Higher delirium severity scores in those with poorer baseline cognition were not confounded by pre-existing cognitive impairment. Delirium severity and abnormal arousal were closely related at all levels of cognition. Our results indicate that when acute illness is sufficient to lead to delirium, different factors may be at play across the range of baseline cognitive function. In the context of higher baseline cognition, the presence of delirium could be an important indicator of acute illness in older people, over and above physiological indices such as NEWS (insofar as NEWS may be specific in older people but not be sensitive), because delirium severity likely predicts worse outcomes.33
Our data should be interpreted in the context of some limitations. Despite comprehensive methods to identify hospitalized participants, there is inevitably a degree of selection bias that would have missed cases who developed delirium but remained in the community, and a small number of hospitalizations may have occurred in acute hospitals outside a participant’s usual residence. Although we had the advantage of frequent clinical assessments, we made assumptions about missing data on delirium status over weekends and public holidays. Our exploration of possible differences attributable to underlying aetiology was limited to major categories that could be readily operationalized from laboratory abnormalities. A more comprehensive approach is an area of ongoing analysis, which includes possible effects related to medication use and a more detailed assessment of the temporal relationships between each factor and their interactions. In common with other observational studies, residual confounding may affect some of the estimates. Nonetheless, the prospective capture of brain symptoms before and during acute illness allows for the most systematic mapping of baseline cognition, hospitalization and delirium in a population-representative sample to date.
In respect to other studies, in a cohort admitted to ICU, the IQCODE, a retrospective estimate of pre-morbid cognitive impairment, was linked to different delirium trajectories in critical illness: baseline cognitive impairment was associated with worsening delirium severity.34 As with elective surgical patients, however, the spectrum of pre-existing cognitive impairment was narrower compared with our data. In a study of general medical hospitalizations, a retrospective chart-based diagnosis of dementia was associated with a higher peak delirium severity score.19 The only other study to prospectively ascertain delirium in unselected hospitalizations, the Delirium and Cognitive Impact in Dementia study, found that lower baseline MMSE scores were associated with binary delirium risk; the relationship with severity was not assessed.20 There have not been previous reports linking high baseline cognition with more severe delirium or greater arousal abnormalities.33,34 Our findings in respect of aetiology are also broadly consistent with other studies examining the relative contributions of delirium precipitants on outcomes.35,36 Although all of the associations in our current study adjusted for acute illness severity, NEWS may be an insufficient measure in older people, at both the lowest and highest ends of the baseline cognitive spectrum. The idea that changes in behaviour and cognition, such as delirium itself, could be the sole or at least the predominant feature of acute illness has been observed in COVID-19, leading to the proposal that it be incorporated into the case definition for older adults.37 Work on clinical outcomes after delirium in people with different levels of baseline cognition will investigate the degree to which delirium is a better marker of acute illness compared with standard physiological metrics.
Overall, these data have several potential implications for clinical care. In people with delirium, early assessment of pre-delirium cognitive function, such as with IQCODE, could assist in identifying those at risk of severe delirium. This is important because severe delirium involves a higher risk of distress and future post-traumatic stress symptoms.38 In those with higher baseline cognition, recall of distressing delirium symptoms may be more likely, warranting consideration of follow-up. The novel observation that patients with higher baseline cognition tended to have more severe delirium could also prompt enhanced management given the relatively worse long-term cognitive outcomes for these patients.7 Abnormal arousal, commonly present in severe delirium, may also lead to more patient safety issues: longer length of stay, greater rehabilitation needs, reduced bulbar function and aspiration pneumonia and inpatient falls. For those with lower baseline cognition, family and carer education may mitigate this through better recognition of the specific links between abnormal arousal and delirium. For example, this could be a focus for patients recently diagnosed with dementia in the memory clinic. Such patients have a 50% risk of being admitted acutely in the next 12 months and public understanding of delirium is suboptimal.39–41
In conclusion, worse baseline cognition increases the risk of delirium. In patients who develop delirium, low and high baseline cognition are linked with a higher severity of delirium. The relationship between baseline cognition and delirium severity advocates for assessment of baseline cognition in patients with delirium, even if this must be retrospectively obtained using informant tools. Additionally, in patients with risk of severe delirium enhanced evaluation of causes and delirium symptoms such as distress may be warranted.
Funding
DELPHIC (Delirium and Population Health Informatics Cohort) is supported by the Wellcome Trust through a fellowship award to D.D. (WT107467). The MRC Unit for Lifelong Health and Ageing at UCL received core funding through the Medical Research Council (MC_UU_00019/1; MC_UU_00019/2). A.T. is funded through an Alzheimer’s Society clinical research training fellowship. S.D.S. receives funding from the Dalhousie Medical Research Foundation. K.R. receives career support from the Dalhousie Medical Research Foundation as the Kathryn Allen Weldon Professor of Alzheimer Research.
Competing interests
K.R. is President and Co-founder of Ardea Outcomes, which in the last 3 years (as DGI Clinical) has contracts with pharma and device manufacturers (Shire, Hollister, Nutricia, Roche, Otsuka) on individualized outcome measurement. Otherwise, any personal fees are for invited guest lectures and academic symposia, received directly from event organizers, chiefly for presentations on frailty. He is Associate Director of the Canadian Consortium on Neurodegeneration in Aging, which is funded by the Canadian Institutes of Health Research, and with additional funding from the Alzheimer Society of Canada and several other charities. He receives career support from the Dalhousie Medical Research Foundation as the Kathryn Allen Weldon Professor of Alzheimer Research, and research support from the Canadian Institutes of Health Research, The Canadian Frailty Network, the QEII Health Science Centre Foundation, the Nova Scotia Health Research Fund and the Fountain Family Innovation Fund of the QEII Health Science Centre Foundation. N.C. is remunerated for her membership of a data safety and monitoring committee of a trial sponsored by AstraZeneca. The remaining authors declare no competing interests.
Supplementary material
Supplementary material is available at Brain online.

