


Abstract
Charcot-Marie-Tooth disease (CMT) due to GJB1 variants (CMTX1) is the second most common form of CMT. It is an X-linked disorder characterized by progressive sensory and motor neuropathy with males affected more severely than females. Many reported GJB1 variants remain classified as variants of uncertain significance (VUS).
In this large, international, multicentre study we prospectively collected demographic, clinical and genetic data on patients with CMT associated with GJB1 variants. Pathogenicity for each variant was defined using adapted American College of Medical Genetics criteria. Baseline and longitudinal analyses were conducted to study genotype-phenotype correlations, to calculate longitudinal change using the CMT Examination Score (CMTES), to compare males versus females, and pathogenic/likely pathogenic (P/LP) variants versus VUS.
We present 387 patients from 295 families harbouring 154 variants in GJB1. Of these, 319 patients (82.4%) were deemed to have P/LP variants, 65 had VUS (16.8%) and three benign variants (0.8%; excluded from analysis); an increased proportion of patients with P/LP variants compared with using ClinVar’s classification (74.6%). Male patients (166/319, 52.0%, P/LP only) were more severely affected at baseline. Baseline measures in patients with P/LP variants and VUS showed no significant differences, and regression analysis suggested the disease groups were near identical at baseline. Genotype-phenotype analysis suggested c.-17G>A produces the most severe phenotype of the five most common variants, and missense variants in the intracellular domain are less severe than other domains. Progression of disease was seen with increasing CMTES over time up to 8 years follow-up. Standard response mean (SRM), a measure of outcome responsiveness, peaked at 3 years with moderate responsiveness [change in CMTES (ΔCMTES) = 1.3 ± 2.6, P = 0.00016, SRM = 0.50]. Males and females progressed similarly up to 8 years, but baseline regression analysis suggested that over a longer period, females progress more slowly. Progression was most pronounced for mild phenotypes (CMTES = 0–7; 3-year ΔCMTES = 2.3 ± 2.5, P = 0.001, SRM = 0.90).
Enhanced variant interpretation has yielded an increased proportion of GJB1 variants classified as P/LP and will aid future variant interpretation in this gene. Baseline and longitudinal analysis of this large cohort of CMTX1 patients describes the natural history of the disease including the rate of progression; CMTES showed moderate responsiveness for the whole group at 3 years and higher responsiveness for the mild group at 3, 4 and 5 years. These results have implications for patient selection for upcoming clinical trials.
Introduction
CMTX1, the second most common form of Charcot-Marie-Tooth Disease (CMT), is caused by variants in gap junction beta-1 (GJB1), encoding the gap junction protein connexin 32 (Cx32).1 It is X-linked with males typically more severely affected than females, who may be minimally symptomatic, or asymptomatic. The phenotype is a length-dependent sensory and motor neuropathy with ‘intermediate’ motor nerve conduction velocities (30–40 m/s) for males, and ranging from intermediate to the axonal range in females.2,3 Other clinical features include prominent median nerve involvement,4 patchy conduction slowing,5,6 and occasional CNS manifestations ranging from asymptomatic white matter lesions to stroke-like episodes.7 Cx32 is part of a homologous family of connexins forming channels between apposed membranes of adjacent cells, or in myelinating Schwann cells, in opposed membranes of the same cell. Cx32 is expressed in Schwann cells and oligodendrocytes. Hexamers of Cx32 form a hemichannel (connexon) with a central pore, which when opposed together with a second hemichannel, form functional channels.8 This allows transport of small molecules, whilst preventing passage of larger proteins. A cluster of channels is termed a gap junction plaque.9 There is a spectrum of loss of channel function demonstrated in functional studies of Cx32 mutants, although disease mechanisms for many variants are not completely understood.9–15 Variants implicated in disease include missense, nonsense, frameshift16 and non-coding variants,17 as well as deletions of the entire coding region of the gene.18 However, many variants within the gene are classified as variant of uncertain significance (VUS), primarily because they are private to a single family and there is no functional evidence to support pathogenicity for most variants.
Preclinical gene therapy trials in CMTX1 mouse models are promising.19–21 To optimize future clinical trial design, we undertook this study to increase the number of variants classified as pathogenic/likely pathogenic and to define the natural history of CMTX1.
Materials and methods
Patients, study design and ethics
Patients with genetically confirmed or probable CMT were recruited through the Inherited Neuropathy Consortium (INC, ClinicalTrials.gov identifiers: NCT01193075, NCT01193088 and NCT01203085) at one of 21 INC sites in USA, UK, Italy and Australia between 2009 and 2022. Probable CMT was diagnosed in individuals without molecular diagnosis based on clinical features of a slowly progressive neuropathy without acquired cause, where CMT was the most likely diagnosis at the discretion of the recruiting specialist. Individuals for this study were identified by carrying a variant in GJB1. Ethical approval was obtained at each institution and all participants signed informed consent forms. Demographic, clinical and genetic data were collected at the baseline assessment and prospectively on an annual basis.
Clinical outcome measures
The outcome measures used included the CMT Examination Score (CMTES), CMT Neuropathy Score (CMTNS) and their Rasch-modified equivalents as described in previous INC studies.4,22–26 Both scales have shown excellent inter- and intra-rater reliability for different types of CMT including CMTX1.22 A Rasch-weighted modification of the CMTES and CMTNS (CMTES-R, CMTNS-R) has been shown to increase the responsiveness for detecting disease progression in CMT1A,23,24 although not in CMT2A or MPZ-associated CMT.25,26 Clinical assessors were formally trained in performing the CMTES and CMTNS. In addition, where possible, clinical history, examination, neurophysiology and a ‘minimal data set’ questionnaire, consisting of pre-specified clinical and paraclinical fields, were undertaken at each visit.
GJB1 variant curation
For this study we classified variants according to the internationally recognised American College of Medical Genetics (ACMG) criteria27 with accompanying adaptations proposed by the Association for Clinical Genomic Science (ACGS).28 As suggested by both guidelines, we adapted the criteria specifically for GJB1 variants causing CMTX1. Variant classification by these adapted ACMG/ACGS criteria will be referred to as ‘our classification’ throughout the paper, to differentiate them from the ClinVar classification (as listed on 31 July 2022), to which we also refer. The full criteria used in this study are given in Supplementary Table 1. Examples of our adaptations to ACMG/ACGS criteria include the following:
considering population data, moderate support is given to a variant when it is absent from, or occurs at a frequency considered compatible with a dominantly inherited disease, in the Genome Aggregation Database (GnomAD, https://gnomad.broadinstitute.org/). Using methods previously proposed,29,30 considering CMTX1 a dominant disease with reduced penetrance owing to females being variably affected, the maximum tolerated allele frequency for a moderate level of support (PM2) is 4.16 × 10⁻⁶, corresponding to a count of two heterozygous carriers and one hemizygous carrier in both GnomAD version 2 (GnomADv2) and version 3 (GnomADv3). Conversely, an allele count of ≥4 in either version of GnomAD is too common to be seen in the population and is strong evidence for a benign variant (BS1).25,30
a comprehensive literature review of the Inherited Neuropathy Variant Browser (https://neuropathybrowser.zuchnerlab.net/#/),31 ClinVar (https://www.ncbi.nlm.nih.gov/clinvar/),32 PubMed (https://pubmed.ncbi.nlm.nih.gov/) and The Human Gene Mutation Database (HGMD®, https://www.hgmd.cf.ac.uk/ac/index.php)33 identified previous reports of variants.
in silico prediction tools are never used as more than supporting evidence (PP3). However, in this study we employed an ensemble tool (rare exome variant ensemble learner, REVEL) combining 13 individual predictive tools, which has shown superior performance at determining pathogenic and benign variants compared with stand-alone tests.30,34
missense constraint metrics have evolved in recent years and now include extensive mapping of constrained exonic regions of genes rather than considering genes as a whole.35–37 The most widely used tool is depicted in Decipher (https://www.deciphergenomics.org/browser) for every gene in its catalogue, and based upon a framework of regional constraint of coding regions of genes.38 By this method, and in accordance with clinical experience, GJB1 is constrained to missense variation, and supporting evidence (PP2) can be applied throughout the gene.39
specificity of phenotype (PP4) is the criterion frequently lacking from variant classification in service laboratories. We employed this criterion only for stand-alone males or families including males if the following were found: (a) Clinical features fit CMTX1 including neurophysiology showing intermediate velocities in the range 30–40 m/s in the upper limb in males, and >30 m/s in females, males being more severely affected than females in families large enough to determine this; and (b) appropriate prior genetic testing (Supplementary Table 1).
Statistical analysis
Analysis was carried out using IBM Statistical Package for the Social Sciences (SPSS) Statistics software version 27. Data distribution was assessed for normalness using the Shapiro-Wilk test and analysing skewness, kurtosis, median, mean and mode. Baseline data comparison between two groups (males and females) or multiple groups (genotype-phenotype analysis) for categorical variables was carried out with a chi-squared (χ2) test for normally distributed data. A two-tailed Fisher’s exact test was used for non-normally distributed data or data that violated assumptions required for χ2 test. Post hoc analysis for significance, when comparing multiple groups, was carried out with Bonferroni correction adjusting for multiple comparisons. Comparison of means of continuous variables between two groups at baseline was carried out with an independent sample two-tailed t-test, or Mann-Whitney U-test as appropriate. Equivalent comparison for multiple groups at baseline was carried out with a one-way ANOVA or Kruskal Wallis (one-way non-parametric ANOVA) test if appropriate. Adjusting means to account for covariates, used analysis of covariance (ANCOVA). Correlation coefficients for age against CMTES were calculated using Spearman’s rank for non-normally distributed data, and line of best fit plotted using a simple linear regression. Longitudinal analysis of paired samples with continuous variables was performed with a paired sample two-tailed t-test. Responsiveness to detecting change over time in CMTES and CMTES-R scores was assessed using standardized response mean (SRM). A SRM value of 0.2–0.49 is considered ‘low’, 0.5–0.79 ‘moderate’, and >0.8 ‘high’ responsiveness.40 Statistical significance was taken as P ≤ 0.05 unless stated otherwise.
Data availability
The data that support the findings of this study are available from the corresponding author, upon reasonable request. The data are not publicly available since they contain information that could compromise the privacy of research participants.
Results
Four hundred and twenty-one patients from 324 families with CMT were identified as having a variant in GJB1. Complete variant information was available for 388 patients from 296 families. One patient was excluded: a male aged 15 years without neuropathy clinically or neurophysiologically, presenting with a CNS episode. We classified variants using adapted ACMG/ACGS criteria, as described above. The main adaptations were use of disease-specific allele frequency assessment, segregation and clinical data; the latter two are often not available to genetic diagnostic laboratories. One hundred and fifty-seven different variants were seen across the cohort, although members of two families each carried two GJB1 variants. For the purposes of longitudinal analysis these were considered a single ‘combined variants’. Excluding the male patient without neuropathy, this left 387 patients from 295 families harbouring 154 variants.
GJB1 variant classification and distribution
Numbers of variants by pathogenicity classification can be seen in Table 1 and each individual variant and classification in Supplementary Table 4. Pathogenic and likely pathogenic variants are considered together and for simplicity will be denoted ‘pathogenic’, similarly benign and likely benign will be denoted ‘benign’. We classified 109 (70.8%) variants as pathogenic from 244 (82.7%) families, 42 (27.3%) as VUS from 48 (16.3%) families, and three (1.9%) variants as benign from three (1.0%) families in our cohort. A comparison of the numbers assigned to each pathogenicity group in our study with those assigned by ClinVar is shown in Table 1. Considering the relative proportions of variants in each category (noting that 37 variants from 53 patients and 39 families do not have a ClinVar entry), the percentage VUS is greater using ClinVar’s classification (41.9% of variants from 25.4% of families) compared with our classification (27.3% of variants from 16.3% of families) and accordingly there are more variants classified as pathogenic in this study (70.8% of variants from 82.7% of families) compared with ClinVar (58.1% of variants from 74.6% of families). There were no benign variants according to ClinVar. Clinical data from patients with benign variants is not considered in any analysis and the ‘whole cohort’ refers to pathogenic variants and VUS.
Number of variants by different classification methods
| Patients | Families | Variants | ||
|---|---|---|---|---|
| TOTAL | 387 | 295 | 154 | |
| This study | P/LP, n (%) | 319 (82.4) | 244 (82.7) | 109 (70.8) |
| VUS/conflicting, n (%) | 65 (16.8) | 48 (16.3) | 42 (27.3) | |
| Benign/likely benign, n (%) | 3 (0.8) | 3 (1.0) | 3 (1.9) | |
| ClinVar | P/LP, n (%) | 249 (74.6) | 191 (74.6) | 68 (58.1) |
| VUS/conflicting, n (%) | 85 (25.4) | 65 (25.4) | 49 (41.9) | |
| Benign/likely benign, n (%) | 0 | 0 | 0 | |
| No ClinVar entry, n | 53 | 39 | 37 | |
Denominator for ClinVar percentages is the sum of variants with a ClinVar entry. n = number of individuals/families/variants; P/LP = pathogenic/likely pathogenic; VUS = variant of uncertain significance.
Patients carrying the seven most common variants c.-17G>A (14 patients from seven families), p.Arg15Gln (14, 10), p.Glu102Gly (14, 13), p.Arg220Ter (12, 12), p.Arg22Ter (11, 7), c.-103C>T (10, 4) and p.Arg107Trp (10, 9) account for 22.0% of the cohort (85/387). Our cohort contains 28 previously unreported variants (13 of which we classified as pathogenic), including 14 missense, seven nonsense, five 5′UTR variants, and two in-frame insertion/deletions (Supplementary Table 4). The variants p.Gly21Asn and p.Met162Thr are carried by members of one family and both classified as VUS; the combined variant is classified as VUS. Variants p.Thr269Asn and p.X284Ser are found in cis in a second family. The missense is a VUS, but the stop-loss variant is likely-pathogenic, thus this combined variant considered likely-pathogenic. The variant p.Met150Val is also novel but not included in the analysis as the male patient did not have neuropathy, and presented with a CNS syndrome. All three variants classified as benign (c.-311C>T, p.Val13Met and p.Arg264Cys) are present in the GnomAD database. Two of these three variants are reported previously, although either without clinical data or with a phenotype not consistent with CMTX1.16,41,42 In contrast to our study, ClinVar classifies p.Val13Met as pathogenic/likely pathogenic (P/LP). The distribution of Cx32 coding variants from this study are shown in Fig. 1. Like previous studies, variants are seen throughout the coding region of the gene and its corresponding protein,4 although we did not identify pathogenic missense variants in the C-terminal domain of the protein (Fig. 1).
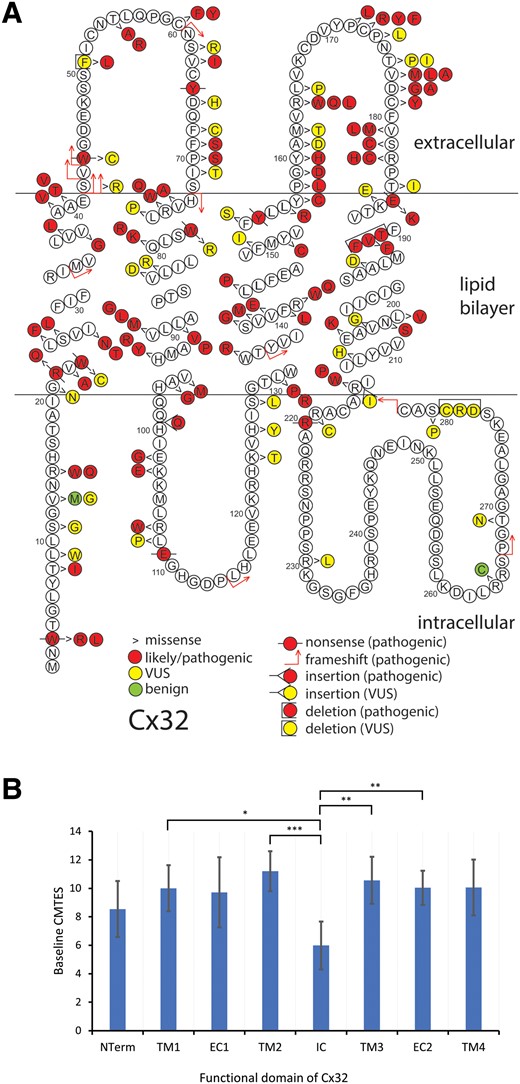
Schematic of Cx32 amino acid sequence demonstrating 146 individual coding variants described in this study (A) and mean age-adjusted baseline CMTES for pathogenic/likely pathogenic missense variants by structural domain of the Cx32 (B). (A) Pathogenic/likely pathogenic variants are depicted in red, variant of uncertain significance (VUS) in yellow and benign variants in green. Variant types are delineated as shown in the key. There are 10 frameshift, 10 nonsense, 120 missense, five in-frame deletions/insertions, and one stop-lost; the 10 non-coding variants are not shown. The variants for the two families harbouring two variants each, are here depicted separately. (B) Error bars indicate 95% confidence interval. NTerm = N-terminus, amino acids (AA) 0–20; TM1 = first transmembrane domain, AA 21–41; EC1 = first extracellular domain, AA 42–72; TM2 = second transmembrane domain, AA 73–97; IC = intracellular cytoplasmic domain, AA 98–128; TM3 = third transmembrane domain, AA 129–157; EC2 = second extracellular domain, AA 158–185; TM4 = fourth transmembrane domain, AA 186–215. There were no pathogenic/likely pathogenic missense variants in the C terminal domain. *Significance at <0.05, ** < 0.01, *** < 0.001. Analysis of covariance (ANCOVA) used with post hoc P-values adjusted for Bonferroni correction.
Baseline characteristics of cohort overall and by variant class
Overall baseline data and comparison of baseline data by genetic variant class and by sex are shown in Table 2. For the whole cohort, mean age at recruitment was 40.6 ± 17.0 years and 53.4% (205/384) were male. Patients (74.5%, 284/381) had walking difficulty, 78.0% (288/369) had foot deformity, 20.9% (80/383) had foot surgery and 11.0% (41/372) had scoliosis, all in keeping with values previously published.4 Orthotics were required by 58.9% (225/382) and 12.5% (47/376) needed an assistive device to walk. Baseline CMTES and CMTNS were 9.7 ± 4.7 and 13.7 ± 6.2, respectively, again similar to previous studies when adjusted for age.2,4
Baseline characteristics of cohort overall, by variant classification and by sex
| Overall | Pathogenic/Likely pathogenic | VUS | P | Male | Female | P | |
|---|---|---|---|---|---|---|---|
| Patients, n (%) | 384 | 319 (83.1) | 65 (16.9) | – | 166 (52.0) | 153 (48.0) | – |
| Male, n (%) | 205/384 (53.4) | 166/319 (52.0) | 39/65 (60.0) | 0.241 | – | – | – |
| Age at recruitment, mean, years ± SD (n) | 40.6 ± 17.0 (383) | 40.6 ± 17.3 (318) | 40.3 ± 15.8 (65) | 0.904 | 37.5 ± 17.2 (165) | 44.0 ± 16.9 (153) | 0.001 |
| Age of lower limb symptom onset, mean, years ± SD (n) | 20.1 ± 14.5 (323) | 19.9 ± 14.3 (272) | 20.9 ± 15.4 (51) | 0.742 b | 16.2 ± 11.4 (153) | 24.7 ± 16.2 (119) | <0.00001b |
| Walked before 15 months, % (n) | 88.7 (275/310) | 87.4 (221/253) | 94.7 (54/57) | 0.111 | 82.7 (110/133) | 92.5 (111/120) | 0.019 |
| Foot deformity, % (n) | 78.0 (288/369) | 78.5 (244/311) | 75.9 (44/58) | 0.661 | 84.5 (136/161) | 72.0 (108/150) | 0.008 |
| Foot surgery, % (n) | 20.9 (80/383) | 22.3 (71/318) | 13.8 (9/65) | 0.125 | 28.3 (47/166) | 15.8 (24/152) | 0.007 |
| Hand surgery, % (n) | 6.1 (21/346) | 6.3 (18/287) | 5.1 (3/59) | 1.000a | 7.6 (11/145) | 4.9 (7/142) | 0.353 |
| Scoliosis, % (n) | 11.0 (41/372) | 10.9 (34/313) | 11.9 (7/59) | 0.822 | 10.5 (17/162) | 11.3 (17/151) | 0.828 |
| Hip dysplasia, % (n) | 1.9 (7/361) | 2.3 (7/302) | 0.0 (0/59) | 0.604a | 2.5 (4/161) | 2.1 (3/141) | 1.000a |
| Sural nerve biopsy, % (n) | 2.8 (9/327) | 3.3 (9/272) | 0.0 (0/55) | 0.366a | 1.3 (2/149) | 5.7 (7/123) | 0.083a |
| Difficulty walking, % (n) | 74.5 (284/381) | 75.3 (238/316) | 70.8 (46/65) | 0.443 | 85.5 (141/165) | 64.2 (97/151) | 0.00001 |
| Difficulty with balance, % (n) | 82.3 (311/378) | 83.1 (260/313) | 78.5 (51/65) | 0.376 | 86.7 (143/165) | 79.1 (117/148) | 0.073 |
| Orthotics, % (n) | 58.9 (225/382) | 60.6 (192/317) | 50.8 (33/65) | 0.144 | 68.5 (113/165) | 52.0 (79/152) | 0.003 |
| Walking support, % (n) | 12.5 (47/376) | 12.5 (39/313) | 12.7 (8/63) | 0.958 | 16.0 (26/162) | 8.6 (13/151) | 0.046 |
| Wheelchair use, % (n) | 3.0 (11/369) | 2.9 (9/306) | 3.2 (2/63) | 1.000a | 2.5 (4/157) | 3.4 (5/149) | 0.745a |
| Difficulty with buttons, % (n) | 71.4 (272/381) | 71.2 (225/316) | 72.3 (47/65) | 0.858 | 76.4 (126/165) | 65.6 (99/151) | 0.034 |
| Difficulties with eating utensils, % (n) | 28.1 (106/377) | 27.6 (86/312) | 30.8 (20/65) | 0.601 | 33.5 (55/164) | 20.9 (31/148) | 0.013 |
| Optic atrophy, % (n) | 0.0 (0/123) | 0.0 (0/97) | 0.0 (0/26) | na | 0.0 (0/52) | 0.0 (0/45) | na |
| Hearing loss, % (n) | 1.8 (2/114) | 1.1 (1/89) | 4.0 (1/25) | 0.392a | 0.0 (0/49) | 2.5 (1/40) | 0.449a |
| Ulnar MNCV, mean, m/s ± SD (n) | 42.3 ± 8.8 (166) | 42.3 ± 8.7 (139) | 41.9 ± 9.1 (27) | 0.796b | 35.8 ± 6.4 (63) | 47.8 ± 6.4 (76) | <0.00001b |
| Median MNCV, mean, m/s ± SD (n) | 39.5 ± 9.2 (128) | 39.6 ± 9.3 (105) | 39.2 ± 9.4 (23) | 0.866 | 34.1 ± 7.3 (39) | 42.8 ± 8.8 (66) | <0.00001b |
| Ulnar CMAP, mean, mV ± SD (n) | 5.4 ± 3.0 (168) | 5.3 ± 2.9 (141) | 5.5 ± 3.6 (27) | 0.940b | 4.0 ± 2.9 (64) | 6.4 ± 2.4 (77) | <0.00001b |
| Median CMAP, mean, mV ± SD (n) | 4.3 ± 3.4 (136) | 4.4 ± 3.5 (111) | 3.8 ± 3.2 (25) | 0.470b | 2.6 ± 2.8 (42) | 5.5 ± 3.4 (69) | <0.00001b |
| CMTES ± SD (n) | 9.7 ± 4.7 (367) | 9.6 ± 4.8 (306) | 10.0 ± 4.2 (61) | 0.507b | 10.9 ± 4.8 (156) | 8.3 ± 4.5 (150) | <0.00001b |
| CMTNS ± SD (n) | 13.7 ± 6.2 (166) | 13.6 ± 6.3 (140) | 13.8 ± 5.3 (26) | 0.924 | 16.6 ± 6.2 (67) | 10.9 ± 5.3 (73) | <0.00001b |
| CMTES-R ± SD (n) | 13.3 ± 6.3 (366) | 13.3 ± 6.5 (305) | 13.7 ± 5.5 (61) | 0.646b | 15.0 ± 6.3 (155) | 11.5 ± 6.2 (150) | <0.00001b |
| CMTNS-R ± SD (n) | 17.7 ± 7.6 (166) | 17.7 ± 7.8 (140) | 17.8 ± 6.6 (26) | 0.987 | 21.0 ± 7.5 (67) | 14.7 ± 6.8 (73) | <0.00001b |
Significant P-values highlighted in bold. SD = standard deviation; MNCV = motor nerve conduction velocity; CMAP = compound motor action potential; CMTES(-R) = Charcot-Marie-Tooth examination score (Rasch-modified).
Fisher's exact test used due to small number of expected values.
Mann-Whitney U-test used due to non-normal data distribution.
Demographic and clinical data were compared for pathogenic variants and VUS. Most patients had pathogenic variants (83.1%, 319/384) compared with VUS (16.9%, 65/384). Across all comparators there were no statistically significant differences between the two groups. Nearly identical mean values were seen for age at recruitment (40.6 ± 17.3 years, versus 40.3 ± 15.8 years), age of lower limb symptom onset (19.9 ± 14.3 years versus 20.9 ± 15.4 years), ulnar motor nerve conduction velocity (MNCV; 42.3 ± 8.7 m/s versus 41.9 ± 9.1 m/s), median MNCV (39.6 ± 9.3 m/s versus 39.2 ± 9.4 m/s), ulnar compound motor action potential (CMAP; 5.3 ± 2.9 mV versus 5.5 ± 3.6 mV), CMTES (9.6 ± 4.8 versus 10.0 ± 4.2) and CMTNS (13.6 ± 6.3 versus 13.8 ± 5.3) for pathogenic variants and VUS, respectively. Such tight concordance between the two groups suggests there is no difference between them in terms of demographic and clinical parameters and raises the possibility that the VUS may be pathogenic if more data were available on them.
Baseline characteristics by sex
Comparison of baseline data by sex is shown in Table 2. Of the patients, 52.0% (166/319) were male, and as published previously,4 significant differences between males and females are seen in most clinical measures. Mean age at recruitment (37.5 ± 17.2 years versus 44.0 ± 16.9 years) and age of lower limb symptoms onset (16.2 ± 11.4 years versus 24.7 ± 16.2 years) are both lower in males. Difficulty with walking (85.5% versus 64.2%), the need for orthotics (68.5% versus 52.0%) and for walking aids (16.0% versus 8.6%) are more frequent in males whereas wheelchair use is rare in both (2.5% and 3.4%). Upper limb symptoms are seen in both groups with males more likely to have difficulty with buttons (76.4% versus 65.6%) and eating utensils (33.5% versus 20.9%). Neurophysiological parameters show highly significant differences between sexes: the mean conduction velocities in ulnar (35.8 ± 6.4 versus 47.8 ± 6.4 m/s) and median (34.1 ± 7.3 versus 42.8 ± 8.8 m/s) motor nerves are markedly slower in males, and the corresponding mean CMAP amplitudes in ulnar (4.0 ± 2.9 versus 6.4 ± 2.4 mV) and median (2.6 ± 2.8 versus 5.5 ± 3.4 mV) nerves are lower in males.3,4,43 The lower values for median versus ulnar CMAP in both groups is reflective of previous studies4,44 and is in line with clinical experience of more prominent median motor involvement.45 Mean CMTES (10.9 ± 4.8 versus 8.3 ± 4.5) and CMTNS (16.6 ± 6.2 versus 10.9 ± 5.3) and their Rasch-weighted equivalents CMTES-R (15.0 ± 6.3 versus 11.5 ± 6.2) and CMTNS-R (21.0 ± 7.5 versus 14.7 ± 6.8) are consistently higher in males indicating greater disease severity compared with females.
Genotype-phenotype correlation at baseline
Baseline age and CMT severity scores for the 65 patients with the five most common GJB1 variants in our cohort (c.-17G>A, p.Arg15Gln, p.Arg22Ter, p.Glu102Gly and p.Arg220Ter) are shown in Supplementary Table 2. The proportion of males was similar and not statistically different across the groups. Age-adjusted comparison of for CMTES and CMTES-R show that the mean CMTES is significantly higher for patients with c.-17G>A (12.3) compared with p.Arg15Gln (8.2, P = 0.036), p.Arg22Ter (8.0, P = 0.047) and p.Glu102Gly (6.5, P = 0.001). Similarly, the age-adjusted mean CMTES-R was significantly higher in patients with c.-17G>A (16.7) compared with p.Arg15Gln (10.7, P = 0.03) and p.Glu102Gly (9.6, P = 0.008).
Next, we examined baseline data comparing pathogenic missense with ‘loss-of function’ (LoF; nonsense or frameshift) and 5′UTR variants. After adjusting for age, there were no significant differences in sex, age, age of onset or any severity measure between these three groups. We then considered pathogenic variants grouped by structural domain, analysing only missense variants in an attempt to remove any effect of severity from the type of variant, rather than its domain (Fig. 1B and Supplementary Table 3).4 There were no significant differences in baseline age at recruitment or sex between the nine domains. CMTES was significantly lower in patients with intracellular domain variants (IC, 6.4 ± 3.8, n = 26) compared with the second transmembrane domain (TM2, 11.2 ± 5.7, n = 37, P = 0.004) and the third transmembrane domain (TM3, 10.7 ± 4.1, n = 27, P = 0.044). CMTES-R was significantly lower in the IC domain (9.4 ± 5.2, n = 25) compared with TM2 (15.4 ± 7.3, n = 37, P = 0.011). When adjusted for age, significant differences were seen in CMTES-R between domains, but most strikingly, significant differences in CMTES were seen between the IC domain (6.0) and TM2 (11.2, P = 0.00013), TM3 (10.6, P = 0.005), the second extracellular domain (EC2, 10.0, n = 51, P = 0.004) and the first transmembrane domain (TM1, 10.0, n = 28, P = 0.024, Fig. 1B).
Overall disease progression using CMTES and CMTES-R
Longitudinal follow-up data in patients with pathogenic variants for CMTES and CMTES-R to 8 years is shown in Table 3 and Fig. 2A. CMTNS (and hence CMTNS-R) data were lacking, with no more than five patients at any given time point, so longitudinal analysis of CMTNS is not reported. CMTES and CMTES-R increase with time with statistically significant change in mean CMTES seen at 1 year (0.6 ± 2.5, P = 0.018), 3 years (1.3 ± 2.6, P = 0.000162), 4 years (0.9 ± 2.5, P = 0.004), 5 years (0.8 ± 2.9, P = 0.038), 7 years (1.1 ± 2.4, P = 0.013) and 8 years (2.0 ± 4.3, P = 0.039) and mean CMTES-R at 1 year (0.8 ± 3.4, P = 0.019), 3 years (1.5 ± 3.4, P = 0.001) and 7 years (1.5 ± 3.1, P = 0.008. All SRM values corresponded to a low responsiveness, except that for the CMTES at 3 years which, at 0.5, corresponded to a moderate responsiveness. Although the change in CMTES-R is generally marginally larger than CMTES at any given time point, this does not correspond to increased responsiveness of the CMTES-R because of its larger standard deviation (SD).
![Disease progression over time for pathogenic/likely pathogenic variants (males and females combined). (A) Mean change in CMTES and CMTES-R [Charcot-Marie-Tooth Examination Score (Rasch-modified)] from baseline. (B) Mean change in CMTES from baseline stratified by baseline disease severity. Error bars indicate 95% confidence intervals. Baseline CMTES stratification: mild = 0–7 (blue), moderate = 8–14 (orange), severe = ≥15 (grey). Patient numbers at each time point in the figures are found in Tables 3 and 4.](https://oup.silverchair-cdn.com/oup/backfile/Content_public/Journal/brain/146/10/10.1093_brain_awad187/1/m_awad187f2.jpeg?Expires=1750473294&Signature=EX3koRPFIJIJFUKEQNLAinMDsA4uefkZtKQMGRSgAZDUKSnyf8Nv4~HCxsWDUGnvcMB57bYwognKRSFRpuHEWafBRk2jZsxQDmb2W6GN~INSDmIWrOemgFUYpvXdTaC0EpV~Ov4AQy-2QksR45w1fHMuiZ65bwfaMI7TDn8vcHGHbD5uixEmdcNQqCXKYBGX~OigI~KfnrThl5zNX7d324PjWQvJcnw-d7OjZ2aAFIkwzA9ilJVXuSg6Dx0xMZYcpYHxx3VNQ~VJc-EiCDuBzx-~dPRa5cdQS8sgdTTLaNiQ2MRaJGzEekMgSHmNyOtwAx6xTdSpYkI4fTUMDj73rQ__&Key-Pair-Id=APKAIE5G5CRDK6RD3PGA)
Disease progression over time for pathogenic/likely pathogenic variants (males and females combined). (A) Mean change in CMTES and CMTES-R [Charcot-Marie-Tooth Examination Score (Rasch-modified)] from baseline. (B) Mean change in CMTES from baseline stratified by baseline disease severity. Error bars indicate 95% confidence intervals. Baseline CMTES stratification: mild = 0–7 (blue), moderate = 8–14 (orange), severe = ≥15 (grey). Patient numbers at each time point in the figures are found in Tables 3 and 4.
Change in CMTES and CMTES-R for patients with pathogenic/likely pathogenic variants by year of follow-up (males and females combined)
| Year of follow-up | n | Mean baseline score ± SD | Mean change ± SD | Q1–Q3 | P | SRM |
|---|---|---|---|---|---|---|
| CMT Examination score (CMTES) | ||||||
| 1 | 107 | 10.3 ± 4.0 | 0.6 ± 2.5 | −1.00–2.00 | 0.018 | 0.23 |
| 2 | 88 | 10.0 ± 4.6 | 0.3 ± 2.6 | −2.00–2.00 | 0.307 | 0.11 |
| 3 | 64 | 9.7 ± 4.1 | 1.3 ± 2.6 | −1.00–3.00 | 0.00016 | 0.50 |
| 4 | 65 | 10.3 ± 4.2 | 0.9 ± 2.5 | −1.00–3.00 | 0.004 | 0.37 |
| 5 | 52 | 10.3 ± 4.7 | 0.8 ± 2.9 | −1.00–3.00 | 0.038 | 0.30 |
| 6 | 27 | 10.6 ± 3.5 | 1.0 ± 2.8 | −1.00–3.00 | 0.091 | 0.34 |
| 7 | 34 | 10.1 ± 5.0 | 1.1 ± 2.4 | −0.25–2.00 | 0.013 | 0.45 |
| 8 | 22 | 9.5 ± 5.6 | 2.0 ± 4.3 | −1.25–3.25 | 0.039 | 0.47 |
| Rasch-modified CMT Examination Score (CMTES-R) | ||||||
| 1 | 107 | 14.2 ± 5.8 | 0.8 ± 3.4 | −1.00–3.00 | 0.019 | 0.23 |
| 2 | 88 | 13.6 ± 6.4 | 0.5 ± 3.4 | −2.00–2.00 | 0.162 | 0.15 |
| 3 | 61 | 13.9 ± 5.3 | 1.5 ± 3.4 | −1.50–4.00 | 0.001 | 0.44 |
| 4 | 64 | 14.3 ± 5.8 | 1.3 ± 3.6 | −1.00–4.00 | 0.006 | 0.36 |
| 5 | 52 | 14.3 ± 6.3 | 1.0 ± 3.8 | −2.00–4.75 | 0.072 | 0.25 |
| 6 | 27 | 14.8 ± 4.4 | 1.3 ± 3.7 | −2.00–4.00 | 0.077 | 0.35 |
| 7 | 34 | 13.9 ± 7.0 | 1.5 ± 3.1 | −1.00–3.25 | 0.008 | 0.49 |
| 8 | 21 | 13.7 ± 7.4 | 1.8 ± 4.1 | −2.00–4.00 | 0.055 | 0.44 |
Significant P-values and SRMs highlighted in bold. Q1–Q3 = interquartile range for change in CMTES or CMTES-R; CMTES(-R) = Charcot-Marie-Tooth examination score (Rasch-modified); SD = standard deviation; SRM = standard response mean.
Disease progression by variant class
We compared the correlation between CMTES and age, as a measure of disease progression, between patients with pathogenic variants (n = 305, ρ = 0.362, P = 7.3 × 10⁻¹¹) and VUS (n = 61, ρ = 0.380, P = 0.003, Fig. 3A). Near indistinguishable regression lines suggest, at least from baseline data, that the two groups are the same. Longitudinal comparative follow-up data were available up to 7 years. Progression of CMTES over this time, comparing pathogenic variants and VUS, is plotted in Supplementary Fig. 1. Although baseline data suggested the characteristics of the two groups were not significantly different, significant differences in mean changes from baseline CMTES at 1 year [ΔCMTES(pathogenic) = 0.57 ± 2.5 versus ΔCMTES(VUS) = −0.63 ± 2.4, P = 0.034] and 2 years [ΔCMTES(pathogenic) = 0.28 ± 2.6 versus ΔCMTES(VUS) = −1.2 ± 2.0, P = 0.01] were seen between groups. Significant differences between the two groups were not seen beyond 2 years, although the trend was to progression over time, but for the patients with VUS to progress less than those with pathogenic variants, and respective trend lines converging towards 7 years.
![Scatter plot showing correlation between (A) baseline CMTES and age for pathogenic/likely pathogenic variants and VUS, and (B) baseline CMTES and age by sex for all pathogenic/likely pathogenic variants. Each point represents an individual patient. In A, the lines of best fit for simple linear regression model are plotted in red [pathogenic/likely pathogenic variants (P/LP), n = 305, Spearman’s ρ = 0.362, P = 7.3 ×10⁻¹¹] and blue (VUS, N = 61, ρ = 0.380, P = 0.003). The near identical lines suggest there is no difference clinically between pathogenic/likely pathogenic and VUS at baseline and that disease progression is indistinguishable between the groups. In B, the lines of best fit for simple linear regression model are plotted in black (all variants, n = 305, Spearman’s ρ = 0.362, P = 7.3 ×10⁻¹¹), blue (male, n = 155, ρ = 0.577, P = 3.9 ×10⁻¹⁵) and red (female, n = 150, ρ = 0.273, P = 0.001). The divergent regression lines for male and female disease progression suggest a slower disease progression in females over time. All correlations are significant at the 0.01 level. CMTES = Charcot-Marie-Tooth Examination Score; VUS = variant of uncertain significance.](https://oup.silverchair-cdn.com/oup/backfile/Content_public/Journal/brain/146/10/10.1093_brain_awad187/1/m_awad187f3.jpeg?Expires=1750473294&Signature=LzIGIA8zXpxPkEvNAxWKqA~8HNru4C9PXniXd3wnYXH32JGp6tRQN73Hi~6jmQsIbz~6b~LNLLaAxcyv-jYV2jnYLMgQLE3Ka7YXxMVqFzSVBrAWhEmvOQ~gvsbSFT9tdCNNa3UORkWx8SfzUsKt-S7sljNwMuZ5VgLw2yzWsUC1JVPx4ULIde9BuAFIM4X-IRb5~gMV0dlCy56hPWezW-N8HzaQwi5b1bRdJSv-jOmjASgTApjTSr~gLNH0y7KGHsLSj~FQOqwGSVqKie1NabfNbD7s0iCgsU2TqXkVtqJ6JdIfejDFLqo2uZ8iwnN~ZCCOvtWjs2H8y2XRqn-SeQ__&Key-Pair-Id=APKAIE5G5CRDK6RD3PGA)
Scatter plot showing correlation between (A) baseline CMTES and age for pathogenic/likely pathogenic variants and VUS, and (B) baseline CMTES and age by sex for all pathogenic/likely pathogenic variants. Each point represents an individual patient. In A, the lines of best fit for simple linear regression model are plotted in red [pathogenic/likely pathogenic variants (P/LP), n = 305, Spearman’s ρ = 0.362, P = 7.3 ×10⁻¹¹] and blue (VUS, N = 61, ρ = 0.380, P = 0.003). The near identical lines suggest there is no difference clinically between pathogenic/likely pathogenic and VUS at baseline and that disease progression is indistinguishable between the groups. In B, the lines of best fit for simple linear regression model are plotted in black (all variants, n = 305, Spearman’s ρ = 0.362, P = 7.3 ×10⁻¹¹), blue (male, n = 155, ρ = 0.577, P = 3.9 ×10⁻¹⁵) and red (female, n = 150, ρ = 0.273, P = 0.001). The divergent regression lines for male and female disease progression suggest a slower disease progression in females over time. All correlations are significant at the 0.01 level. CMTES = Charcot-Marie-Tooth Examination Score; VUS = variant of uncertain significance.
Disease progression in males and females
Cross-sectional analysis of baseline data of age versus CMTES, by sex, is plotted in Fig. 3B. Regression lines of best fit show males (ρ = 0.577, P = 3.9 ×10⁻¹⁵) progressing at a greater rate than females (ρ = 0.273, P = 0.001). Longitudinal follow-up data for males and females with pathogenic variants was analysed up to 8 years (Supplementary Fig. 2). Both groups show a trend to disease progression over time with no statistically significant differences between males and females for the change in mean CMTES at any time point, suggesting over this period of follow-up, there is no difference in rate of progression between males and females. When separated by sex, significant changes in mean CMTES are only seen in males at 3 (ΔCMTES = 1.5 ± 2.6 P = 0.001) and 7 years (1.1 ± 2.5 P = 0.047) and in females at 4 years (1.0 ± 2.4 P = 0.031). SRMs comparing males and females at the first three time points were slightly higher in males, noting that the ΔCMTES mostly fails to reach statistical significance: 1 year male versus females SRM = 0.25 versus 0.22, 2 years 0.17 versus −0.01, 3 years 0.57 versus 0.39.
Disease progression by baseline severity
Longitudinal follow-up analysis of ΔCMTES by baseline severity was performed by dividing patients into one of three groups based on baseline CMTES as defined previously in INC studies24,26; baseline CMTES of 0–7 was defined as mild, 8–14 moderate and ≥15 severe, and only those with pathogenic variants were considered. Figure 2B illustrates disease progression to 5 years follow-up for each of the three subgroups. Patients with mild disease have clear and significant changes in CMTES from baseline to each interval time point; change in CMTES at 1 year: 1.6 ± 2.5 P = 0.004, 2 years: 1.0 ± 2.3 P = 0.025, 3 years: 2.3 ± 2.5 P = 0.001, 4 years: 2.0 ± 2.4 P = 0.004 and 5 years: 2.2 ± 2.5 P = 0.006. SRMs for these differences can be seen in Table 4, and illustrate that there is high responsiveness for the CMTES for mild disease at 3 years (SRM = 0.90), 4 years (0.85) and 5 years (0.88). Moderate responsiveness is seen even at 1 year for this group (0.63). Importantly, the proportion of females in the mild group ranged from 38–68%. Conversely the moderate severity group shows a trend to increasing CMTES over time, but none of the mean differences are statistically significant. The severe group shows no trend to progression over 5 years follow-up. Change in CMTES was significantly different between mild and moderate severity groups at 1 year (P = 0.024) and 3 years (P = 0.040), and between mild and severe groups at 5 years (P = 0.013). Change in CMTES between moderate and severe groups was not significant at any time point.
Change in CMTES for patients with mild disease at baseline including only pathogenic/likely pathogenic variants by year of follow-up
| Year of follow-up | n | Female, n (%) | Mean baseline score ± SD | Mean change ± SD | Q1–Q3 | P | SRM |
|---|---|---|---|---|---|---|---|
| 1 | 25 | 17 (68) | 4.5 ± 2.0 | 1.5 ± 2.5 | 0.00–3.00 | 0.004 | 0.63 |
| 2 | 28 | 16 (57) | 4.5 ± 1.8 | 1.0 ± 2.3 | 0.00–2.00 | 0.025 | 0.45 |
| 3 | 21 | 11 (52) | 5.1 ± 1.9 | 2.3 ± 2.5 | 0.50–4.00 | 0.001 | 0.90 |
| 4 | 16 | 6 (38) | 4.9 ± 2.3 | 2.0 ± 2.4 | 0.00–3.75 | 0.004 | 0.85 |
| 5 | 14 | 8 (57) | 4.6 ± 2.3 | 2.2 ± 2.5 | 0.00–4.00 | 0.006 | 0.88 |
Significant P-values and SRMs highlighted in bold. Q1–Q3 = interquartile range for change in CMTES or CMTES-R; CMTES(-R) = Charcot-Marie-Tooth examination score (Rasch-modified); SD = standard deviation; SRM = standard response mean.
Discussion
We present genetic and clinical data, including longitudinal follow-up, for 387 patients with CMT and variants in GJB1; the largest study to date on CMTX1. We report 157 variants in GJB1 in patients thought to have CMTX1, of which 154 were considered for analysis. Of these patients, 70.8% have been classed as pathogenic, 27.3% VUS and 1.9% benign. ClinVar does not have entries for 37 of these, but considering the proportion of the cohort classified in ClinVar, only 58.1% were pathogenic, 41.9% VUS, and none benign. The striking uplift in those classified as pathogenic primarily results from evidence considered herein that may not readily be available to genetic diagnostic laboratories. An example of this is phenotypic specificity, denoted PP4. Through the INC we could obtain detailed phenotypic information, including neurophysiology, which is essential in determining the phenotype in GJB1, for multiple members of a family. This allows use of a criterion rarely implemented by diagnostic genetic laboratories because communicating information to this level of detail can be difficult. Our experience is that a local genetic multidisciplinary team meeting is essential for enhanced variant classification, but detailed and structured international databases such as within the INC, can also facilitate this.
Enhanced variant classification in GJB1
Before the introduction of structured guidelines,27,46,47 and genomic data about GJB1 variants in human populations, if a missense variant in GJB1 was found in a patient with CMT, the genetic report would indicate that ‘this variant is likely to be pathogenic’ based on the experience that missense variants in GJB1 had not been found in healthy controls. We now recognize benign missense variants in GJB1, such as p.Val13Met, which is included in this study. This benign variant was originally reported to cause CMTX1 by Bone et al.16 in 1997, but the population frequency is too high to be compatible with CMTX1,29,30 and it has also been shown not to segregate with disease (unpublished data, M.M.R and S.S.S.).
In some cases, even with a high clinical suspicion that the variant is disease causing, the variant still has to be classified as a VUS. As one example, members of the INC saw affected individuals from a multigenerational family and agreed the most likely diagnosis was CMTX1. The phenotype and neurophysiology are typical, there is X-linked inheritance, and females are less severely affected than males. Their variant, c.72G>T p.Trp24Cys, segregated within the family. This family is the only report of this variant in the literature, and despite demonstrating segregation, the absence of this variant from population databases, and predicted pathogenic in silico, there is not enough evidence to classify the variant above VUS. Unless new variants are reported that enable the use of criteria PS4 and PM5 (either the same variant or a different variant at the same amino acid position) cannot be invoked. This has become difficult as journals understandably prioritize case series of existing genes or novel genes.
VUS clinically resemble pathogenic variants
Most patients with VUS in this study were assessed by an expert in genetic neuropathies and deemed to have CMTX1. However, for the reasons stated above, we were not able to upgrade them to pathogenic. We reasoned that if VUS clinically resembles pathogenic variants, then this adds weight to the argument that they are disease-causing. At baseline, the two groups displayed no statistically significant differences in the 27 demographic and clinical measures evaluated. Particularly striking are the near identical values for age of recruitment and onset of lower limb symptoms, neurophysiological parameters and mean CMTES, CMTES-R, CMTNS and CMTNS-R scores. The lines of best fit for the linear regression of age against CMTES almost superimpose, providing convincing evidence that at baseline these groups clinically are indistinguishable. Longitudinal analysis did reveal significant differences at 1- and 2-year follow-up. However, the number of patients with VUS and follow-up data are relatively small (24 versus 107 pathogenic at 1 year) and the differences seen may be due to small sample size.
Each variant should be considered on a case-by-case basis, which takes expertise and is time consuming. GJB1 has many reported variants that are unique to individuals or families: as of September 2022 ClinVar lists 660 variants (and there are at least another 60; S.S.S. unpublished data) and only 213 classified by ClinVar as pathogenic, despite the knowledge that missense variants commonly cause disease.38 Compared to the ClinVar classification, our classification enabled us to upgrade 31 GJB1 variants from VUS to pathogenic; this knowledge is fundamental for patients and their family, for their inclusion in clinical trials, and for successful application for pre-implantation genetic testing (much more likely if the variant is pathogenic or likely pathogenic).48,49 In addition to the approach taken here, functional studies are crucial in evaluating the pathogenicity of suspected variants, because most disease-associated Cx32 mutants form abnormal channels.50
The natural history of CMTX1
Cross-sectional evaluation of baseline data for 384 CMTX1 patients corroborates results previously published by the INC and other groups.2,4,16,51 As expected, males are more severely affected than females, with a younger age at recruitment, earlier onset of lower limb symptoms, a higher rate of reporting difficulty with walking, balance and tasks requiring dexterity. Interestingly, compared with the baseline analysis for patients with dominant mutations in MFN2 causing CMT2A, despite CMT2A being more severe in most parameters, both males (76.4%) and females (65.6%) report difficulty with buttons compared with only 64% of CMT2A patients reporting dexterity issues.25 This provides some quantitative evidence that the disease process in CMTX1 is not entirely length-dependent. Additional features are relatively uncommon in both males and females; scoliosis 10.5% versus 11.3%, hip dysplasia 2.5% versus 2.1%, and no optic atrophy or hearing loss in either group. Interestingly, although non-significant, only 2/149 males versus 7/123 females had a sural nerve biopsy, perhaps because the diagnosis was more challenging in females.6 The difference in upper limb conduction velocities between males and females reflects the clinical syndrome of more severe disease in males, with slower velocities in the intermediate range, more axonal loss reflected in lower CMAPs, and females with conduction velocities in the upper-intermediate or axonal range and higher mean CMAPs. The predilection for the median nerve (as shown by lower CMAPs and slower conduction velocities in both males and females) compared to ulnar nerve is unexplained. CMT severity scores also show that males are more severely affected than females.
Despite early studies suggesting a genotype-phenotype correlation in CMTX1,52,53 to date this correlation has not been reproduced.2,4,51 However, by comparing the patients with the most common mutations in our cohort, we found that patients with c.-17G>A were significantly more severely affected [adjusted CMTES (aCMTES) = 12.3] than those with p.Arg15Gln (aCMTES = 8.2, P = 0.036), p.Arg22Ter (aCMTES = 8.0, P = 0.047) and p.Glu102Gly (aCMTES = 6.5, P = 0.001). The possibility that the 5′ UTR variant causes a more severe phenotype is particularly interesting given that it causes aberrant splicing and inclusion of intron 1 to form a mutant transcript.17,54 The physicochemical properties of the remaining four most common variants have been studied in vitro apart from p.Arg22Ter, which is presumed to produce a very truncated, non-functioning protein.55 Both p.Arg15Gln and p.Glu102Gly form channels at the cell membrane but with altered gating properties.10,11,15,56–58 The p.Arg220Ter variant also forms at least some channels but also with abnormal conductance.11,14,57,59 Clearly, caution should be exerted when considering variants as ‘LoF’ because, as with p.Arg220Ter, nonsense variants in the C-terminal end of the protein beyond Arg215 can form functional hemichannels in vitro.60
The lack of significant differences in any baseline measure between all missense and LoF variants also affirms the known complexity of pathomechanisms by which variants in GJB1 cause disease. The complete absence of protein does not equate to a more severe phenotype,18 and similarly the physiochemical properties of gap junctions that are formed by different Cx32 mutants in vitro do not correspond to differences in the severity of neuropathy,56 although Cx32 mutants that cause transient CNS dysfunction do not form functional channels.50 Furthermore, significantly lower age-adjusted mean CMTES scores at baseline were seen for patients with variants in the IC domain, compared with TM1, TM2, TM3 and EC2, and this corroborates some previous findings that variants in the IC domain produce a milder phenotype.52,53 CNS manifestations of CMTX1 were not collected in this study, and the features and genotype of these patients has been reviewed elsewhere.7,50 It is theoretically possible that upper motor neuron signs and/or central sensory signs could have confounded the CMTES in certain individuals, but in our experience this would be very unusual.
This is the first prospective longitudinal study documenting progression of disease in CMTX1. There are no statistical differences in the rates of progression between males and females (Supplementary Fig. 2). When examined by sex, the magnitudes of change in CMTES from baseline rarely reach statistical significance, but there is a clear trend to disease progression. However, using cross-sectional data as a surrogate for disease progression (Fig. 3B) suggests that males do progress more rapidly than females. The x-axis, representing age, spans an entire human lifetime, compared with 8 years for our follow-up data. Therefore, differences in rates of progression may well be borne out over a longer time period.
The rate of progression in females is confounded by the wider spread of disease severity in females, which is thought to be due to a degree of X-inactivation: the more myelinating Schwann cells that express the mutant GJB1 allele, the worse the neuropathy.3,61 This spread can be appreciated by the weaker correlation of age with CMTES in females compared with males; Spearman’s rho, reflecting the strength of correlation, in males ρ = 0.577 and females ρ = 0.273. A much smaller study of 31 CMTX1 females proposed that they fall into one of three phenotypic groups of severity and progression: asymptomatic carriers with minimal signs of disease, mild disease with minimal progression over time, and moderately severe progressing like affected males.3 Figure 2B shows disease progression subdivided by severity. Strikingly, the ‘mild’ group shows clear and significant progression at every time point, the ‘moderate’ group trends to progression but without reaching significance, and the ‘severe’ group remains relatively stable over 5 years. Importantly, the proportion of females in the mild group was >50% in all but one time point, indicating that mild females do progress in a fashion comparable with males. It is noteworthy that CMTES for patients with MPZ mutations was much more responsive in the moderately affected group,26 and the CMTES-R in CMT1A showed greatest responsiveness for the mild group.24 The fact that the most responsive subgroup differs for different diseases suggests these findings likely reflects the true natural history in each cohort, rather than the inherent responsiveness of these outcome measures for a particular severity of disease. The highly responsive SRM for CMTES in mild disease at 3 years will be important when selecting patients for treatment trials, and further studies are needed to see if there is a similar progression of biomarkers including quantitative calf fat fraction by MRI in this group.
Disease progression for all patients with pathogenic variants in GJB1 is shown in Table 3 and Fig. 2A. Progression over time is seen with variable statistical significance for change in CMTES and CMTES-R from baseline. The mean ΔCMTES or ΔCMTES-R is never more than 2 points at any time point, and this change of 2.0 is only achieved at 8-year follow-up for the CMTES (P = 0.039). Clinically, the significance of these changes is not meaningful when considering monitoring responses in treatment trials. Patient reported outcomes can be inconsistent, and some aspects of the CMTES, although validated as reproducible, are subjective. Comparing change in mean CMTES-R over time for CMTX1 with CMT1A (ΔCMTES-R was the primary outcome in that study), values are comparable. Difference in CMTES-R at Year 1 for CMT1A was 0.2 versus 0.8 for CMTX1, 2 years 0.6 versus 0.5, 3 years 0.7 versus 1.5, out to 6 years with 1.8 for CMT1A and 1.3 for CMTX1.1 Comparing MPZ and CMTX1, ΔCMTES values are again comparable, with ΔCMTES at 3 years 0.8 for MPZ and 1.3 for CMTX1. The SRM of an outcome measure can be used to evaluate its responsiveness. Using Lehr’s formula it is possible to estimate the number of participants needed to power a clinical trial to 80%, to detect a significant difference between groups (i.e reduction in disease progression versus placebo) at a significance level of 0.05.62 SRM values for each of the eight annual follow-ups all indicate low responsiveness of the CMTES and CMTES-R (0.2 < SRM < 0.49) except for 3-year follow-up for the CMTES, where the SRM is 0.5, considered moderate responsiveness. Using SRM of 0.5 for the change in CMTES at 3 years, taking a reduction of progression of 50% as a clinically significant change versus placebo, the study would require 256 participants in each study arm. In CMT1A, the CMTES-R improved responsiveness at 2 years by 55%, although the absolute SRM value was still of low responsiveness for the CMTES-R (0.11 to 0.17).24 For CMTX1, as shown in Table 3, the Rasch modification does not improve the SRM, as was also reported for CMT2A and MPZ-associated CMT.25,26 Using the same calculation, the highly responsive SRM for CMTES in mild disease in CMTX1 would necessitate only 78 patients in each study arm over three years (SRM = 0.90).
CMTX1 is a slowly progressive disease, as demonstrated by an increase in CMTES and its counterparts over time. Over the timeframe suitable for a clinical trial, e.g. 2 years as per previous treatment trials in CMT1A,63 changes in CMTES are small. Males progress in a similar fashion to females, despite evidence that disease severity is clearly less in females, and possibly over a lifetime they do progress more slowly than their male counterparts. The CMTES and CMTES-R generally have low responsiveness as an outcome measure, with the exception of mildly affected patients, and they are unlikely to be optimal as a sole primary end point in a treatment trial. The recently described MRI calf fat fraction (Queen Square Neuromuscular MRI protocol),64,65 has shown high responsiveness in CMTX1 even at 1 year66 and other plasma and skin biomarkers are being investigated.67,68 A combination of biomarkers and clinical outcome measures, like the CMTES, are likely to be needed for treatment trials in CMTX1.
Acknowledgements
This study makes use of data generated by the DECIPHER community. A full list of centres who contributed to the generation of the data is available from https://deciphergenomics.org/about/stats and via email from [email protected]. Funding for the DECIPHER project was provided by Wellcome [grant number WT223718/Z/21/Z].
Funding
This work was supported by The Inherited Neuropathies Consortium—Rare Disease Clinical Research Network (U54NS065712). C.J.R. was also supported by an MRC strategic award to establish an International Centre for Genomic Medicine in Neuromuscular Diseases (ICGNMD) MR/S005021/1. M.M.R is grateful to the Medical Research Council (MRC MR/S005021/1), the National Institutes of Neurological Diseases and Stroke and office of Rare Diseases (1UOINS109403-01 and R21TROO3034), Muscular Dystrophy Association (MDA510281) and the Charcot Marie Tooth Association (CMTA) for their support. This research was also supported by the National Institute for Health Research University College London Hospitals Biomedical Research Centre. S.S.S. was also supported by the Judy Seltzer Levenson Memorial Fund for CMT Research. J.B. receives research funding from the Australian Government (MRFF#1152226, NHMRC#2015970), NIH (1U01 NS109403), Muscular Dystrophy Association, American Orthotic and Prosthetic Association. D.P. was also supported by Charcot Marie Tooth Association (CMTA) and by the Italian Ministry of Health (RRC). D.W. acknowledges the Leonard E. Walk Neuropathy Research and Education fund of the University of Minnesota Foundation for its support of this work.
Competing interests
M.M.R. consults for Alnylam, Eido, Augustine Therapeutics, and DTx Pharma. In the last 3 years, S.S.S. has served on the Scientific Advisory Board for Mitochondria in Motion and Disarm Therapeutics, and consulted for Pfizer, Applied Therapeutics, Passage Bio, and Toray Industries. J.B. receives consulting fees, honoraria or expense reimbursement from Faculty of Medicine Siriraj Hospital Mahidol University Thailand, Charcot Marie Tooth Association USA, National Health and Medical Research Council of Australia, Applied Therapeutics, DTx Pharma, Hereditary Neuropathy Foundation. S.R. is currently an employee of the Janssen Pharmaceutical Companies of Johnson & Johnson. The work submitted represents research conducted while she was at Wayne State University. D.N.H. has served as a consultant or on a Scientific Advisory Board for Regenacy, Pfizer, Passage Bio, Applied Therapeutics, DTXx Pharma, Sarepta, Neurogene, Swan Bio, GLG and Guidepoint Global. In the past 3 years, D.P. has served on Clinical Advisory Board for Arvinas, Augustine Tx, DTx Pharma. M.D.W. has received honoraria for serving on Scientific Advisory Boards for Alexion, UCB-Ra, Argenx, Biogen, Mitsubishi Tanabe Pharma, and Amylyx and speaker honoraria from Soleo Health.
Supplementary material
Supplementary material is available at Brain online.
Appendix 1
Additional members of the Inherited Neuropathy Consortium
We thank the following people working at INC sites for their work and contribution to this study:
Lisa Abreu, Kimberly A. Anderson, Silvia Baratta, Debbie Berry, Julian Blake, Eleonora Cavalca, Kayla Cornett, Andrea Cortese, Gabrielle Donlevy, Amanda Dragon, Magdalena Dudziec, Katy Eichinger Tim Estilow, Valerie Ferment, Natalie Grant, Tiffany Grider, Emily Hyslop, Tara Jones, Nicole Kressin, Wendy Leon, Stefania Magri, Brett McCray, Manoj Menezes, Evelin Milev, Lindsey Parrott, Pooja Patel, Cláudia Brito Pires, Valeria Prada, Gita Ramdharry, Paola Saveri, Giulia Schirinzi, Rosemary Shy, Carly Siskind, Janet Sowden, Sydney Stork, Charlotte J Sumner, Franco Taroni, Simone Thomas, Jennifer Twachtman-Bassett, Nidia Villalpando, Dragan Vujovic, Julie Wells, Elizabeth Wood, Riccardo Zuccarino.

