


Abstract
CHCHD10 is an amyotrophic lateral sclerosis/frontotemporal dementia gene that encodes a mitochondrial protein whose precise function is unclear. Here we show that Coiled-Coil-Helix-Coiled-Coil-Helix Domain Containing protein 10 interacts with the Stomatin-Like Protein 2 and participates in the stability of the prohibitin complex in the inner mitochondrial membrane. By using patient fibroblasts and mouse models expressing the same CHCHD10 variant (p.Ser59Leu), we show that Stomatin-Like Protein 2 forms aggregates with prohibitins, found in vivo in the hippocampus and as aggresome-like inclusions in spinal motor neurons of Chchd10S59L/+ mice. Affected cells and tissues display instability of the prohibitin complex, which participates at least in part in the activation of the OMA1 cascade with OPA1 processing leading to mitochondrial fragmentation, abnormal mitochondrial cristae morphogenesis and neuronal death found in spinal cord and the hippocampus of Chchd10S59L/+ animals. Destabilization of the prohibitin complex leads to the instability of the mitochondrial contact site and cristae organizing the system complex, probably by the disruption of OPA1–mitofilin interaction. Thus, Stomatin-Like Protein 2/prohibitin aggregates and destabilization of the prohibitin complex are critical in the sequence of events leading to motor neuron death in CHCHD10S59L-related disease.
Introduction
Mitochondrial diseases, caused by respiratory chain (RC) deficiency, display heterogeneous clinical presentations in terms of age at onset, progression and symptoms. However, pure motor neuron (MN) disorders are rarely seen in these pathologies. Interestingly, we identified a heterozygous variant (p.Ser59Leu) in the gene encoding CHCHD10 (Coiled-Coil-Helix-Coiled-Coil-Helix Domain Containing protein 10) in two families. In the first one, patients developed a mitochondrial myopathy with mtDNA deletions and other symptoms including motor neuron disease, cognitive decline resembling frontotemporal dementia (FTD) and cerebellar ataxia.1 In the second family, the same p.Ser59Leu variant was responsible for a typical FTD-amyotrophic lateral sclerosis (ALS).1 In both families, the transmission of the disease was autosomal dominant. CHCHD10 variants were then associated with other clinical presentations, including early-onset mitochondrial myopathies2 and cardiomyopathies.3,4 The CHCHD10 gene was also involved in neurodegenerative disorders such as ALS,5,6 FTD,7 late-onset spinal motor neuropathy8 and Charcot–Marie–Tooth disease type 2.9 Among all factors involved in motor neuron disease, mitochondrial dysfunction has always been recognized as a major player.10 However, the identification of CHCHD10 was the first genetic evidence demonstrating that a mitochondrial defect can trigger motor neuron disease.
The precise function of CHCHD10 in mitochondria is unclear. Fibroblasts of patients carrying the p.Ser59Leu variant (CHCHD10S59L/+) display RC deficiency, fragmentation of the mitochondrial network and mitochondrial ultrastructural alterations with loss of cristae.1 CHCHD10 interacts with mitofilin/MIC60, a central component of mitochondrial contact site and cristae organizing system (MICOS) complex, the integrity of which is required for the maintenance of mitochondrial cristae.11 The expression of the CHCHD10S59L allele in human cells leads to MICOS complex disassembly and loss of cristae junctions.12 In mice, Chchd10 knock-out does not cause disease indicating that CHCHD10S59L/+-dependent phenotypes are caused by gain-of-function of the mutant protein rather than by loss of function.13 Recent data in Drosophila also support that the CHCHD10S59L variant is a dominant gain-of-function (i.e. toxic) mutation.14 To understand the biological role of CHCHD10 and to investigate the effects of CHCHD10 variants, we generated knock-in mice with a point mutation in the Chchd10 gene (p.Ser55Leu) corresponding to the p.Ser59Leu mutation in the human CHCHD10 gene.15Chchd10S59L/+ mice appeared normal at birth but failed to gain weight normally beginning at 10 weeks of age. At ∼1 year of age, they presented the mitochondrial myopathy with mtDNA instability observed in the patients from our original family. Their condition worsened rapidly with severe weight loss and tremors and they developed a fatal mitochondrial cardiomyopathy associated with enhanced mitophagy. At the end-stage of the disease, Chchd10S59L/+ animals displayed neuromuscular junction and MN degeneration with hyperfragmentation of the motor end plate and significant MN loss in lumbar spinal cord. In addition, we observed TDP-43 cytoplasmic aggregates in spinal neurons, corresponding to TDP-43 proteinopathy found in ALS patients.15 Taken together, these results show that Chchd10S59L/+ mice are a relevant model for studying CHCHD10 role and molecular pathways dysregulated in CHCHD10-associated disease, leading to MN death.
By using both patient fibroblasts and mouse models, here we show that SLP2 and prohibitins (PHBs), which are protein scaffolds in the inner mitochondrial membrane (IMM) that regulate mitochondrial activities, are key elements in the pathological cascade leading to CHCHD10S59L-related disease. We describe SLP2/PHB aggregates in spinal neurons and hippocampus of Chchd10S59L/+ mice with an instability of the PHB complex at least in part responsible for the activation of OMA1 cascade and OPA1 processing leading to mitochondrial network fragmentation, MICOS disassembly and cell death.
Materials and methods
Cell culture
Skin punches were obtained from patients after informed consent. Primary fibroblast cultures were established using standard procedures in Roswell Park Memorial Institute medium supplemented with 10% foetal bovine serum (FBS), 45 μg/ml uridine and 275 μg/ml sodium pyruvate. Primary fibroblasts and HeLa cells were maintained in Dulbecco’s modified Eagle medium supplemented with penicillin (100 U/ml)/streptomycin (0.1 mg/ml) and 10% FBS. Cell cultures were incubated at 37°C in a humidified atmosphere with 5% CO2 in air. For transient transfections, HeLa cells were transfected using Lipofectamine 2000 (Invitrogen) according to the manufacturer’s instructions.
Co-immunoprecipitation and mass spectrometry experiments
Twenty-four µg of plasmids expressing either Flag-CHCHD10 or Flag alone were transfected in HeLa cells using Lipofectamine 2000 (Invitrogen). Twenty-four hours post-transfection, cells were subjected to immunoprecipitation assays with 3 mg of proteins and 10 µg of mouse anti-FLAG antibody (listed in Supplementary Table 2). Immunoprecipitated proteins were loaded on a 11% acrylamide–sodium dodecyl sulphate (SDS) gel. Gel was stained for 1 h with Biosafe Coomassie G250 and destained 45 min in water before proteomic analysis performed at the Proteomics facility of the Institut Jacques Monod, University of Paris Cité, France.
Alkali extraction
Mitochondria were isolated from fibroblasts using Q-Proteome mitochondria isolation kit (Qiagen) following the manufacturer’s instructions. Mitochondrial membranes were extracted as previously described in16 with sodium carbonate at the indicated pH. Briefly, intact isolated mitochondria (20 μg) were treated with 0.1 M Na2CO3 (pH 11.5, 12.5, 13.5) for 30 min on ice, and then centrifuged at 17 000g for 15 min at 4°C. Supernatants were retained and pellets were washed once with 200 μl of homogenization buffer (250 mM sucrose, 1 mM EDTA, 20 mM HEPES-NaOH pH 7.4, plus protease inhibitor) and resuspended in a 50 μl of homogenization buffer.
Membrane potential measurements
Human fibroblasts were seeded on 96-well CellCarrier Ultra imaging plates (Perkin Elmer) 24 h before imaging. Nuclei were stained with NucBlue™ Live ReadyProbes™ Reagent (ThermoFisher Scientific) at 1 drop per 10 ml of media. Fluorescent labelling of mitochondria was achieved using MitoTracker DeepRed (MTDR) at 100 nM and tetramethylrhodamine ethyl ester perchlorate (TMRE; 50 nM) for 30 min at 37°C, 5% CO2. Cells were then washed with regular medium and images were acquired using the Operetta CLS or Opera Phenix High-Content Analysis systems (Perkin Elmer), with ×20 water/1.0 numerical aperture (NA) or ×63 water/1.15 NA. MTDR (615–645 nm), TMRE (530–560 nm) and NucBlue (355–385 nm) were excited the appropriate LEDs (Operetta CLS). Cellular segmentation was performed as previously described17 and automatic single-cell quantification of mitochondrial membrane potential was performed by calculating the ratio of TMRE:MTDR using Harmony Analysis Software (PerkinElmer) as previously described.17 Each data point represents the value of TMRE:MTDR of a single cell.
Mitochondrial network analysis
Cells were incubated with MitoTracker red (Invitrogen) as previously described by Genin et al.12 The images were acquired on a ZEISS LSM 880 confocal microscope and were deconvolved with Huygens Essential Software™ (Scientific Volume Imaging) using a theoretically calculated point spread function for each of the dyes. All selected images were iteratively deconvolved with maximum iterations scored 40 and a quality threshold at 0.05. The deconvolved images were used for quantitative mitochondrial network analysis with Huygens Essentiel Software™ with the following standardized set of parameters: threshold = 10–15%, seed = 10% and garbage = 10. Mitochondrial network length was quantified for 30–40 randomly selected individual cells. Data are represented as mean ± SEM.
Electron microscopy
Cells were seeded on 24 wells/plate, fixed with 1.6% glutaraldehyde in 0.1 M cacodylate buffer (pH 7.4) for 2 h, rinsed and postfixed in 1% osmium tetroxide and 1% potassium ferrocyanide in 0.1 M cacodylate buffer before being processed for ultrastructure as previously described by Bannwarth et al.1 The protocol for contrasting sections was slightly modified, using a 5% Lanthanide salt solution (a mixture of gadolinium acetate and samarium acetate) for 7 min instead of uranium acetate.
Chchd10S59L/+ mice
All animal procedures were approved by the Institutional Animal Care and Use Committee at the University of Nice Côte d’Azur (Nice, France) and by the Ministère de l’Education Nationale, de l'Enseignement Supérieur et de la Recherche (MESR agreement: APAFIS#5870-2016061017306888 and APAFIS#22851-2019110715009566). Chchd10S59L/+ mice were generated in a previous work.15
Statistical analysis
Statistical analysis was performed with Student’s t-test, Mann–Whitney’s test or log-rank (Mantel–Cox) test. The quantitative data were analysed in Microsoft Excel and GraphPad Prism (GraphPad Software). Data are means ± SD or ± SEM. n represents the number of mice or cells per experiment. The data from Chchd10S59L/+ mice were compared to the control littermates. P-values = *<0.05, **<0.01, ***<0.001 and ****<0.0001. ns = not significant.
Data availability
The data that support the findings of this study are available from the corresponding author, upon reasonable request.
Results
CHCHD10 physically interacts with the inner mitochondrial membrane scaffold SLP2
Understanding the role of CHCHD10 requires protein interactome studies. We performed immunoprecipitation (IP) experiments with CHCHD10-HA protein combined with mass spectrometry analysis. Among the top targets identified (Supplementary Table 1), which were predominantly IMM and matrix localized proteins, we focused our attention on the IMM protein SLP2 (Stomatin-Like Protein 2). The CHCHD10/SLP2 interaction had been previously found in a mitochondrial protein interaction mapping but without further biological confirmation.18 SLP2 is a member of the stomatin, PHB, flotilin, HflC/K superfamily, which is composed of scaffold proteins that form ring-like structures and locally specify the protein–lipid composition, the loss of which impairs mitochondrial functions.19
We confirmed the interaction between CHCHD10 and SLP2 in HeLa cells expressing wild-type (WT) or mutant (CHCHD10S59L-FLAG) forms. Both were immunoprecipitated by a rabbit polyclonal anti-SLP2 antibody (Fig. 1A). CHCHD10/SLP2 interaction was further supported by co-immunoprecipitation of the endogenous proteins from whole cell lysates extracted from both control and CHCHD10S59L/+ human fibroblasts (Fig. 1B). Last, we used a proximity ligation assay (PLA Duolink) to analyse in situ the proximity between CHCHD10 and SLP2, comparing control and patient fibroblasts. Exclusion of one antibody out of two yielded no detectable PLA signal, indicating the specificity of the assay (Supplementary Fig. 1A). PLA experiments resulted in a positive labelling in control cells but quantitative analysis revealed a decrease of dot number in patient fibroblasts (Fig. 1C and D). This result was not due to a decrease in CHCHD10 levels in patient cells (Supplementary Fig. 1B), although it is possible that this reduction reflects the disruption of IMM architecture caused by the mutant protein. Western blot analysis also showed that expression level of SLP2 was similar in control and patient cells (Fig. 1E). Taken together, these results argue for a physical interaction between CHCHD10 and SLP2 in both patient and control cells.
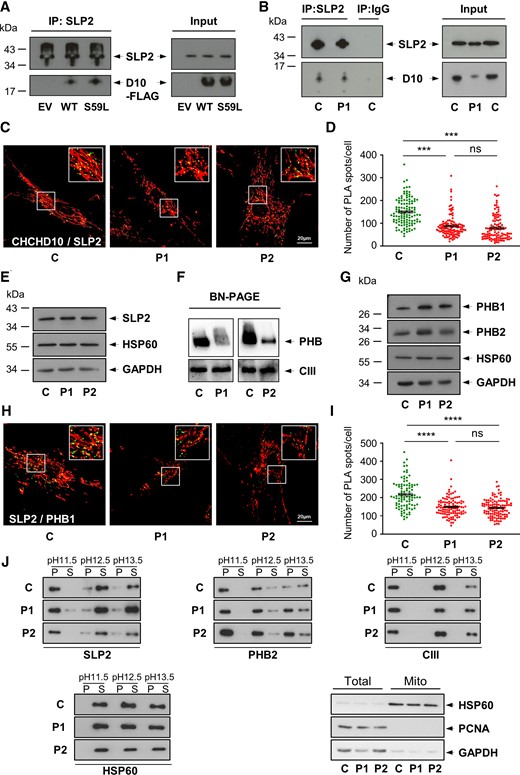
CHCHD10 physically interacts with SLP2 and is involved in the stability of the PHB complex. (A) Co-immunoprecipitation (IP) experiment in HeLa cells, transfected with an empty vector (EV), WT CHCHD10-Flag (WT) or mutant CHCHD10S59L-Flag (S59L) constructs, with an antibody against SLP2 revealed with an anti-FLAG antibody. (B) Co-IP of endogenous CHCHD10 and SLP2 in control (C) and patient (P1) fibroblasts. P1 corresponds to patient V-10 harbouring the p.Ser59Leu variant (CHCHD10S59L/+).1 (C) Duolink PLA between SLP2 and CHCHD10 in control (C) and patient (P1, P2) fibroblasts observed by confocal microscopy. Mitochondria were stained with MitoTracker. P2 corresponds to patient IV-3 (CHCHD10S59L/+).12 Scale bar = 20 µm. (D) Duolink spots per cell were quantified for 30–40 randomly selected individual cells per each studied fibroblast cell line from three independent experiments. Values are mean ± SEM. (E) Western blot on control (C) and patient (P1, P2) fibroblast extracts using antibodies against SLP2, HSP60 or GAPDH. (F) BN-PAGE analysis of mitochondria from control and patient (P1, P2) fibroblasts incubated with an anti-PHB2 antibody. Loading control was performed with an antibody against UQCRC2 (Complex III, CIII). (G) Western blot on control (C) and patient (P1, P2) fibroblast extracts using antibodies against PHB1, PHB2, HSP60 or GAPDH. (H) Duolink PLA between SLP2 and PHB1 in control (C) and patient (P1, P2) fibroblasts observed by confocal microscopy. Mitochondria were stained with MitoTracker. Scale bar = 20 µm. (I) Duolink spots per cell were quantified for 30–35 randomly selected individual cells per each studied fibroblast cell line from three independent experiments. Values are mean ± SEM. (J) Mitochondrial membranes were extracted from control (C) and patient (P1, P2) fibroblasts at the indicated pHs and separated into pellet (P) and supernatant (S) fractions by centrifugation. Fractions were analysed by SDS-PAGE and immunoblotting with antibodies against SLP2, PHB2, UQCRC2 (Complex III, CIII) and HSP60. To verify the purity of isolated mitochondria, total lysates (Total) and mitochondrial isolates (Mito) were analysed by immunoblotting using antibodies against HSP60 (mitochondrial protein), PCNA (nuclear protein) or GAPDH (cytosolic protein).
CHCHD10 is involved in the stability of the prohibitin complex
SLP2 also interacts and contributes to the stability of PHBs,20 which were the first mitochondrial SFPH proteins to be identified.21 Composed of alternative subunits PHB1 and PHB2, the PHB complex regulates key mitochondrial functions: RC activity, mitochondrial biogenesis, dynamics, apoptosis and mitophagy (for a review, see Signorale et al.22). PHBs have been found to be altered in various diseases leading to cellular defects resembling those observed in CHCHD10S59L/+ cells, i.e. mitochondrial network fragmentation, abnormal cristae and increased cell death. We analysed the PHB complex in both control and CHCHD10S59L/+ fibroblasts. Blue Native (BN)-PAGE assay revealed a reduction in steady-state PHB levels in patient cells (Fig. 1F). Western blot analysis showed that the defect of the PHB complex stability observed in CHCHD10S59L/+ fibroblasts was not secondary to the proteolysis of PHB1 or/and PHB2 (Fig. 1G), nor did it reflect a general destabilization of IMM complexes, as Complex III steady-state levels were unchanged. To confirm that CHCHD10 contributes to the maintenance of the PHB complex, we decided to blunt CHCHD10 expression in human fibroblasts. Since CHCHD10 and the paralog CHCHD2 protein are functionally redundant,13,23 we also performed a CHCHD2 and a double CHCHD2/CHCHD10 KO. BN-PAGE analysis revealed a stability defect of the PHB complex in CHCHD2/CHCHD10 knock-out cells, in line with the role of these proteins in the maintenance of this complex (Supplementary Fig. 1C). To further investigate relationships between PHBs and SLP2 in patient fibroblasts, we used PLA assay to quantitatively assess the proximity between PHB1 and SLP2. As expected, a positive labelling was observed in control cells. However, the significant decrease of dot number in patient fibroblasts was suggestive of a quantitative disruption of the proximity between SLP2 and PHBs in CHCHD10S59L/+ cells (Fig. 1H and I). On the other hand, the proximity between subunits of the TIM complex (TIMM17 and TIMM23) measured by PLA did not reveal significant differences between patients and controls (Supplementary Fig. 1D and E), excluding the possibility of a generalized disruption of IMM proteins. Defects in IMM integration and association of PHB and SLP2, respectively, could explain the reduced steady-state levels of PHB complexes and reduced physical interactions. To explore this possibility, we performed alkaline carbonate extraction experiments on mitochondria isolated from control and patient fibroblasts. We observed equivalent solubilities of IMM proteins: at pH 11.5 both SLP2 and PHB2 were tightly associated with the IMM and recovered in the pellet fraction.24 At higher pH, SLP2 was mainly recovered in the supernatant fraction due to the absence of a transmembrane domain and unlike PHB2 (Fig. 1J). Collectively, these data show that CHCHD10 contributes to the stability of the PHB complex. They also suggest an alteration of the SLP2/PHB interaction in CHCHD10S59L/+ cells unrelated to the association and integration of these proteins in the IMM.
Instability of the PHB complex in Chchd10S59L/+ mice participates to OMA1 cascade activation
To study the PHB complex in vivo, we first analysed the heart tissue of Chchd10S59L/+ mice in which cardiomyocytes display an early-onset and massive degeneration.13,15 It was thus possible to study the potential destabilization of the PHB complex and its effects on the whole organ while only specific cells are affected in spinal cord and the brain preventing the same studies on these tissues. BN-PAGE analysis revealed that the stability of this complex was impaired in the hearts of Chchd10S59L/+ mice at 3 months of age (Fig. 2A). PHBs and SLP2 control the proteolytic activity and assembly of mitochondrial proteases such as AAA proteases and the metalloprotease OMA1.24,25 We did not observe an activation of the i-AAA protease YME1L in the hearts of Chchd10S59L/+ mice compared to control littermates at 3 months of age (Fig. 2B and C). Conversely, OMA1 levels were significantly lower in Chchd10S59L/+ animals compared to controls (Fig. 2D and E). Since OMA1 is autocatalytically degraded shortly after its activation,26 this result suggests that the instability of the PHB complex triggers OMA1 activation in the hearts of Chchd10S59L/+ mice.27 OMA1 is activated by multiple stress conditions including the dissipation of mitochondrial membrane potential, heat stress and treatment with the protein aggregate-inducing chemical paraquat,26 leading to increased proteolysis of its substrates. Quantitative measurements of mitochondrial membrane potential measured by tetramethylrhodamine methyl ester fluorescence using high-content imaging revealed no reduction in mitochondrial membrane potential in patient fibroblasts cultured under basal conditions (Supplementary Fig. 2A). OPA1 (optic atrophy type 1) protein is required for mitochondrial fusion, cristae morphogenesis and apoptosis.28–31 OMA1 ensures the proteolytic cleavage of OPA1 from long (L-OPA1) to short (S-OPA1) forms at the IMM. OMA1 activation promotes the accelerated cleavage of OPA1, leading to the conversion of pro-fusion L-OPA1 forms to pro-fission S-OPA1 forms thereby driving mitochondrial fragmentation.26,32–36 In the hearts from Chchd10S59L/+ mice, western blotting analysis revealed a significant decrease of both total and L-OPA1 forms compared to WT littermates (Fig. 2F and G and Supplementary Fig. 2B). Quantified Opa1 mRNA levels by quantitative polymerase chain reaction with reverse transcription revealed a significant reduction in the hearts from Chchd10S59L/+ mice (Supplementary Fig. 2C), which could explain the reduced total levels of OPA1 protein. Independently of its role in mitochondrial fusion, OPA1 is also involved in regulating cristae remodelling and there is a close connection between cristae shape and the assembly of RC complexes.17,31,37 In the heart of Chchd10S59L/+ mice, BN-PAGE analysis showed that the stability of the complex IV was impaired compared to control animals (Fig. 2H). To assess the effects of the PHB complex instability on cell death in vivo, we performed TUNEL (terminal deoxynucleotidyl transferase dUTP nick end labelling) staining in Chchd10S59L/+ hearts at end-stage and found evidence of spontaneous apoptosis compared to control tissues (Fig. 2I and J). Taken together, these results show that the instability of the PHB complex found in the hearts of Chchd10S59L/+ mice is at least partly responsible for the activation of the OMA1 cascade, which is accompanied by a stability defect of the RC complex IV and increased cell death.
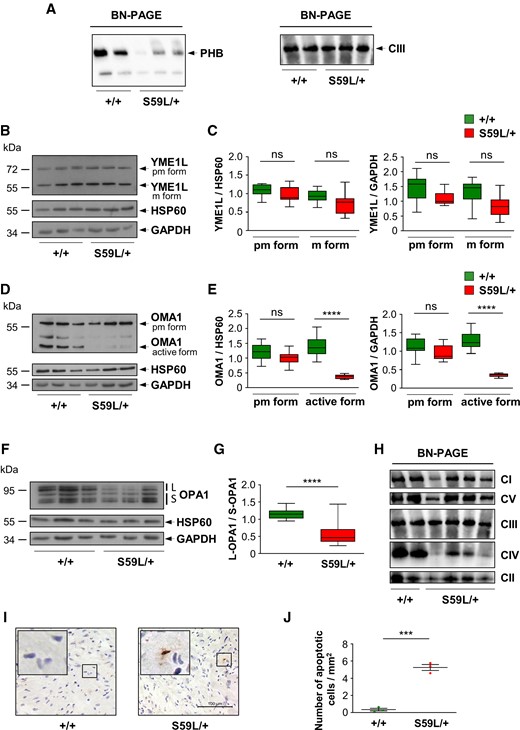
PHB complex disruption, OMA1 activation and increased OPA1 processing in hearts of Chchd10S59L/+ mice. (A) BN-PAGE analysis of heart homogenates from Chchd10S59L/+ mice (S59L/+) and control littermates (+/+) performed with an anti-PHB2 antibody. Loading control was performed with an antibody against UQCRC2 (Complex III CIII). (B) Expression level of YME1L protein analysed by western blotting in heart tissue from Chchd10S59L/+ mice (S59L/+) and control littermates (+/+). The premature (pm, 75 kDa) and mature (m, 63 kDa) forms of YME1L are indicated. Antibodies against HSP60 and GAPDH were used for loading control. (C) Quantification performed from three independent experiments with three Chchd10S59L/+ mice and three control littermates. (D) Representative western blot of OMA1 protein performed with heart lysates from Chchd10S59L/+ mice (S59L/+) and control littermates (+/+). The premature (pm, 60 kDa) and active (47 kDa) forms of OMA1 are indicated. Antibodies against HSP60 and GAPDH were used for loading control. (E) Quantification performed from three independent experiments with three Chchd10S59L/+ mice and three control littermates. (F) Expression level of L-OPA1 forms (L: the two highest bands) and S-OPA1 (S: the three lowest bands) analysed by western blotting in heart tissues from Chchd10S59L/+ mice (S59L/+) and control littermates (+/+). (G) Quantification (from four independent experiments with three Chchd10S59L/+ mice and three control littermates) of L-OPA1/S-OPA1 ratios. (H) BN-PAGE analysis of heart homogenates from Chchd10S59L/+ mice (S59L/+) and control littermates (+/+) performed with antibodies against GRIM19 (complex I, CI), SDHA (complex II, CII), UQCRC2 (complex III, CIII), MTCO2 (complex IV, CIV) and ATBP (complex V, CV) (three independent experiments). (I) TUNEL staining of heart sections from Chchd10S59L/+ mice (S59L/+) and control littermates (+/+). Scale bar = 100 µm. (J) Quantification of TUNEL-positive cells observed in I. Values are mean ± SEM from three independent experiments performed with three Chchd10S59L/+ mice and three control littermates. For each animal, 40–68 visual fields were randomly selected to quantify the number of apoptotic cells.
OMA1 or SLP2 depletion compensates fragmentation of the mitochondrial network and abnormal cristae
To confirm the involvement of OMA1 in the sequence of events leading to deleterious phenotypes, we decided to blunt OMA1 expression in CHCHD10S59L/+ fibroblasts. After transfection with OMA1 siRNA (Supplementary Fig. 3A), we observed that OMA1 depletion rescues the mitochondrial fragmentation found in patient fibroblasts (Fig. 3A and B and Supplementary Fig. 3B–D). Electron microscopy analysis revealed that mitochondrial morphology and cristae shape were slightly improved after transfection with OMA1 siRNA in P2 fibroblasts (Fig. 3C and D). Only a trend towards improvement was found in the fibroblasts of the other patient with incomplete OMA1 inactivation (Fig. 3C and D). We then inactivated SLP2 expression to confirm the involvement of this protein in CHCHD10S59L-related phenotypes (Supplementary Fig. 3E). SLP2 depletion was significantly able to drive an elongation of the mitochondrial network in patient fibroblasts (Fig. 3E and F and Supplementary Fig. 3F, H and I). This elongation was associated with an increase of L-OPA1 forms in patient cells (Supplementary Fig. 3G). The effect on the mitochondrial cristae disorganization was stronger than the one observed after OMA1 depletion (Fig. 3G and H). Inactivation of SLP2 expression was not associated with a restoration of the stability of MICOS and PHB complexes by BN-PAGE analysis, suggesting that the role of CHCHD10 in cristae maintenance is dependent on another pathway and that the link with SLP2 could be functionally independent from its interaction with PHB complex (Supplementary Fig. 3J). However, these results confirm the role of both OMA1 and SLP2 in the pathological cascade leading to abnormal mitochondrial dynamics and cristae disorganization associated with CHCHD10S59L-related disease.
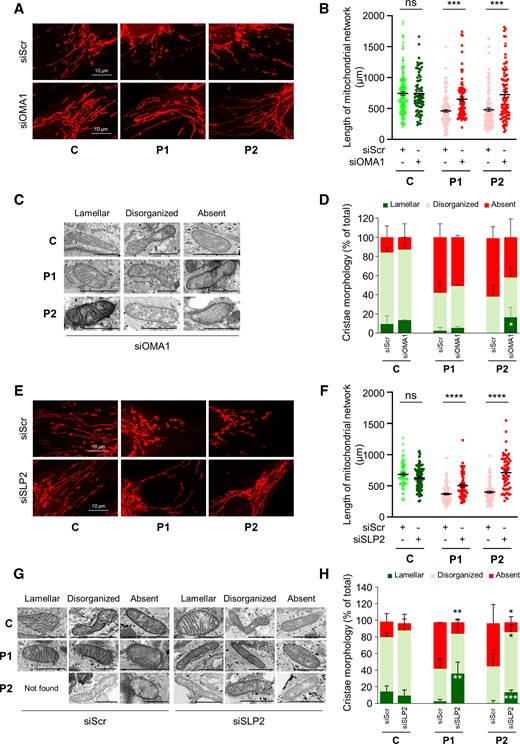
OMA1 or SLP2 depletion rescues mitochondrial network fragmentation and abnormal cristae morphology in CHCHD10S59L/+ fibroblasts. (A) Control (C) or patient (P1, P2) fibroblasts were transfected with scrambled siRNA (siScr), as a negative control, or OMA1 siRNA (siOMA1). Representative images of mitochondrial network from transfected fibroblasts. Mitochondria were stained with MitoTracker. Scale bar = 10 µm. (B) Quantification of mitochondrial network length in transfected fibroblasts. Randomly selected individual 30–40 cells per each transfection were analysed from three independent experiments. Values are mean ± SEM. (C) Representative images of mitochondrial morphology by electron microscopy, 72 h after transfection with siOMA1. Lamellar, disorganized or absent refer to mitochondrial cristae state. Scale bar = 1 µm. (D) Quantification of mitochondrial morphology observed in C. n = 3 independent experiments (44–132 mitochondria per experiment). Values are mean ± SD. (E) Control (C) or patient (P1, P2) fibroblasts were transfected with scrambled siRNA (siScr), as a negative control or SLP2 siRNA (siSLP2). Representative images of mitochondrial network from transfected fibroblasts. Mitochondria were stained with MitoTracker. Scale bar = 10 µm. (F) Quantification of mitochondrial network length in transfected fibroblasts. Randomly selected individual 30–40 cells per each transfection were analysed from three independent experiments. Values are mean ± SEM. (G) Representative images of mitochondrial morphology by electron microscopy, 72 h after transfection. Lamellar, disorganized or absent refer to mitochondrial cristae state. Not found corresponds to the absence of mitochondria with lamellar cristae in P2 cells after transfection with siScr. Scale bar = 1 µm. (H) Quantification of mitochondrial morphology observed in G. n = 3 independent experiments (49–161 mitochondria per experiment). Values are mean ± SD.
Prohibitin complex instability leads to disassembly of MICOS complex
CHCHD10 physically interacts with mitofilin/MIC60, a key component of the MICOS complex4,12,38 that is destabilized in CHCHD10S59L/+ fibroblasts.39 Mitofilin also interacts with OPA1, and together, they control cristae junction number and stability.40,41 We performed co-immunoprecipitation analysis to check for an OPA1/mitofilin interaction in CHCHD10S59L/+ fibroblasts. We found that OPA1 was immunoprecipitated by a rabbit polyclonal anti-mitofilin antibody as expected in control cells (Fig. 4A). However, the level of interaction was lower in patient fibroblasts. This result was confirmed by PLA analysis aimed at studying the proximity between OPA1 and mitofilin. PLA experiments resulted in a positive labelling in control fibroblasts, but quantitative analysis revealed a significant decrease of dot number in patient cells (Fig. 4B and C). Therefore, these results indicate that the disruption of an OPA1/mitofilin interaction plays a role in the lack of stability of the MICOS complex observed in cells expressing the CHCHD10S59L allele.12 Then we decided to analyse the proximity between OPA1 and mitofilin in patients’ cells after OMA1 depletion (Supplementary Fig. 4A). Transfection with OMA1 siRNA led to a significant increase of the number of PLA spots in patient fibroblasts suggesting that OMA1 depletion is able to rescue the interaction between OPA1 and mitofilin (Fig. 4D and E). It has been shown that PHB complex destabilization leads to OMA1 cascade activation.42,43 To determine whether PHB complex instability could also trigger MICOS complex destabilization, we decided to blunt PHB2 in human fibroblasts. Transfection with PHB2 siRNA led to PHB2 depletion (Supplementary Fig. 4B). BN-PAGE analysis revealed that it also leads to MICOS destabilization in both control and patient cells (Fig. 4F). Collectively, our results show that, in CHCHD10S59L/+ cells, the PHB complex is involved in both OMA1 cascade activation and MICOS destabilization.
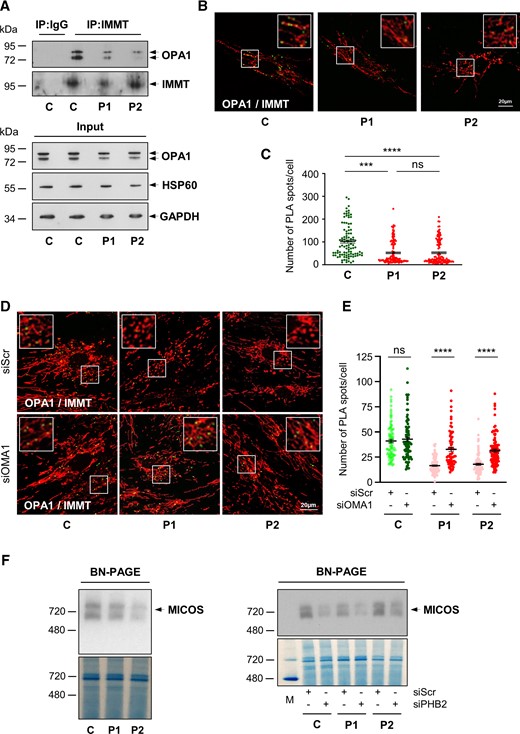
PHB complex stability controls MICOS complex maintenance. (A) Co-immunoprecipitation (IP) of endogenous mitofilin (IMMT) and OPA1 in control (C) and patient (P1, P2) fibroblasts. (B) Duolink PLA between IMMT and OPA1 in control (C) and patient (P1, P2) fibroblasts observed by confocal microscopy. Mitochondria were stained with MitoTracker. Scale bar = 20 µm. (C) Duolink spots per cell were quantified for 30–40 randomly selected individual cells per each studied fibroblast cell line from three independent experiments. Values are mean ± SEM. (D) Control (C) or patient (P1, P2) fibroblasts were transfected with scrambled siRNA (siScr), as a negative control, or OMA1 siRNA (siOMA1). Duolink PLA between IMMT and OPA1 in control (C) and patient (P1, P2) fibroblasts, transfected with siScr or siOMA1, observed by confocal microscopy. Mitochondria were stained with MitoTracker. Scale bar = 20 µm. (E) Duolink spots per cell were quantified for 20–30 randomly selected individual cells per each studied fibroblast cell line from three independent experiments. Values are mean ± SEM. (F) BN-PAGE analysis showing MICOS state in basal conditions (left) or 72 h post-transfection with scrambled siRNA (siScr), as a negative control or PHB2 siRNA (siPHB2) (right) in control (C) and patient (P1, P2) fibroblasts. Mitochondrial proteins from fibroblasts were analysed by BN-PAGE with an anti-mitofilin antibody. Gels were stained with Coomassie brilliant blue as loading control (three independent experiments). M = NativeMark™ unstained protein standard.
SLP2 and prohibitins form aggregates in the hearts of Chchd10S59L/+ mice
We then analysed the expression of both SLP2 and PHBs in the hearts of Chchd10S59L/+ mice. The respective validation of anti-SLP2 and anti-PHB2 antibodies for immunohistology is shown in Supplementary Fig. 5A and B. Interestingly, we found SLP2/PHB2 foci in heart tissue of Chchd10S59L/+ mice at 3 months of age (Fig. 5A andSupplementary Fig. 5C). Areas of SLP2/PHB2 accumulation were more visible in the hearts of Chchd10S59L/+ mice at the end-stage of the disease (Fig. 5B and Supplementary Fig. 5C). We used a filter trap assay to determine whether SLP2 and PHBs aggregated in Chchd10S59L/+ hearts. We detected the presence of immunoreactive aggregates for both SLP2 and PHB2 in homogenates from Chchd10S59L/+ mouse hearts at end-stage (Fig. 5C). It has been shown that CHCHD10 form aggregates in Chchd10S59L/+ hearts13,15 that we also found by filter trap assay. As expected, we observed a colocalization between SLP2 and CHCHD10 in vivo within mitochondria (Fig. 5D). However, CHCHD10 aggregates did not colocalize with SLP2 foci in Chchd10S59L/+ heart tissue, neither at 3 months nor at the end-stage of the disease (Fig. 5D and E and Supplementary Fig. 5D). Therefore, an accumulation of SLP2/PHB aggregates, different from those containing CHCHD10, is associated with the mitochondrial cardiomyopathy presented by the Chchd10S59L/+ mice.
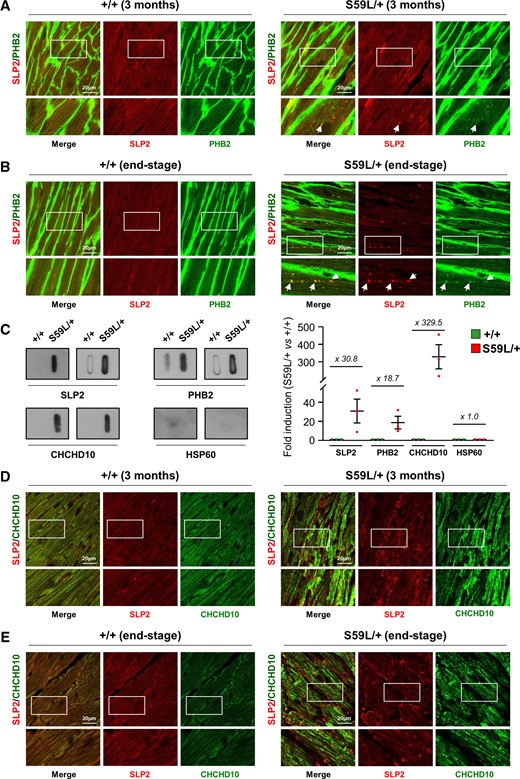
SLP2/PHB2 aggregates in the hearts of Chchd10S59L/+ mice. (A and B) Sections of hearts from WT (+/+) or Chchd10S59L/+ (S59L/+) mice at 3 months of age (A) or at end-stage (B) labelled with antibodies against SLP2 and PHB2. Arrows indicate colocalized puncta. Representative images from three independent experiments with three Chchd10S59L/+ mice and three control littermates. Scale bar = 20 µm. (C) Representative filter trap assay of total homogenates from hearts of WT (+/+) or Chchd10S59L/+ (S59L/+) mice at end-stage (left). Immunoreactive material was detected by immunoblot with SLP2, PHB2 or CHCHD10 antibodies. Anti-HSP60 antibody was used as a negative control. Quantification (right) of slot blots, corresponding to filter trap analysis, performed from three independent experiments with three Chchd10S59L/+ mice and three control littermates. Values are mean ± SEM. (D and E) Sections of hearts from WT (+/+) or Chchd10S59L/+ (S59L/+) mice at 3 months of age (D) or at end-stage (E) labelled with antibodies against SLP2 and CHCHD10. Representative images from three independent experiments with three Chchd10S59L/+ mice and three control littermates. Scale bar = 20 µm.
Spinal motor neurons of Chchd10S59L/+ mice display SLP2/PHB aggregates and increased cell death
A pathological hallmark of ALS corresponds to the presence of protein aggregates in degenerating MNs. Immunostaining with antibodies against SLP2 and PHB2 on lumbar spinal cord sections of Chchd10S59L/+ mice revealed first an abnormal labelling with anti-PHB2 antibodies compared to control animals (Fig. 6A). This pattern, mainly observed in MNs (Supplementary Fig. 6A and B) could perhaps be related to the stability defect of the PHB complex observed in cardiomyocytes. Contrary to what was observed for PHB2, immunostaining with antibodies against SLP2 was similar both in Chchd10S59L/+ mice and WT littermates. In degenerative diseases, protein inclusions can be broadly classified into small cytosolic aggregates and large perinuclear, aggresome-like inclusions (for review see44). At the end-stage of the disease, we also detected large perinuclear aggregates including both SLP2 and PHB2 in spinal neurons of Chchd10S59L/+ mice (Fig. 6B and Supplementary Fig. 6C). These aggregates were immunostained with an antibody against vimentin, in agreement with an aggresome-related nature (Fig. 6B). Electron microscopy analysis found aggresome-like inclusions in the MNs of Chchd10S59L/+ mice but not in control animals (Supplementary Fig. 6D). We did not observe an abnormal immunostaining with anti-PHB2 antibodies in spinal neurons of Chchd10S59L/+ mice at 3 months of age suggesting that PHB complex abnormalities occur during the neurodegenerative process (Supplementary Fig. 6E). We did not find a colocalization between CHCHD10 and SLP2/PHB aggregates scattered through Chchd10S59L/+ cardiomyocytes. CHCHD10 was also not found with SLP2 and PHB2 in perinuclear large inclusions observed in spinal neurons of Chchd10S59L/+ mice at the end-stage of the disease (Fig. 6C and D and Supplementary Fig. 6G and H). We then performed a TUNEL assay combined with immunostaining against SLP2 and vimentin on spinal neurons of Chchd10S59L/+ mice and control littermates at end-stage. We observed that MNs displaying large perinuclear SLP2+/Vimentin+ aggregates correspond to dying cells (Fig. 6E). Collectively, our data show large perinuclear SLP2/PHB aggregates accumulate in dying neurons in lumbar spinal cord of mice at the end-stage.
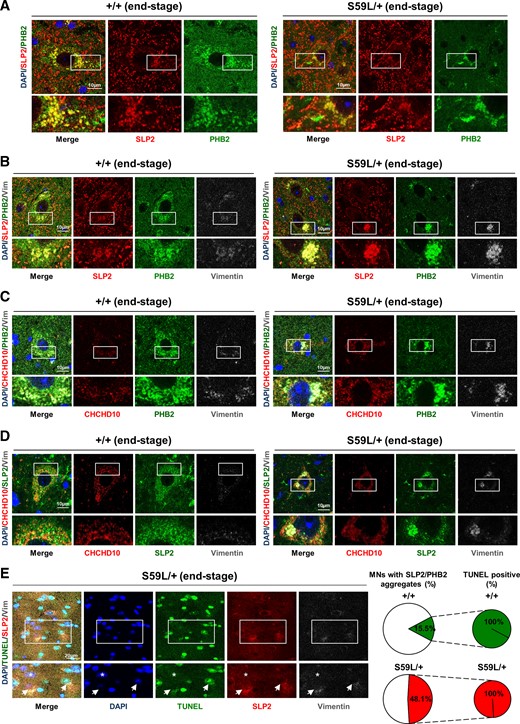
SLP2/PHB2 aggregates with increased cell death in spinal motor neurons of Chchd10S59L/+ mice. (A) Immunolabelling with antibodies against SLP2 and PHB2 in MNs on lumbar spinal cord sections from Chchd10S59L/+ mice (S59L/+) and control littermates (+/+) at end-stage. Scale bar = 10 µm. (B) Lumbar spinal cord sections visualizing spinal MNs from Chchd10S59L/+ mice (S59L/+) and control littermates (+/+) at end-stage, immunolabelled with antibodies against SLP2, PHB2 and Vimentin. Scale bar = 10 µm. (C) Lumbar spinal cord sections from Chchd10S59L/+ mice (S59L/+) and control littermates (+/+) at end-stage. Immunolabelling was performed with antibodies against CHCHD10, PHB2 and Vimentin. Scale bar = 10 µm. (D) Lumbar spinal cord sections from Chchd10S59L/+ mice (S59L/+) and control littermates (+/+) at end-stage, immunolabelled with antibodies against CHCHD10, SLP2 and Vimentin. Scale bar = 10 µm. (E) Lumbar spinal cord sections from Chchd10S59L/+ mice (S59L/+) at end-stage. Left, TUNEL assay was combined with immunolabelling by using antibodies against SLP2 and Vimentin. Arrows indicate apoptotic (TUNEL+/DAPI+/SLP2+/Vimentin+) neurons. Asterix indicates a DAPI+/TUNEL−/SLP2−/Vimentin− neuron. Right, Quantification of SLP2+/Vimentin+ neurons (Supplementary Fig. 6C) displaying TUNEL-positive signal. n = 3 independent experiments from three Chchd10S59L/+ mice and three control littermates. A total of 96–103 SLP2+/Vimentin+ MNs from S59L/+ mice or control littermates was analysed. Scale bar = 20 µm.
SLP2/PHB aggregates and increased apoptosis in the hippocampus of Chchd10S59L/+ mice
In ALS, the presence of aggregates in degenerating MNs is not restricted to the spinal cord. Different brain regions are involved such as the frontal and temporal cortices, cerebellum and hippocampus.45 The analysis of PHB2 and SLP2 expression in the hippocampus of Chchd10S59L/+ mice also revealed two types of abnormality. On the one hand, immunostaining with anti-PHB2 antibodies was totally abnormal both in dentate gyrus and in the cornus ammonis CA1 to CA3 subfields of Chchd10S59L mice at the end-stage compared with WT littermates (Fig. 7A and B). This abnormal immunostaining was evocative of the one observed in spinal MNs. It was not secondary to PHB2 degradation, as shown by western blot analysis after microdissection of mice hippocampus (Supplementary Fig. 7A) On the other hand, we found a significant accumulation of SLP2/PHB2 aggregates in dentate gyrus and cornus ammonis from Chchd10S59L/+ mice compared with WT littermates (Fig. 7A and B and Supplementary Fig. 7B and C). The hippocampus of Chchd10S59L mice at 3 months of age displayed neither abnormal PHB2 immunostaining nor accumulation of SLP2/PHB2 aggregates (Fig. 7C and D and Supplementary Fig. 7B and C). We also observed a significant increase of apoptosis by TUNEL staining in dentate gyrus and cornus ammonis from Chchd10S59L/+ mice at the end-stage compared with WT littermates (Fig. 7E–H). Therefore, SLP2/PHB aggregates are associated with increased cell death in the hippocampal areas of Chchd10S59L/+ animals at the end-stage of the disease.
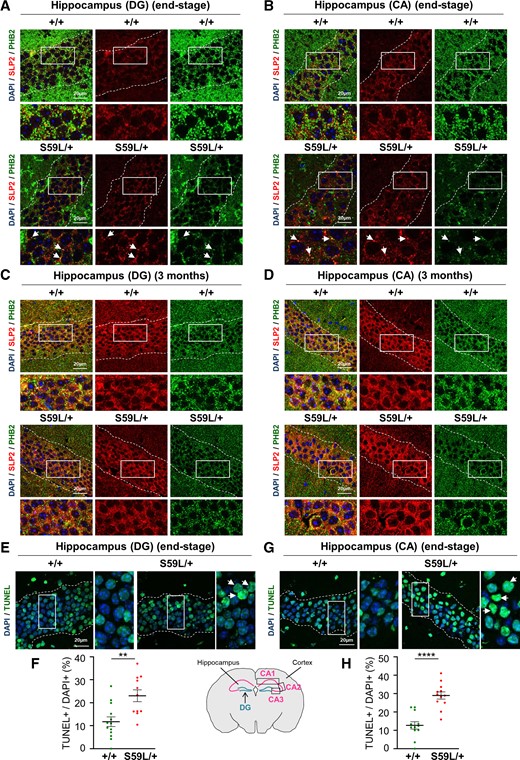
SLP2/PHB2 aggregates and increased apoptosis in the hippocampus of Chchd10S59L/+ mice. (A and B) Brain sections visualizing hippocampal areas: dentate gyrus (DG) (A) and cornus ammonis (CA) (B) delimited by dotted lines, from Chchd10S59L/+ mice (S59L/+) and control littermates (+/+) at end-stage. Immunolabelling was performed with antibodies against SLP2 and PHB2. Arrows indicate SLP2/PHB2 colocalized puncta. Scale bar = 20 µm. (C and D) Sections of hippocampal areas: DG (C) and CA (D), delimited by dotted lines, from Chchd10S59L/+ mice (S59L/+) and control littermates (+/+) at 3 months of age, immunolabelled with antibodies against SLP2 and PHB2. Scale bar = 20 µm. (E and G) TUNEL staining of brain sections from Chchd10S59L/+ mice (S59L/+) and control littermates (+/+) visualizing DG (E) and CA (G) delimited by dotted lines. Arrows indicate apoptotic (TUNEL+/DAPI+) cells. Scale bar = 20 µm. (F and H) Quantification of TUNEL-positive cells observed in E and G, respectively. n = 3 independent experiments with three Chchd10S59L/+ mice and three control littermates. For each animal, four fields (five images per field) from DG or CA1 to CA3 were randomly selected and analysed for scoring TUNEL-positive cells versus total number of nuclei. Values are mean ± SEM.
Discussion
Mutations in CHCHD10 have been found to be responsible for neurodegenerative diseases, as ALS and/or FTD, characterized by protein aggregates.1,5,6 It has also been shown that CHCHD10 forms large aggregates with the CHCHD2 protein in the affected tissues and it is likely that CHCHD10/CHCHD2 aggregation is involved in the pathological process.13,46 Here, we demonstrate that CHCHD10 interacts with SLP2, which has been shown to form cardiolipin and PHB-enriched microdomains in the IMM that facilitate the assembly of RC complexes47 and regulate mitochondrial proteolysis. Depleting HeLa cells of SLP2 leads to increased proteolysis of PHBs and of subunits of the RC complexes I and IV.20 In affected tissues of Chchd10S59L/+ mice, we found that SLP2 forms aggregates with PHBs. Generally, protein inclusions can be classified in two different types based on their size and their localization: small aggregates scattered within the cell and large perinuclear aggresome-like inclusions.44 We mainly observed the former within the hippocampus of the Chchd10S59L/+ mice at the end-stage of the disease while the latter were found in spinal MNs. In the latter, the aggresome-like nature was attested by colabelling with vimentin, which forms a cage surrounding the aggresome-like inclusions. Vimentin may promote stability of the structure and protects the intra-cellular environment from aberrant interactions with the sequestered proteins in aggregates pending their removal from the cell by the degradative pathways.48 We also show that both small and aggresome-like SLP2/PHB aggregates do not colocalize with those involving CHCHD10.
Aggregates can lead to the sequestration of the proteins involved, which adversely affects their functions in the cell. SLP2/PHB aggregates probably have a link with the destabilization of the PHB complex, which we found both in patient fibroblasts and in mouse affected tissues and that contributes to the OMA1 activation cascade even though parallel events cannot be totally excluded in our model. OMA1 activation had been also observed in Chchd10/Chchd2 double knock-out mice that partially phenocopied Chchd10S59L/+ mice.23 In a recent work, the characterization of a novel knock-in model expressing the p.Gly59Arg variant (Chchd10G58R/+ mice) has confirmed OMA1 involvement in CHCHD10-related phenotypes.49 It has been shown that the expression of different CHCHD10 pathogenic alleles both in mouse tissues and in human cells strongly induces the mitochondrial unfolded protein response (mtUPR) leading to an increased expression of mitochondrial proteases and chaperones that control protein folding, assembly and degradation.13,50 Both SLP2/PHB and CHCHD10/CHCHD2 aggregates may involve sequestration of other proteins essential for mitochondrial homeostasis leading to neurodegeneration with induction of the mtUPR in response to stress.13 In Caenorhabditis elegans, it has also been reported that the lack of PHB induces a strong mtUPR activation and different observations point to the PHB complex as a key player for mitochondrial quality control and response to mitochondrial stress (reviewed by Hernando-Rodriguez and Artal-Sanz, 201851). Further experiments will be necessary to determine the respective roles of the SLP2/PHB and CHCHD10/CHCHD2 aggregates in mtUPR triggering and in the initiation and/or the evolution of the pathological process.
Maintaining a healthy mitochondrial pool is especially important for the viability of long-lived, post-mitotic cells such as cardiomyocytes and neurons: two targets in CHCHD10-related disease. Cardiac-specific knock-out of Phb2 leads to early-onset severe cardiomyopathy with heart failure.52 Stress-induced OPA1 processing and mitochondrial fragmentation in mice lead to heart failure, which is rescued by OMA1 ablation.53 The heart phenotype found in Chchd10S59L/+ mice is fully compatible with the observations resulting from the knock-out of Phb2 and the activation of the OMA1 cascade. It represents a relevant in vivo study model to study the destabilization of the PHB complex and the consequences of the activation of OMA1 on the whole organ, unlike the nervous system in which the pathological cascade is cell-type dependent. Indeed, ALS, FTD and other neurodegenerative diseases affect distinct neuronal populations while altering common mitochondrial pathways. Neuron-specific deletion of Phb2 in mice induces extensive neurodegeneration.54 The phenotype is rescued by ablation of OMA1, which delays neuronal loss and prolongs lifespan of the animals.43 A few reports suggest that decreased PHB levels could be involved in the pathogenesis of neurodegenerative diseases by leading to increased apoptosis and neuron loss. A mitochondrial imbalance of PHB1 and PHB2 was reported in intermediate and advanced stages of Alzheimer’s disease.55 A recent work showed that C9orf72, encoded by the most frequently mutated gene in ALS and FTD, is imported in the mitochondrial intermembrane space. C9orf72 recruits the PHB complex to stabilize TIMMDC1, an assembly factor of mitochondrial complex I, the function of which is impaired in ALS/FTD patient-derived neurons bearing C9orf72 mutations.56 However, to our knowledge, PHB aggregates with PHB complex instability have never been reported in vivo either in ALS/FTD or in other neurodegenerative diseases. At the end-stage of the disease, we show that 100% of MNs presenting large SLP2/PHB inclusions correspond to degenerating cells. The presence of SLP2/PHB aggregates is also associated with increased apoptosis in other affected tissues in Chchd10S59L/+ mice: heart and hippocampus. Different clinical data, especially cognitive and neuroimaging findings, suggest that the hippocampus is affected both in ALS and FTD.57–60 The hippocampus is one of the neurogenic niches of the adult brain, which constantly generates neurons throughout life.61,62 Damage found in Chchd10S59L/+ mice suggests that, in addition to neuron loss, the capacity of cell renewal is impaired. The next steps will be to determine which cell types of the hippocampus are affected and whether the molecular pathways identified may be implicated in diseases dependent on other ALS/FTD genes.
Genetic knockdown of SLP2 or PHB2 results in OMA1 activation.63,64 SLP2 and PHB2 are similar in their function in that they help controlling OMA1 and AAA proteases, once more by organizing lipid microdomains in the IMM.65 During cell stress, OMA1 is released secondary to PHB complex disruption, converts L-OPA1 completely into S-OPA1 (pro-fission forms) and triggers mitochondrial fragmentation and cristae disruption.42,66 Reintroduction of L-OPA1 and not S-OPA1 restores these defects suggesting that S-OPA1 is incompetent for mitochondrial fusion and cristae maintenance.64 SLP2 and the PHB complex are thus necessary to control the activity of OMA1 and the processing of OPA1. CHCHD2 variants, involved in Parkinson’s disease, and CHCHD10 mutations lead to OMA1 activation when overexpressed in human cells.4 Here, we show that CHCHD10 is required with SLP2 for the maintenance of the PHB complex and that, in our models, OMA1 activation is at least partly triggered by the destabilization of this complex. The consequences of OPA1 processing in terms of mitochondrial fragmentation and abnormal cristae morphology are found both in patient fibroblasts and in affected tissues of Chchd10S59L/+ mice. Furthermore, the loss of L-OPA1 forms leads to hypersensitivity to apoptosis.64 This probably explains, at least in part, the increased level of cell death observed in hearts, spinal neurons and hippocampus of Chchd10S59L/+ mice. OPA1 physically interacts with mitofilin/MIC60, a core MICOS component, and together they control the maintenance of mitochondrial cristae.40 More recently, it has been proposed that OMA1 control mitochondrial ultrastructure through its interaction with mitofilin, independently of OPA1.67 We previously found a destabilization of the MICOS complex with abnormal cristae in patient fibroblasts expressing the CHCHD10S59L variant.12 Here, we show that PHB2 depletion in control fibroblasts leads to MICOS complex destabilization. In CHCHD10S59L/+ cells, the instability of the PHB complex is associated with MICOS destabilization, at least in part through the disruption of an OPA1/mitofilin physical interaction, thus increasing the dysmorphology of mitochondrial cristae. Surprisingly, genetic depletion of SLP2 rescues both mitochondrial network fragmentation and cristae morphology. This result could be explained by a toxic effect of SLP2/PHB aggregates counteracted by the loss of SLP2. Further experiments will be needed to determine which deregulated pathways result from gain or loss of function of SLP2. However, the rescue of mitochondrial phenotypes after inactivation of SLP2 or OMA1 in patient fibroblasts confirms the involvement of these proteins in the disease.
In conclusion, CHCHD10 contributes with SLP2 to the maintenance of the PHB complex and indirectly to that of MICOS. In cells expressing the p.Ser59Leu mutation, we show that SLP2/PHB aggregates and PHB complex instability are key factors of the pathological cascade leading to abnormal mitochondrial dynamics, loss of mitochondrial cristae and cell death in spinal neurons and in hippocampus of Chchd10S59L/+ mice (Fig. 8). The characterization of the link between SLP2/PHB and CHCHD10/CHCHD2 aggregates and the TDP-43 proteinopathy, found in Chchd10S59L/+ mice, will be essential to determine how the expression of the p.Ser59Leu variant induces protein aggregation and drives neurodegeneration. CHCHD10 mutations are relatively rare but the pathways identified by this study could apply to other neurodegenerative pathologies and open up common therapeutic possibilities.
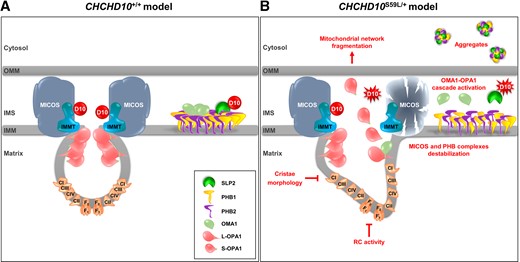
Model for the effects of WT and mutant (CHCHD10S59L) alleles in mitochondria. (A) WT and (B) mutant (CHCHD10S59L) alleles. D10 = CHCHD10; IMMT = mitofilin; IMS = intermembrane mitochondrial space; OMM = outer mitochondrial membrane.
Acknowledgements
We acknowledge Thibault Léger and the Proteomics facility of the Institut Jacques Monod, University of Paris Cité for mass spectrometry analysis. We also thank Christelle Boscagli for technical help. We gratefully acknowledge the IRCAN’s Molecular and Cellular Core Imaging (PICMI) facility, supported financially by FEDER, Conseil régional Provence Alpes-Côte d’Azur, Conseil Départemental 06, Cancéropôle PACA, Gis Ibisa and Inserm, the IRCAN’s Animal core facility, supported by FEDER, Région Provence Alpes-Côte d’Azur, Conseil Départemental 06 and Inserm, the IRCAN’s Histology core facility, supported by Région Provence Alpes-Côte d’Azur, Cancéropôle PACA and Université Côte d’Azur and, the University’s CCMA Electron Microscopy facility supported by Université Côte d’Azur, Région Provence Alpes-Côte d’Azur, Conseil Départemental 06 and Gis Ibisa.
Funding
This work was made possible by grants to V.P.-F. from the ANR (Agence Nationale de la Recherche) ANR-16-CE16-0024-01 and from the FRM (Fondation pour la Recherche Médicale) FRM: MND202004011475.
Competing interests
The authors report no competing interests.
Supplementary material
Supplementary material is available at Brain online.
References
Abbreviations
- ALS
amyotrophic lateral sclerosis
- FTD
frontotemporal dementia
- IMM
inner mitochondrial membrane
- MICOS
mitochondrial contact site and cristae organizing system
- MN
motor neuron
- PHB
prohibitin
- PLA
proximity ligation assay
- RC
respiratory chain
Author notes
Emmanuelle C Genin and Sylvie Bannwarth contributed equally to this work.

