


Abstract
Alzheimer’s disease is the most common form of dementia, characterized by a persistent and progressive impairment of cognitive functions. Alzheimer’s disease is typically associated with extracellular deposits of amyloid-β peptide and accumulation of abnormally phosphorylated tau protein inside neurons (amyloid-β and neurofibrillary pathologies). It has been proposed that these pathologies cause neuronal degeneration and synaptic alterations, which are thought to constitute the major neurobiological basis of cognitive dysfunction in Alzheimer’s disease. The hippocampal formation is especially vulnerable in the early stages of Alzheimer’s disease. However, the vast majority of electron microscopy studies have been performed in animal models. In the present study, we performed an extensive 3D study of the neuropil to investigate the synaptic organization in the stratum pyramidale and radiatum in the CA1 field of Alzheimer’s disease cases with different stages of the disease, using focused ion beam/scanning electron microscopy (FIB/SEM). In cases with early stages of Alzheimer’s disease, the synapse morphology looks normal and we observed no significant differences between control and Alzheimer’s disease cases regarding the synaptic density, the ratio of excitatory and inhibitory synapses, or the spatial distribution of synapses. However, differences in the distribution of postsynaptic targets and synaptic shapes were found. Furthermore, a lower proportion of larger excitatory synapses in both strata were found in Alzheimer’s disease cases. Individuals in late stages of the disease suffered the most severe synaptic alterations, including a decrease in synaptic density and morphological alterations of the remaining synapses. Since Alzheimer’s disease cases show cortical atrophy, our data indicate a reduction in the total number (but not the density) of synapses at early stages of the disease, with this reduction being much more accentuated in subjects with late stages of Alzheimer’s disease. The observed synaptic alterations may represent a structural basis for the progressive learning and memory dysfunctions seen in Alzheimer’s disease cases.
Introduction
Alzheimer’s disease is a neurodegenerative disease that constitutes the most common cause of dementia. Symptoms associated with dementia range from difficulties with orientation, language and problem-solving to memory impairment and other cognitive skill deficits that affect a person’s ability to perform daily life activities (Alzheimer’s Association, 2020). Episodic memory loss and disorientation are among the first symptoms reported by Alzheimer’s disease patients (Wilson et al., 2006). Medial temporal lobe structures, consisting of the hippocampal formation and adjacent cortices, are essential for the proper functioning of spatial and declarative memory systems (Dickerson and Eichenbaum, 2010; Serrano-Pozo et al., 2011) and are the first areas affected in the progression of the disease (Braak and Braak, 1991).
Synaptic failure has been postulated as the main cause of Alzheimer’s disease pathology (Selkoe, 2002). While abnormal phosphorylated tau protein forming neurofibrillary tangles (NFTs) and aberrant amyloid-β deposition have been described as the main neuropathological hallmarks of Alzheimer’s disease, they have also been found in the aged brain with no apparent cognitive impairment (Mufson et al., 1999; Price et al., 2009; Markesbery, 2010; Ferrer, 2012). However, it has been proposed that different forms of these proteins directly or indirectly cause neuronal degeneration and dendritic spine and synapse alterations (Dorostkar et al., 2015; Forner et al., 2017; Chen et al., 2019). There is a wealth of evidence suggesting a disruption in synaptic activity in the Alzheimer’s disease brain. For instance, a reduction in the transcription of genes related to synaptic efficacy (Murphy, 2003; Yao et al., 2003; Kennedy et al., 2005; Marsh and Alifragis, 2018) has been reported in association with Alzheimer’s disease pathology. Additionally, dysregulation of excitatory synaptic function proteins—including postsynaptic density protein 95 (PSD-95) in hippocampal neurons (Counts et al., 2014) and synaptonuclear protein messengers (Marcello et al., 2018)—has been observed. Some studies have described a decrease in the number of glutamatergic NMDA (Greenamyre et al., 1985, 1987) and AMPA receptors (Dewar et al., 1991; Ginsberg et al., 2000, 2006), which both have implications for proper synaptic functioning. Synapse loss correlates with cognitive performance in Alzheimer’s disease (DeKosky and Scheff, 1990; Terry et al., 1991; Sze et al., 1997; Scheff and Price, 2003) and has been inferred mainly from the study of synaptic markers at the light microscope level (Masliah et al., 1990; Honer et al., 1992; DeKosky et al., 1996) or using transmission electron microscopy (TEM) (Scheff et al., 1990, 1993, 1996, 2006, 2007, 2011, 2014; Scheff and Price, 1993, 1998, 2001, 2003, 2006; Androuin et al., 2018). However, the study of the synaptic organization of the brain has accelerated in recent years because of the development of volume EM methods, which are becoming essential for 3D reconstructions at the ultrastructural level (DeFelipe, 2010). In this regard, we have shown that the combination of focused ion beam milling and scanning electron microscopy (FIB/SEM) is an excellent tool to examine the human brain obtained from autopsies, providing a new set of data about the human synaptic organization in both health and disease (Blazquez-Llorca et al., 2013; Domínguez-Álvaro et al., 2018, 2019; Montero-Crespo et al., 2020). Nevertheless, FIB/SEM has not yet been used to study the hippocampus of Alzheimer’s disease individuals.
The cornu ammonis (CA) 1 field of the hippocampal formation in Alzheimer’s disease subjects has been observed to be especially vulnerable to amyloid and tau pathology, particularly in the medial part of this field. Differences are also observed between layers; for instance, the stratum lacunosum-moleculare seems to be the layer that is least affected by the amyloid pathology (free of plaques) (Furcila et al., 2018), and it also shows milder tau pathology than in other layers, particularly the stratum moleculare (Thal et al., 2000; Llorens-Martín et al., 2014; Braak and Del Tredici, 2020). CA1 pyramidal cells are especially susceptible to neuronal loss and dendritic alterations in Alzheimer’s disease patients (Hyman et al., 1990; West et al., 2004; Andrade-Moraes et al., 2013; Llorens-Martín et al., 2014; Furcila et al., 2019).
To our knowledge, only one ultrastructural study has been carried out in the CA1 field of the Alzheimer’s disease human hippocampus, specifically in stratum radiatum using TEM (Scheff et al., 2007). In this study, the analysis was restricted to the total number of synapses and the length of the postsynaptic densities. In the present study, we performed a 3D analysis of the synaptic organization in the medial CA1 field, using FIB/SEM in 10 human brain autopsies (five subjects with no known neurological alterations and five Alzheimer’s disease cases with different degrees of pathology), with short post-mortem delays (<4.5h). We examined the synaptic density and spatial distribution; synaptic types; synaptic morphology; and distribution of postsynaptic targets, as well as the synaptic shape and size. Furthermore, we used stereological methods to examine the volume fraction occupied by (i) the neuropil; (ii) somata of neurons and glia; and (iii) blood vessels, to determine if any change in these cortical elements occurred, in order to interpret the possible changes in synapses.
Materials and methods
Sample source and tissue processing
Human brain samples from five subjects with no recorded neurological or psychiatric alterations (considered to be a control group) and five cases with different degrees of Alzheimer’s disease pathology according to Braak stage (Braak and Braak, 1991) and CERAD neuropathological diagnosis (Mirra et al., 1991) (Supplementary Table 1) were obtained following the guidelines of the Institutional Ethical Comitte. The post-mortem delay was lower than 4.5 h in all cases. See further details in the Supplementary material for sample source and tissue processing, and immunohistochemistry.
Tissue processing for EM
Sections (150-μm thick) containing the CA1 field were selected and post-fixed for 24 h in a solution of 2% paraformaldehyde, 2.5% glutaraldehyde (TAAB, G002) and 0.003% CaCl2 (Sigma, C-2661-500G) in 0.1 M sodium cacodylate buffer (Sigma, C0250-500G). The sections were treated with 1% OsO4 (Sigma, O5500), 0.1% ferrocyanide potassium (Probus, 23345) and 0.003% CaCl2 in 0.1 M sodium cacodylate buffer for 1 h at room temperature. Sections were then stained with 2% uranyl acetate (EMS, 8473), dehydrated and flat-embedded in Araldite® (TAAB, E021) for 48 h at 60°C (DeFelipe and Fairen, 1993). See further details in the Supplementary material for tissue processing for EM, volume fraction estimation of cortical elements and atrophy assessment.
FIB/SEM technology
After processing for EM, the Araldite® block containing the tissue was used to perform a 3D study of the samples with combined FIB/SEM technology (Crossbeam® 540 electron microscope, Carl Zeiss NTS). The FIB permits the removal of thin layers of material from the sample surface on a nanometre scale, while the SEM takes images in an automated sequential manner using the backscattered electron detector. This allows long series of photographs of a 3D sample of selected regions to be acquired with a quality and resolution similar to those obtained by TEM (Merchán-Pérez et al., 2009) (Fig. 1). Image resolution in the x-y plane was 5 nm/pixel. Resolution in the z-axis (section thickness) was 20 nm, and image size was 2048 × 1536 pixels. These parameters were optimized to allow a large enough field of view to be obtained, in a reasonable amount of time, while ensuring that the resolution was sufficient for the synapses to be clearly identified (around 12 h per stack of images). To locate CA1 strata, the last semithin section (immediately adjacent to the block surface) was stained with toluidine blue, examined under the light microscope and photographed (Fig. 1A and B) (see the Supplementary material for details on the location of CA1 strata with SEM). The regions selected for the acquisition of the stacks of FIB/SEM images were from the neuropil, where more synaptic contacts take place, i.e. avoiding the neuronal and glial somata, blood vessels, large dendrites and myelinated axons (DeFelipe et al., 1999) (Fig. 1C–F). Furthermore, the selected neuropil was taken from regions lacking plaques for two reasons: (i) to eliminate the effect of alterations of synapses in the vicinity of plaques, which have been previously described (Blazquez-Llorca et al., 2013); and (ii) because it has been previously estimated that the volume fraction occupied by plaques in the CA1 field is 3.1% (Furcila et al., 2019); thus, most neuropil is free of plaques.
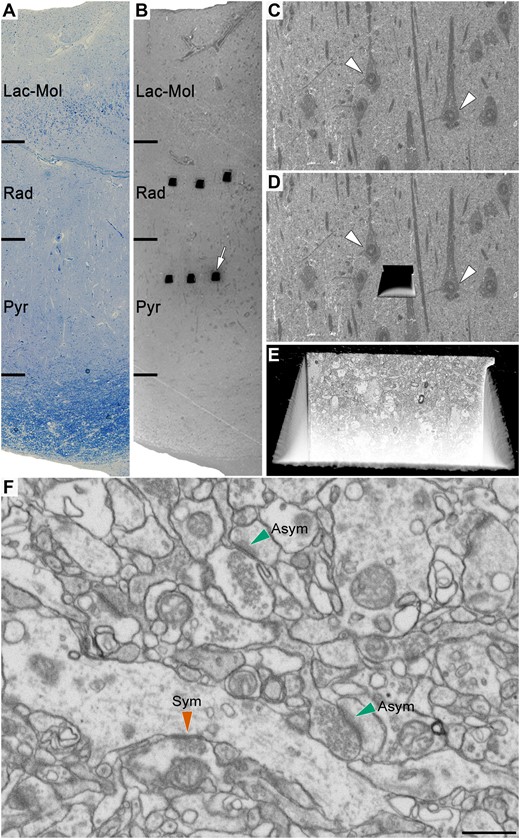
Correlative light/electron microscopy analysis of CA1 using FIB/SEM. An early-stage Alzheimer’s disease case (Case IF13, see Supplementary Table 1) is provided here as an example. (A and B) Images show a 1-µm thick semithin section stained with toluidine blue (A) adjacent to the block surface visualized with the SEM (B). This allows the exact location of the region of interest to be determined. The white arrow in B points to one of the trenches made in the neuropil (three per layer). (C) Higher magnification of B to facilitate the selection of the region of interest in the neuropil. (D) Same region as in C with a trench made to expose the tissue and to acquire the FIB/SEM stack of images. White arrowheads in C and D point out some neuronal somata. (E) Augmentation in the front of the trench allows the ultrastructural appraisal of the sample where the stack of images at the final magnification (5 nm/pixel) will be taken. (F) An example of a FIB/SEM image from a stack of serial sections. Some synapses have been marked with green (asymmetric synapses) or red arrowheads (symmetric synapses). Asym = asymmetric synapses; Lac-Mol = stratum lacunosum-moleculare; Pyr = stratum pyramidale; Rad = stratum radiatum; Sym = symmetric synapses. Scale bar in F = 335 µm in A and B; 50 µm in C and D; 6 µm in E; 750 nm in F.
Thirty stacks of images from the neuropil of stratum pyramidale and stratum radiatum of the CA1 field of Alzheimer’s disease cases were obtained (three stacks per case and region in all five cases, with a total volume studied of 12 542 μm3). The volume per stack ranged from 356 μm3 to 727 μm3 (225 to 459 images, respectively). The data obtained from these stacks of images was compared to the data obtained in the same region of five control cases, previously described by Montero-Crespo et al. (2020).
3D synaptic analysis
Classification of synapses and postsynaptic target identification
The stacks of images obtained with FIB/SEM were analysed using EspINA software (Espina Interactive Neuron Analyzer, 2.4.1; Madrid, Spain; https://cajalbbp.es/espina/). As previously discussed in Merchán-Pérez et al. (2009), there is a consensus for classifying cortical synapses into asymmetric synapses (or type I) and symmetric synapses (or type II). The main characteristic distinguishing these synapses is the prominent or thin PSD, respectively. Nevertheless, in single sections, the synaptic cleft and the pre- and postsynaptic densities are often blurred if the plane of the section does not pass at right angles to the synaptic junction. Since EspINA allows navigation through the stack of images, it was possible to unambiguously identify every single synapse as asymmetric or symmetric based on the thickness of the PSD (Merchán-Pérez et al., 2009). Synapses with prominent PSDs are classified as asymmetric synapses, while those with thin PSDs are classified as symmetric synapses (Fig.1F and Supplementary Fig. 1)(Gray, 1959; Peters et al., 1991; Montero-Crespo et al., 2020). If a particular synapse was ambiguous (which occurred rarely), additional synapses made by the same axon were analysed until the synapse could be accurately classified. The assignment of a synapse as asymmetric or symmetric was always performed by the EspINA software user.
Synaptic junction shapes were also examined with EspINA and were classified into four morphological categories: macular, horseshoe-shaped, perforated or fragmented (Fig. 2D). Additionally, synapses were classified based on the postsynaptic targets as axospinous synapses (synapses on dendritic spines: on the head or the neck) and axodendritic synapses (synapses on dendritic shafts: aspiny or spiny). Dendritic shafts were classified as spiny when dendritic spines could be observed emerging from the shaft and as aspiny when no dendritic spines could be observed emerging from the shaft (Supplementary Fig. 2). Only clearly identifiable postsynaptic elements were quantified (i.e. elements that were unambiguously identified from navigating through the stack of images; Fig. 3A–E and Supplementary Fig. 2) (for further details, see Montero-Crespo et al., 2020).

Synaptic density, proportion of asymmetric and symmetric synapses, and proportion of synaptic shapes in the stratum pyramidale (str pyr) and radiatum (str rad) of CA1 in control and Alzheimer’s disease cases. (A and B) Graphs showing the mean synaptic density in stratum pyramidale (A) and stratum radiatum (B) respectively, per case and group. In both A and B, controls are denoted as circles and Alzheimer’s disease cases as squares; the black line shows the mean value. (C) Percentages of asymmetric and symmetric synapses in CA1 stratum pyramidale and stratum radiatum in control and Alzheimer’s disease cases. (D) Examples of the different types of synapses based on the shape of the synaptic junction: macular (Mac), horseshoe-shaped (HS), perforated (Perfor) and fragmented (Frag). The upper and lower rows show examples of shapes of asymmetric and symmetric synapses, respectively. (E and F) Percentages of the different types of synaptic shapes within the population of asymmetric synapses (E) and symmetric synapses (F) in CA1 stratum pyramidale and stratum radiatum in both control and Alzheimer’s disease cases. Alzheimer = Alzheimer’s disease; asym = asymmetric synapses; sym = symmetric synapses. Statistical significance is represented by asterisks (***P < 0.001).
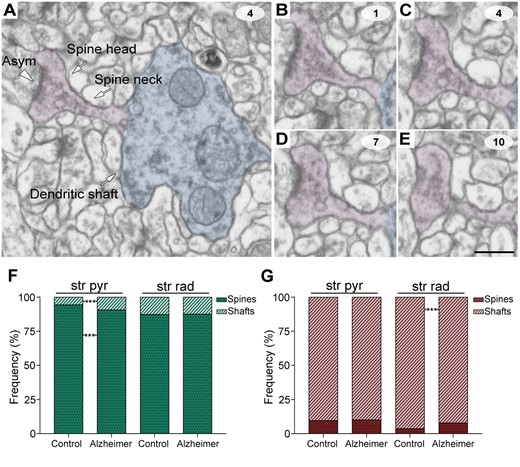
Postsynaptic target identification in serial electron microscopy images. (A) A crop from a FIB/SEM section to illustrate a dendritic shaft (blue) with a dendritic spine (purple) emerging from the shaft. An early-stage Alzheimer’s disease case (Case IF13, see Supplementary Table 1) is provided as an example. An axospinous asymmetric synapse (marked with an arrowhead) is established on the head of the spine. (B–E) Crops from FIB/SEM serial sections to illustrate an axospinous asymmetric synapse. The asymmetric synapse can be followed by navigating through the stack of images until it finishes (E); 60-nm thickness separation between images. (F and G) The percentage of axospinous and axodendritic synapses within the asymmetric synapses (F) and symmetric synapses (G) populations in the stratum pyramidale (str pyr) and radiatum (str rad) of CA1 in both control and Alzheimer’s disease cases. Alzheimer = Alzheimer’s disease; asym = asymmetric synapse. Statistical significance is represented by asterisks (***P < 0.001). Scale bar in E = 500 nm in A; 450 nm in B–E.
Morphological and spatial measurements
The 3D segmentation of synaptic junctions includes both the presynaptic density (active zone) and the PSD. Since the active zone and the PSD are located face to face, their surface areas are very similar and have a high correlation (R2 = 0.97; Schikorski and Stevens, 1997, 1999). Thus, as previously described in Morales et al. (2013), they can be simplified to a single surface and represented as the surface of apposition between the active zone and the PSD. This surface can be extracted from the 3D segmented synaptic junction (Morales et al., 2013) (Supplementary Fig. 3). For the sake of clarity, we refer to this surface as the synaptic apposition surface (SAS). The SAS lies approximately in the middle of the synaptic junction and adapts to its curvature. The SAS is a functionally relevant measure of the size of the synapses, as it includes both the active zone and the PSD. Both the size of the active zone and the area of the PSD are of great interest in terms of synaptic function, since they correlate with several synaptic functional parameters (see Morales et al., 2013 for more detailed information about SAS extraction and its relation to the active zone density and the PSD). We observed that the SAS area is highly correlated to the surface area (R2 = 0.96 for asymmetric synapses; R2 = 0.97 for symmetric synapses) and the volume (R2 = 0.91 for asymmetric synapses; R2 = 0.90 for symmetric synapses) of the 3D segmented synaptic junctions (Montero-Crespo et al., 2020). Additionally, the SAS adapts to the curvature of the synaptic junction, enabling a measure of the curvature of the synapse equal to one minus the ratio between the projected area of the SAS and the area of the SAS. This measurement would be 0 in a flat SAS and it would increase to a maximum of 1 as the SAS curvature increases. In the present work, we analysed the area, perimeter and curvature of the SAS.
All measurements were corrected for the tissue shrinkage that occurs during osmication and plastic-embedding of the vibratome sections containing the area of interest (as described by Merchán-Pérez et al., 2009; Montero-Crespo et al., 2020). Corrected and uncorrected data for each parameter are shown in Table 1.
Data regarding synapses in the stratum pyramidale and stratum radiatum of CA1
| CA1 stratum pyramidale | CA1 stratum radiatum | |||
|---|---|---|---|---|
| Control | Alzheimer’s disease | Control | Alzheimer’s disease | |
| Asymmetric, n | 5183 | 3864 | 3836 | 3023 |
| Symmetric, n | 196 | 169 | 172 | 106 |
| Synapses, n (asym+sym) | 5379 | 4033 | 4008 | 3129 |
| % Asymmetric | 96.36 | 95.81 | 95.71 | 96.61 |
| % Symmetric | 3.64 | 4.19 | 4.29 | 3.39 |
| CF volume, µm3 | 5400 (5260) | 6307 (6035) | 6007 (5697) | 6235 (6035) |
| n, asymmetric synapses/µm3 | 0.96 ± 0.18 (0.98 ± 0.20) | 0.61 ± 0.35 (0.64 ± 0.38) | 0.64 ± 0.19 (0.67 ± 0.22) | 0.48 ± 0.27 (0.53 ± 0.30) |
| n, symmetric synapses/µm3 | 0.04 ± 0.01 (0.04 ± 0.01) | 0.03 ± 0.00 (0.03 ± 0.01) | 0.03 ± 0.01 (0.03 ± 0.01) | 0.02 ± 0.01 (0.02 ± 0.01) |
| n, all synapses/µm3 | 0.99 ± 0.18 (1.02 ± 0.19) | 0.64 ± 0.35 (0.67 ± 0.38) | 0.67 ± 0.19 (0.70 ± 0.22) | 0.50 ± 0.28 (0.55 ± 0.31) |
| Intersynaptic distance, nm | 604.00 ± 38.08 (583.46 ± 36.79) | 712.05 ± 198.02 (687.84 ± 191.29) | 653.77 ± 69.51 (637.54 ± 67.15) | 747.73 ± 233.25 (722.31 ± 225.32) |
| Area of SAS asymmetric, nm2 | 88 061.63 ± 1038.49 (82 161.50 ± 968.91) | 76 631.01 ± 4722.18 (71 496.73 ± 4405.79) | 82 841.26 ± 1201.47 (77 290.90 ± 1120.97) | 77 424.94 ± 5040.62 (72 237.47 ± 4702.90) |
| Area of SAS symmetric, nm2 | 58 305.43 ± 2612.01 (54 398.67 ± 2437.01) | 55 840.81 ± 7480.99 (52 099.48 ± 6979.76) | 63 183.20 ± 2734.96 (58 949.93 ± 2551.72) | 64 383.92 ± 3309.07 (60 070.20 ± 3087.36) |
Data are presented as mean ± SD except for area of SAS (mean ± SEM). Data in parentheses are not corrected with the shrinkage factor. CF = counting frame.
Finally, spatial point pattern analysis was performed to study the spatial distribution of synapses (i.e. whether synapses are arranged in a uniform, random or clustered distribution) (Anton-Sanchez et al., 2014; Merchán-Pérez et al., 2014). For each of the 30 samples from Alzheimer’s disease cases, we calculated three functions commonly used for spatial point pattern analysis: F, G and K functions (for a detailed description see Blazquez-Llorca et al., 2015). A sample was considered compatible with the complete spatial randomness (CSR) model when the observed F, G and K functions lay within the envelope generated by 100 simulations of the CSR model. To explore spatial distribution further, the distance of each synapse to its nearest synapse was measured. We used R software (R 3.5.1; Bell Laboratories, NJ, USA; https://www.r-project.org/) and the Spatstat package (Baddeley and Turner, 2005; Baddeley et al., 2015) (http://www.spatstat.org) for the calculations. See the Supplementary material for further details regarding the 3D synaptic analysis.
Statistical analysis
Chi-square (χ2) tests were applied to contingency tables for proportion analysis. To compare morphological parameters, Mann-Whitney U non-parametric tests, ANOVA and Kolmogorov-Smirnov tests were applied when pertinent. Additionally, one post hoc analysis per bin was performed with χ2 tests after applying Kolmogorov-Smirnov tests to compare the proportions in each bin. Furthermore, Spearman’s rank correlation coefficient (rs) tests were performed for the analysis of correlations between quantitative variables (since the normality criterion was not met), while two-way ANOVAs were used to evaluate the effect of sex on different parameters analysed at the optical and electron microscope level. Statistical significance was considered as P < 0.05 when the sample size was equal to the number of subjects (i.e. ANOVAs, Mann-Whitney U-test and Spearman’s rank correlation coefficient test), and P < 0.001 when the sample size was equal to the number of synapses (i.e. Kolmogorov-Smirnov and χ2 tests), in order to avoid overestimation of the differences due to a large sample size. All exact P-values can be found in the Supplementary material. The studies were carried out with GraphPad Prism statistical package (Prism 7.00 for Windows, GraphPad Software Inc., USA), SPSS software (IBM SPSS Statistics for Windows, Version 24.0. Armonk, NY: IBM Corp) and R Project software. For further details see the Supplementary material.
Data availability
Most data are available in the main text or the Supplementary material. The datasets from control cases used and analysed during the current study are published on the EBRAINS Knowledge Graph (https://doi.org/10.25493/6HRE-F2Y and https://doi.org/10.25493/NRFB-7N5). Any other data that support the findings of this study are available from the corresponding author upon reasonable request.
Results
Data regarding the synaptic organization of the human CA1 field in the five control subjects have been previously published and more detailed information can be found therein (Montero-Crespo et al., 2020). What follows are the alterations of synaptic circuits in the stratum pyramidale and stratum radiatum of CA1 in Alzheimer’s disease cases in comparison with control cases. First, the global findings in the Alzheimer’s disease group are outlined, followed by a final section emphasizing differences between Alzheimer’s disease cases.
Cortical atrophy, histopathological findings and volume fraction of cortical elements
Alzheimer’s disease cases showed a markedly lower total surface area of the hippocampal formation that was apparent with the naked eye (Fig. 4A and G); we estimated it to be ∼30% lower (2.01 ± 0.49 cm2 in controls, 1.38 ± 0.36 cm2 in Alzheimer’s disease cases; Supplementary Tables 2 and 3). In the case of the CA1 thickness, it was even lower than control (39% lower; 2.70 ± 0.62 mm in controls, 1.63 ± 0.27 mm in Alzheimer’s disease; Fig. 4D, J and Supplementary Tables 2 and 3). Immunostaining for anti-amyloid-β and anti-PHF-Tau revealed the presence of a variable number of immunoreactive amyloid-β-plaques as well as PHF-Tau-AT8 and PHF-Tau-PHF1 neurons in the Alzheimer’s disease cases, whereas in control cases these neuropathological hallmarks were absent or very sparse; this was as expected considering the neuropathological diagnosis (Fig. 4, Supplementary Fig. 4, Supplementary Tables 1 and 4). We found a high positive correlation between the Braak stage and the density of PHF-Tau-AT8 (rs = +0.77, P = 0.014, R2 = 0.59) and PHF-Tau-PHF1 immunoreactive neurons (rs = +0.96, P = 2.2 × 10⁻¹⁶, R2 = 0.92), and between the two types of PHF-Tau immunoreactive neurons (rs = +0.83, P = 0.0052, R2 = 0.69). Additionally, a moderate-high correlation between the CERAD stage and the area fraction occupied by amyloid-β plaques in the medial CA1 was found (in stratum pyramidale: rs = +0.81, P = 0.0077, R2 = 0.66; in stratum radiatum: rs = +0.67, P = 0.039, R2 = 0.45).
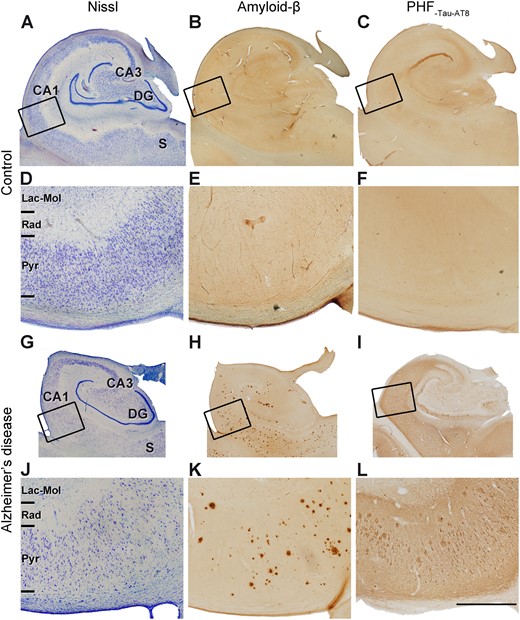
Micrographs of the human hippocampus containing the CA1 field. (A–C and G–I) Adjacent sections stained with Nissl (A and G), immunostained for anti-amyloid-β (Aβ) (B and H) and anti-PHF-Tau-AT8 (C and I), in a control case (AB2) (A–C) and Alzheimer’s disease (Case VK11) (G–I). Rectangles in A–C and G–I show regions at higher magnification in D–F and J–L, respectively. Note the clear cortical atrophy in the Alzheimer’s disease case. (H, I, K and L) Panels show the presence of immunostained amyloid-β-positive plaques and PHF-Tau-AT8-positive neurons in the CA1 field of the Alzheimer’s disease case. DG = dentate gyrus; Lac-Mol = stratum lacunosum-moleculare; Pyr = stratum pyramidale; Rad = stratum radiatum; S = subiculum. Scale bar in L = 5 mm in A–C and G–I; 1.25 mm in D–F and J–L.
To evaluate the possible loss of cortical elements in the CA1 field of Alzheimer’s disease cases, the volume fraction of blood vessels, glial cell bodies, neuronal cell bodies and neuropil was estimated. In control subjects (Montero-Crespo et al., 2020), these volumes were 5.06%, 0.60%, 4.23% and 90.11%, respectively, in stratum pyramidale; and 4.79%, 0.88%, 0.15% and 94.19%, respectively, in stratum radiatum (Supplementary Tables 2 and 5). In Alzheimer’s disease cases, the volumes occupied by these elements were 3.16%, 0.58%, 2.69% and 93.57%, respectively, in stratum pyramidale; and 3.86%, 0.48%, 0.10% and 95.56%, respectively, in stratum radiatum (Supplementary Tables 2 and 5). A significantly lower volume occupied by blood vessels (38% lower) and a higher volume occupied by the neuropil (4% higher) were found in Alzheimer’s disease cases in stratum pyramidale (t-test, P = 0.009 and P = 0.005, respectively; Supplementary Fig. 5B). A non-significant decrease in the volume fraction of neurons was found in this layer (t-test, P = 0.051; Supplementary Fig. 5B). There were no differences between control and Alzheimer’s disease cases for any of the above-mentioned cortical elements in stratum radiatum (t-test, P > 0.05; Supplementary Fig. 5D).
Synaptic density and proportion of asymmetric and symmetric synapses
A total of 7162 synapses from Alzheimer’s disease cases (4033 synapses in stratum pyramidale, total tissue volume analysed 6307 µm3; 3129 synapses in stratum radiatum, total tissue volume analysed 6235 µm3; Table 1) were completely reconstructed and classified. The number of synapses per volume unit (i.e. synaptic density) was calculated by dividing the total number of synapses by the volume of the counting frame.
A lower synaptic density (taking both asymmetric and symmetric synapses together) was observed in Alzheimer’s disease cases compared to control cases, but these differences were not significant in stratum pyramidale (0.99 ± 0.18 synapses/μm3 control, 0.64 ± 0.35 synapses/μm3 Alzheimer’s disease; Mann-Whitney U-test, P = 0.059; Fig. 2A and Table 1) or in stratum radiatum (0.67 ± 0.19 synapses/μm3 control, 0.52 ± 0.28 synapses/μm3 Alzheimer’s disease; Mann-Whitney U-test, P = 0.841; Fig. 2B and Table 1).
The ratio of asymmetric to symmetric synapses was also analysed and no differences were found between Alzheimer’s disease and control cases (close to a ratio of 96:4 in both layers and groups; Fig. 2C and Table 1; χ2, P > 0.001).
Synaptic spatial distribution
Our results indicate a clear fit to a CSR model, since F, G and K functions closely resemble the theoretical curve that these functions represent, both in the control and the Alzheimer’s disease cases (data not shown). That is, the spatial distribution of synapses fitted into a random distribution in all subjects.
The distance of each synapse to its nearest neighbour was also calculated. Although the mean distance was bigger in the Alzheimer’s disease group in both the stratum pyramidale (604.00 ± 38.08 nm control, 712.10 ± 198.00 nm Alzheimer’s disease; Table 1 and Supplementary Tables 6 and 7) and the stratum radiatum (653.77 ± 69.51 nm control, 747.70 ± 233.30 nm Alzheimer’s disease; Table 1 and Supplementary Tables 6 and 7), these differences were not statistically significant (Mann-Whitney U-test, P > 0.05).
Postsynaptic targets
After discarding synapses whose postsynaptic target could not be unambiguously identified, 4150 synapses from Alzheimer’s disease cases were analysed (2383 in stratum pyramidale and 1767 in stratum radiatum; Figs 3, 5 and Supplementary Tables 8 and 9). As previously described in control cases (Montero-Crespo et al., 2020), in Alzheimer’s disease cases the most abundant type of synapses were axospinous asymmetric synapses (>82%), followed by axodendritic asymmetric synapses (>8%) in both stratum pyramidale and stratum radiatum. Axospinous symmetric synapses were very scarce in both layers (<0.70%; Figs 3, 5 and Supplementary Tables 8 and 9). Asymmetric contacts were more frequently established on dendritic spines, while symmetric contacts were more often located on dendritic shafts (χ2, P < 0.001; Fig. 3).
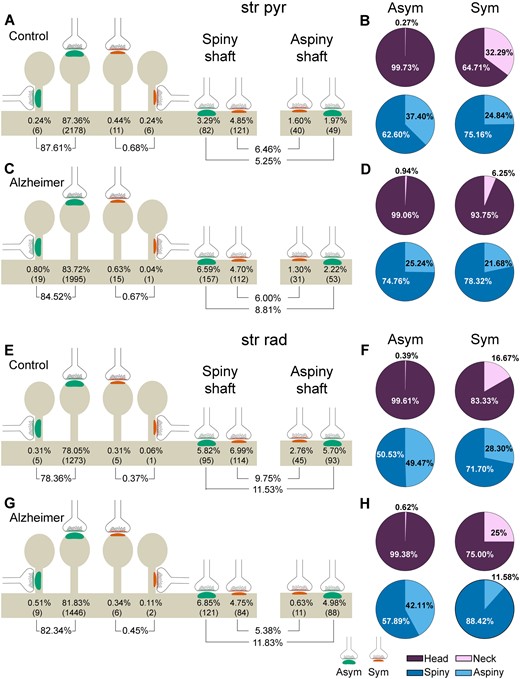
Representation of the distribution of synapses according to their postsynaptic targets in the stratum pyramidale (str pyr) and radiatum (str rad) of CA1 in control and Alzheimer’s disease cases. (A, C, E and G) Percentages of axospinous (both on the head and the neck of dendritic spines) and axodendritic (both spiny and aspiny) asymmetric synapses (green) and symmetric synapses (red). The numbers of each synaptic type are shown in brackets. (B, D, F and H) Pie charts to illustrate the proportion of asymmetric and symmetric synapses according to their location as axospinous synapses (i.e. on the head or neck of the spine) or axodendritic synapses (i.e. spiny or aspiny shafts). Alzheimer = Alzheimer’s disease; Asym = asymmetric synapses; Sym = symmetric synapses.
However, differences in the prevalence of postsynaptic targets were observed between the two groups in each of the two strata (χ2, P < 0.001). A lower proportion of axospinous asymmetric synapses was observed in Alzheimer’s disease cases in stratum pyramidale (4% lower: 87.61% in control cases versus 84.52% in Alzheimer’s disease cases; χ2, P = 0.001), along with a higher frequency of axodendritic asymmetric synapses (68% higher: 5.25% in control cases versus 8.81% in Alzheimer’s disease cases; χ2, P = 1.22 × 10⁻⁶) compared to controls (Fig. 5A and C). In the case of stratum radiatum, the proportion of axodendritic symmetric synapses was lower in Alzheimer’s disease cases compared to controls (45% lower: 9.75% in control cases versus 5.38% in Alzheimer’s disease cases; χ2, P = 1.62 × 10⁻⁶; Fig. 5E and G).
No differences were observed in the proportion of axospinous synapses established on the head or the neck of the dendritic spine; such synapses were more frequently found on the head in both groups and strata (>99%; χ2, P > 0.001; Fig. 5 and Supplementary Table 8). Likewise, no differences were observed regarding the proportion of axodendritic synapses established on spiny or aspiny shafts (ranging from 60.23% to 76.20% and from 23.80% to 39.77%, respectively; χ2, P > 0.001; Fig. 5 and Supplementary Table 8). However, in stratum radiatum, a slight tendency for a higher proportion of axodendritic symmetric synapses on spiny shafts was found in the case of Alzheimer’s disease (12% higher: 71% in control cases versus 88% in Alzheimer’s disease cases; χ2, P = 0.0037; Supplementary Table 8).
Dendritic spines innervated by more than one synapse were observed in small numbers in control and Alzheimer’s disease cases in both strata (<2%; Supplementary Fig. 6 and Supplementary Table 10). Nevertheless, no significant differences were found in the frequency of these synapses between the groups (χ2, P > 0.001).
Synaptic shape
Most asymmetric and symmetric synapses presented a macular shape in Alzheimer’s disease cases (>81%), while synapses with more complex shapes (i.e. horseshoe-shaped, perforated or fragmented) were less frequent (Fig. 2D–F and Supplementary Tables 11–13), as previously described in control cases (Montero-Crespo et al., 2020). Nevertheless, the proportion of perforated asymmetric synapses was significantly diminished in Alzheimer’s disease cases in stratum pyramidale (7.16% and 5.17%, for control and Alzheimer’s disease cases, respectively; i.e. 28% lower; χ2, P = 0.0001; Supplementary Tables 11 and 12). However, no differences were observed in either stratum radiatum [although there was a tendency for a lower proportion of perforated asymmetric synapses in Alzheimer’s disease cases (χ2, P = 0.0093)] or in the proportion of the different synaptic shapes of inhibitory contacts in any layer (χ2, P > 0.001 in all comparisons; Supplementary Tables 11–13).
Synaptic size
To examine size-related synaptic features further, the SAS area, perimeter and curvature were studied. No significant differences were observed in the mean values of these parameters between control subjects and Alzheimer’s disease cases, regardless of the synaptic type, asymmetric or symmetric synapses (Mann-Whitney U-test, P > 0.05; Table 1 and Supplementary Table 14). However, when analysing the frequency distribution of the two types of synapses, Alzheimer’s disease cases showed a higher number of asymmetric synapses with smaller SAS area, perimeter and curvature than control cases in both stratum pyramidale (Kolmogorov-Smirnov, P < 0.0001; Fig. 6A, Supplementary Fig. 7A, C and Supplementary Tables 14 and 15) and stratum radiatum (Kolmogorov-Smirnov, P < 0.0001; Fig. 6B, Supplementary Fig. 7B, D and Supplementary Tables 14 and 15). This finding was further supported by post hoc comparisons applying χ2 tests to each bin. For instance, most SAS area values for asymmetric synapses (∼70%) were found to be between 20 000 nm2 and 80 000 nm2, both in stratum pyramidale and stratum radiatum in control and Alzheimer’s disease cases. However, higher proportions of asymmetric synapse area values between 20 000 nm2 and 40 000 nm2 in stratum pyramidale and between 20 000 nm2 and 60 000 nm2 in stratum radiatum were found in Alzheimer’s disease cases (χ2, P < 0.0001); whereas lower proportions of asymmetric synapse area values between 100 000 nm2 and 140 000 nm2 in stratum pyramidale and between 80 000 nm2 and 120 000 nm2 in stratum radiatum were found in Alzheimer’s disease cases (χ2, P < 0.0001). No significant differences were found between the frequency distribution of symmetric synapses in Alzheimer’s disease and control (Kolmogorov-Smirnov, P > 0.001).
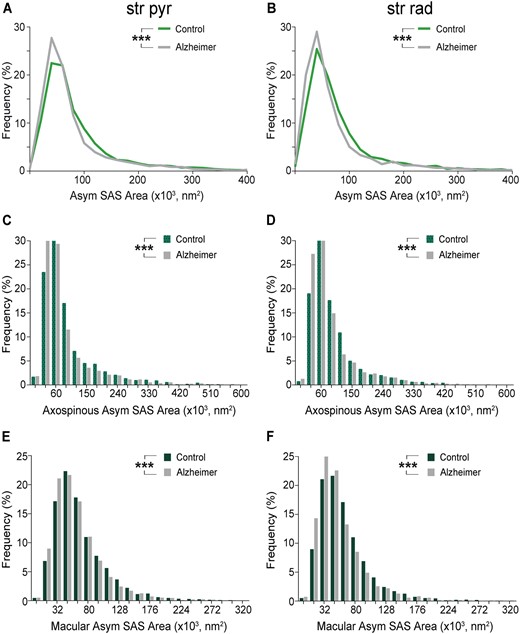
Graphs showing the SAS area of asymmetric synapses in the stratum pyramidale (str pyr) and radiatum (str rad) of CA1 in control and Alzheimer’s disease cases. (A and B) Frequency distributions of the SAS areas of asymmetric synapses in controls (green line) and Alzheimer’s disease cases (grey line) in stratum pyramidale (A) and stratum radiatum (B). (C and D) Frequency distributions of the SAS areas of axospinous asymmetric synapses in controls and Alzheimer’s disease cases in stratum pyramidale (C) and stratum radiatum (D). (E and F) Frequency distributions of the SAS areas of macular asymmetric synapses in controls and Alzheimer’s disease cases in stratum pyramidale (E) and stratum radiatum (F). Asymmetric synapses with the largest areas are less frequent in Alzheimer disease cases (see text for further details). Alzheimer = Alzheimer’s disease; Asym = asymmetric synapses. Statistical significance is represented by asterisks (***P < 0.001).
Additionally, no differences were found in the mean values of these synaptic size parameters between controls and Alzheimer’s disease cases when analysing the different types of synapses (i.e. focusing on the shape of the synaptic junction or the postsynaptic targets) (Mann-Whitney U-test, P > 0.05; Supplementary Tables 16–23). However, axospinous asymmetric synapses with the smallest sizes were also more frequently observed in Alzheimer’s disease cases in both stratum pyramidale and stratum radiatum (Kolmogorov-Smirnov, P < 0.001; Fig. 6C, D, Supplementary Fig. 8E–H and Supplementary Tables 16–18), while no differences were observed in the case of axodendritic synapses or axospinous symmetric synapses (Kolmogorov-Smirnov, P > 0.001). Most axospinous asymmetric synapses had SAS area values between 30 000 nm2 and 90 000 nm2 (>70% in both layers and groups). Higher proportions of axospinous asymmetric synapse area values between 30 000 nm2 and 90 000 nm2 in stratum pyramidale and between 30 000 nm2 and 60 000 nm2 in stratum radiatum were found in Alzheimer’s disease cases (χ2, P < 0.0001), together with lower proportions of axospinous asymmetric synapse area values between 90 000 nm2 and 120 000 nm2 in both layers (χ2, P < 0.0001). Macular synapses were smaller than the rest of the more complex-shaped synapses in Alzheimer’s disease cases in both strata (ANOVA, P < 0.001 both for SAS area and perimeter; Supplementary Tables 19–23) as occurred in control cases (Montero-Crespo et al., 2020). Nevertheless, the frequency of macular asymmetric synapses with the smallest areas, perimeters and curvatures was higher in Alzheimer’s disease cases compared to controls in both strata (Kolmogorov-Smirnov, P < 0.001; Fig. 6E, F, Supplementary Fig. 8A–D and Supplementary Tables 19–23). As in asymmetric synapses and axospinous asymmetric synapses, most macular asymmetric synapses had SAS area values between 16 000 nm2 and 80 000 nm2 (>70% in both layers and groups). Higher proportions of macular asymmetric synapses between 16 000 nm2 and 48 000 nm2 were found in Alzheimer’s disease cases in both strata (χ2, P < 0.001) and lower proportions of macular asymmetric synapses between 64 000 nm2 and 160 000 nm2 were found in Alzheimer’s disease cases in stratum radiatum (χ2, P < 0.001).
Correlation analyses and effect of biological variables sex and age on synaptic measures
First, we evaluated the correlation between synaptic measures (density of synapses, proportion of asymmetric and symmetric synapses, proportion of synapses classified according to the postsynaptic target, proportion of synaptic shapes and synaptic size) and the cortical thickness, volume fraction occupied by neuronal cell bodies (in stratum pyramidale) and the degree of amyloid and tau pathology.
We found that the cortical thickness did not correlate with any of these synaptic parameters in any layer (rs ranging from −0.42 to +0.30, P > 0.05, R2 ranging from 0 to 0.17), while synaptic density in both stratum pyramidale and stratum radiatum had a high positive correlation with the volume fraction occupied by neuronal cell bodies (in stratum pyramidale) (in stratum pyramidale: rs = +0.77, P = 0.014, R2 = 0.59; in stratum radiatum: rs = +0.72, P = 0.025, R2 = 0.52). Moreover, a highly correlated inverse relationship was observed between synaptic density in stratum pyramidale and the degree of amyloid and tau pathology (rs = −0.74, P = 0.020, R2 = 0.55 for CERAD stage; rs = −0.70, P = 0.040, R2 = 0.49 for Braak stage). There was also a moderate inverse correlation between the volume fraction occupied by neuronal cell somata (in stratum pyramidale) and the degree of amyloid and tau pathology, measured by the area fraction occupied by amyloid-β-plaques in stratum pyramidale and the density of PHF-Tau-AT8-positive neurons in the medial CA1 (rs = −0.66, P = 0.044, R2 = 0.44 in both cases). All other evaluated correlations were not significant (rs ranging from −0.63 to −0.23, P > 0.05, R2 ranging from 0.05 to 0.40).
Second, we evaluated if there were any relationship between sex and age and the cortical thickness, the volume fraction occupied by neuronal cell bodies (in stratum pyramidale) and the degree of amyloid and tau pathology. Furthermore, we analysed the effect of sex and age on the synaptic measures (density of synapses, proportion of asymmetric and symmetric synapses, proportion of synapses classified according to the postsynaptic target, proportion of synaptic shapes and synaptic size).
We did not find evidence of an effect of sex on cortical thickness, volume fraction occupied by neuronal bodies or the degree of tau—or amyloid—pathology. On the contrary, we found a significant effect of the variable group (control versus Alzheimer’s disease) on all of the above-mentioned parameters (a thinner cortical thickness, a lower volume fraction occupied by neuronal bodies and a higher degree of tau and amyloid pathology in stratum pyramidale in Alzheimer’s disease cases), with the only exception being amyloid pathology in stratum radiatum. The interaction between sex and group did not exert any significant effect [two-way ANOVA (Sex × Group), P > 0.05 for sex effect, P < 0.05 for group effect, except for amyloid pathology in stratum radiatum, P > 0.05 for interaction]. We found a moderate-high positive correlation between age and the degree of amyloid pathology (rs = +0.85, P = 0.0039, R2 = 0.72 for area fraction occupied by amyloid-β-plaques in stratum pyramidale; rs = +0.77, P = 0.014, R2 = 0.59 for area fraction occupied by amyloid-β-plaques in stratum radiatum; rs = +0.88, P = 0.0022, R2 = 0.77 for CERAD stage) and tau pathology (rs = +0.69, P = 0.032, R2 = 0.48 for density of PHF-Tau-AT8 neurons; rs = +0.90, P = 0.0009, R2 = 0.81 for both density of PHF-Tau-PHF1 neurons and Braak stage). In relation to synaptic measures, we did not find an effect of sex in any of the synaptic parameters analysed in any layer [two-way ANOVA (Sex × Group), P > 0.05 for interaction, P > 0.05 for sex effect, P > 0.05 for group effect in all cases]. However, regarding age, a high inverse correlation was found between age and synaptic density in stratum pyramidale (rs = −0.74, P = 0.020, R2 = 0.55). All other evaluated correlations between age and parameters analysed at the optical level and synaptic parameters were not significant (rs ranging from −0.44 to +0.10, P > 0.05, R2 ranging from 0 to 0.36). It should be noted that these analyses should be interpreted with caution because of the relatively low sample size.
Individual differences between Alzheimer’s disease cases
Alzheimer’s disease cases with the most severe Braak/CERAD stage (CasesVK16 and VI/C; Supplementary Table 1) displayed hippocampal sclerosis, a pathological condition characterized by severe neuronal loss (Fig. 7B) that is often associated with Alzheimer’s disease (Dickson et al., 1994; Velez-Pardo et al., 2004; Attems and Jellinger, 2006; Amador-Ortiz et al., 2007). In addition, this Alzheimer’s disease case had numerous bundles of thick electron-dense filaments, which have been shown to make up the NFTs (Terry, 1963; Terry et al., 1964; Blazquez-Llorca et al., 2010) inside axons and dendrites, a pathological sign clearly visible at the EM level (Fig. 7 and Supplementary Fig. 9). This extreme degree of tau pathology was not observed in the neuropil of the other Alzheimer’s disease cases included here, not even in those with an advanced stage of the disease (Fig. 7). Furthermore, Case VK16 was the only case with both alpha-synuclein and TDP-43 in the hippocampus (Supplementary Table 1).
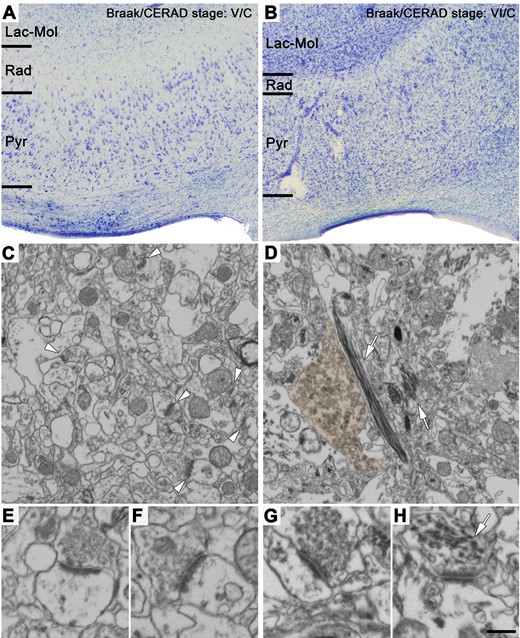
Nissl-stained sections and FIB/SEM images of the neuropil from Alzheimer’s disease cases showing different neuropathological stages. (A and B) Nissl-stained coronal sections of the human CA1 field of the hippocampus from Cases VK22 (A) and VK16 (B) (Braak/CERAD stage: V/C and VI/C, respectively; see Supplementary Table 1 for further details). Note in B that this case shows a dramatic neuronal loss (hippocampal sclerosis), in comparison to the other Alzheimer’s disease case shown in A. (C and D) FIB/SEM images of the neuropil of Cases VK22 (C) and VK16 (D). Some asymmetric synapses are marked with white arrowheads in C. Some bundles of thick electron-dense filaments inside neuronal processes are pointed out with white arrows in D. A dystrophic neurite has been pseudo-coloured in brown. (E–H) Asymmetric synapses shown at higher magnification from Cases VK22 (E and F) and VK16 (G). While the synapse observed in E–G are morphologically normal-looking, the synapse observed in H presents a presynaptic terminal virtually lacking synaptic vesicles and with intracellular thick electron-dense filaments (white arrow). These abnormal-looking synapses were only observed in Case VK16 (see also Supplementary Fig. 9). Lac-Mol = stratum lacunosum-moleculare; Pyr = stratum pyramidale; Rad = stratum radiatum. Scale bar in H = 350 µm in A and B; 762 nm in C and D; 354 nm in E–H.
In addition, Case VK16 had the most severe alterations; specifically, the volume fraction occupied by neuronal cell bodies in the stratum pyramidale of this case (1.22%) was found to be approximately three times lower than the mean of the control cases (4.23 ± 1.07%; Supplementary Tables 2 and 5). This lower value was around half that of the mean of the other Alzheimer’s disease cases, (3.05 ± 0.75%; Supplementary Table 5). The synaptic density for Case VK16 was also dramatically lower (around 10 times lower) compared to controls, and also lower than that of the other Alzheimer’s disease cases, in both strata (Fig. 2A, B and Supplementary Tables 6 and 7). Moreover, this Alzheimer’s disease case had a much lower proportion of asymmetric synapses in stratum pyramidale (ratio of asymmetric to symmetric synapses, 54:46) than the controls and the other Alzheimer’s disease subjects, while it remained the same in stratum radiatum (95:5). Finally, this Alzheimer’s disease case presented a clear difference in the proportion of postsynaptic targets: the presence of axospinous asymmetric synapses was much lower than that observed in the other cases (control and Alzheimer’s disease cases) in both stratum pyramidale (82–92% in controls and other Alzheimer’s disease cases versus 16% in Case VK16; Supplementary Table 9) and, even more so, in stratum radiatum (67–92% in controls and other Alzheimer’s disease cases versus 9% in Case VK16; Supplementary Table 9).
The two Alzheimer’s disease cases with the most advanced neuropathological status (Cases VK16 and VK22; Supplementary Table 1) exhibited cumulative frequency distributions of the SAS areas of asymmetric synapses skewed to the left in stratum pyramidale (particularly Case VK16; Kolmogorov-Smirnov, P < 0.001 in all comparisons, with the only exception of the comparison between Case VK22 versus Case VK11, P = 0.02; Supplementary Fig. 7E and Supplementary Table 15). This observation reflects a marked reduction in the number of larger asymmetric synapses in very advanced phases of the disease. This feature was also observed in Case VK22 in stratum radiatum, but not in Case VK16 (Kolmogorov-Smirnov, P < 0.0001 in all comparisons; Supplementary Fig. 7F and Supplementary Table 15). However, as stated above, we failed to find a correlation between the degree of amyloid and tau pathology and the synaptic size parameters in any layer. Another interesting finding was that one control case (Case AB4, the oldest case; Supplementary Table 1) had a notably higher number of asymmetric synapses with a large size in both strata in comparison to the rest of the cases (Kolmogorov-Smirnov, P < 0.0001 in all comparisons in stratum pyramidale, P < 0.001 in all comparisons in stratum radiatum, with the exception of Case AB4 versus Case M17, P = 0.003, Case AB4 versus Case IF13, P = 0.056, and Case AB4 versus Case VK16, P = 0.492; Supplementary Fig. 7E, F and Supplementary Table 15). However, as stated above, we failed to find a correlation between the age and the synaptic size parameters in any layer within the control group.
Ultrastructural characteristics of the synapses
When analysing the ultrastructural characteristics of the synapses, clear alterations were only observed in Case VK16. The remaining Alzheimer’s disease cases had normal-looking synapses (Figs 1F, 3A–E, 7C, E, F and Supplementary Figs 1A–E, K–O, 2 and 3A–D) that were similar to those in the control cases (Supplementary Fig. 1F–J and P–T; Montero-Crespo et al., 2020). A close examination of the ultrastructure of Case VK16 revealed a number of alterations, including synapses displaying abnormal clusters of synaptic vesicles located far from the active zone and synapses with very few presynaptic vesicles or ones that were totally lacking presynaptic vesicles but showing thickened pre- and postsynaptic densities resembling puncta adherens (Fig. 7H and Supplementary Fig. 9). Despite some normal-looking synapses, with vesicles docked to the presynaptic terminal membranes, found in Case VK16 (Fig. 7G), the vast majority exhibited the above-described abnormal characteristics.
Discussion
This is the first extensive study performing a 3D analysis of the synaptic alterations in the hippocampal CA1 field from Alzheimer’s disease cases. FIB/SEM technology allows the examination of a very high number of synapses in serial sections (Merchán-Pérez et al., 2009). In addition, since we used human brain tissue from autopsy with a post-mortem time of less than 4.5 h, the ultrastructural quality of the tissue analysed is of very high quality. Consequently, the results can be considered robust despite the relatively few cases examined in this study (five Alzheimer’s disease cases). However, it is clear that the data cannot be generalized to the whole population of Alzheimer’s disease, since it is well known that there is great variability between individuals regarding both clinical and pathological characteristics. Therefore, our study can be considered as a further step to tackle the issue of the synaptic alterations in Alzheimer’s disease cases, but it would be necessary to validate our results, both in a larger number of individuals and in additional brain regions.
Keeping in mind the above constraints, our main findings at the light microscope level were as follows: (i) a smaller surface area of the hippocampus and a thinner CA1 in the Alzheimer’s disease cases; and (ii) a significantly lower volume occupied by blood vessels, a significantly higher volume fraction of neuropil and a tendency for a lower volume fraction of neuronal cell bodies in the Alzheimer’s disease cases. At the ultrastructural level, our main findings can be summarized as follows: (i) no significant differences were found in the synaptic density, the proportion of asymmetric and symmetric synapses, or the spatial distribution of synapses between control and Alzheimer’s disease cases; (ii) a lower proportion of axospinous asymmetric synapses and a higher proportion of axodendritic asymmetric synapses in stratum pyramidale and a lower proportion of axodendritic symmetric synapses in the stratum radiatum of Alzheimer’s disease cases; (iii) a lower proportion of perforated asymmetric synapses in stratum pyramidale and a lower proportion of large asymmetric synapses (mainly axospinous and macular synapses) in both strata in Alzheimer’s disease cases; and (iv) synapses in the Alzheimer’s disease cases had a normal-looking morphology, except in the case showing the most severe pathological alterations, who displayed the lowest number of synapses and the majority of the synapses had an abnormal-looking morphology. Correlation analyses showed that (i) synaptic density correlated positively in stratum pyramidale and stratum radiatum with the volume fraction occupied by neuronal bodies in stratum pyramidale, but correlated negatively in stratum pyramidale with age and the degree of amyloid and tau pathology (CERAD and Braak stage); and (ii) age correlated positively with the degree of amyloid and tau pathology, while sex did not have an effect on any parameter evaluated at the light microscope and the ultrastructural level.
Differences in cortical elements at the light microscope level
Differences in the volume occupied by cortical elements (blood vessels, cell bodies and neuropil) were detected in stratum pyramidale. Regarding the volume occupied by blood vessels, it was 38% lower in Alzheimer’s disease cases. These results are in line with previous studies stressing vascular deterioration in Alzheimer’s disease. Microvascular changes in the brain have been documented both in normal ageing and in Alzheimer’s disease (Weller et al., 2009). More specifically, it has been reported that in CA1 there is a decrease in capillary diameters during the progression of Alzheimer’s disease (Bouras et al., 2006). Mounting evidence supports cerebrovascular dysfunction contributing to dementia and Alzheimer’s disease (Zlokovic, 2011; Montine et al., 2014; Montagne et al., 2015; Snyder et al., 2015; Sweeney et al., 2015; Nelson et al., 2016). According to this hypothesis, synaptic and neurological dysfunction may come as a result of vascular disruption, which could lead to an entry of neurotoxic molecules in the brain and to improper energy metabolite and nutrient delivery, among other factors (Zlokovic, 2008, 2011; Sagare et al., 2012; Nelson et al., 2016).
Regarding loss of neurons, although we found a tendency towards a decrease (albeit non-significant, P = 0.051) in the volume fraction occupied by neurons, CA1 was 40% thinner in Alzheimer’s disease cases, indicating a reduction in the total number of neurons. This is in line with previous studies reporting the loss of neurons in Alzheimer’s disease in several brain regions, including the hippocampus (Van Hoesen et al., 1991; Scott et al., 1992; Gomez-Isla et al., 1996; West et al., 2004; Šimić et al., 2017). More specifically, in the hippocampus, we have shown recently that neuronal density in CA1 is critically reduced in Alzheimer’s disease cases, particularly when accompanied by hippocampal sclerosis (Furcila et al., 2019).
Synaptic alterations
Synaptic density, proportion and spatial distribution
No differences regarding synaptic density were observed between control cases and Alzheimer’s disease cases in stratum pyramidale and stratum radiatum, which is in line with the studies performed in the human entorhinal cortex (Scheff et al., 1993) and in the human transentorhinal cortex (Domínguez-Álvaro et al., 2018). However, in the present study, our light microscopy studies showed a lower surface area of the hippocampus and a thinner CA1 in the Alzheimer’s disease cases. As a result, our findings indicate a reduction in the absolute number of synapses occurring in Alzheimer’s disease.
Nevertheless, a loss of synapses per volume unit in the human brain of individuals suffering from Alzheimer’s disease has been described at the light microscopy level by using immunocytochemistry for synaptic markers, with the hippocampus being one of the most severely affected areas (Arendt, 2009). Previous EM ultrastructural studies have also revealed (i) a decrease in synaptic density in numerous cortical regions, including the dentate gyrus and some frontal, parietal, temporal and cingulate cortical areas (Scheff et al., 1990, 1996; Scheff and Price, 1993, 1998, 2001, 2003, 2006); and (ii) a decrease in the total number of synapses—accompanied by brain atrophy—in CA1 stratum radiatum, the dentate gyrus and some cingulate and temporal cortices (Scheff et al., 2006, 2007, 2011, 2015).
However, the EM quantifications performed in the above-mentioned studies were carried out using TEM in single ultrathin sections to infer 3D characteristics from 2D images with stereological methods, and the data obtained with these methods may give rise to different results from the ones obtained in the present study with FIB/SEM because of methodological differences (Merchán-Pérez et al., 2009). In addition, in the previous TEM studies, they did not distinguish between asymmetric and symmetric synapses, whereas with FIB/SEM a more accurate study of synaptic organization is possible, since synapses can be unambiguously classified into asymmetric and symmetric according to their morphology and a much greater number of synapses can be analysed (Merchán-Pérez et al., 2009; Blazquez-Llorca et al., 2013). In any case, it would therefore appear that (i) a decrease in the number of synapses occurs in Alzheimer’s disease cases, regardless of whether or not there is a decrease in the density of synapses per unit volume; and (ii) there is no significant change in the proportion of asymmetric and symmetric synapses.
Finally, synapses in the neuropil of CA1 of both control (Montero-Crespo et al., 2020) and Alzheimer’s disease cases followed a random spatial distribution, as has been observed previously in the somatosensory cortex of normal rats; the molecular layer of dentate gyrus of APP/PS1 transgenic mice; and the frontal cortex of Alzheimer’s disease and the transentorhinal cortex of both control and Alzheimer’s disease cases (Alonso-Nanclares et al., 2013; Blazquez-Llorca et al., 2013; Merchán-Pérez et al., 2014; Domínguez-Álvaro et al., 2018, 2019). Thus, it would seem that randomly distributed synapses are a widespread ‘rule’ of the neuropil of the cerebral cortex that it is not affected by Alzheimer’s disease.
Postsynaptic targets
We observed a different distribution of postsynaptic targets in Alzheimer’s disease cases, but these differences varied according to the layers. Specifically, we found a lower proportion of axospinous asymmetric synapses and a higher proportion of axodendritic asymmetric synapses in stratum pyramidale and a lower proportion of axodendritic symmetric synapses in stratum radiatum. Dendritic spines are the main postsynaptic targets of excitatory synapses in the cerebral cortex (DeFelipe, 2015). Synapses and dendritic spines are dynamic structures whose plasticity is thought to underlie learning and memory (Hofer and Bonhoeffer, 2010; Yuste, 2010; Yu and Lu, 2012). Although we observed only a 4% decrease in the number of axospinous asymmetric synapses in Alzheimer’s disease, this might be related to the cognitive alterations in these cases, considering that the loss of synapses should be much larger due to the atrophy of CA1. Interestingly, this change seems to be layer dependent since it was observed in stratum pyramidale but not in stratum radiatum. A previous study from our laboratory also detected a lower percentage of synapses targeting spine heads in layer II of the transentorhinal cortex, the percentage was ∼9% lower in Alzheimer’s disease cases (Domínguez-Álvaro et al., 2019). We could not compare our findings directly with those of other previous studies since our work is the first study regarding axospinous asymmetric synapses abnormalities in the hippocampus of Alzheimer’s disease cases. Nevertheless, dendritic spine alterations have been described in a previous study from our laboratory in Alzheimer’s disease cases (Merino-Serrais et al., 2013). In this 2013 study, we observed—in the hippocampal formation of Alzheimer’s disease cases—that the diffuse accumulation of phospho-tau in a putative pre-tangle state does not induce changes in the dendritic spines of pyramidal neurons. By contrast, the presence of tau aggregates forming intraneuronal NFTs (immunoreactive for PHF-Tau-AT8 and PHF-Tau-PHF1) is associated with a progressive loss of dendritic spines and changes in their morphology, depending on the degree of tangle development (Merino-Serrais et al., 2013). Therefore, it is not only the loss of dendritic spines that should be considered an anatomical basis for cognitive deterioration, but also a change in their morphology, which has important functional consequences. Nevertheless, there is a growing body of evidence from animal models of tauopathy as well as in vitro studies suggesting that soluble oligomeric species of phospho-tau, rather than insoluble aggregates, are more detrimental to proper neural function (Dorostkar et al., 2015; Gerson et al., 2016; Krüger and Mandelkow, 2016), leading to cognitive decline due to synaptic dysfunction at lower concentrations and neuronal death at higher concentrations (Alonso and Cohen, 2018). Since the antibodies used for the immunostaining of abnormally phosphorylated tau (anti-PHF-Tau-AT8 and anti-PHF-Tau-PHF1; see Supplementary material) recognize both soluble and fibrillar isoforms, whether these different species of phospho-tau exert different neuropathological effects in the brain of Alzheimer’s disease patients still remains to be elucidated.
Synaptic shape and size
A lower proportion of perforated asymmetric synapses in Alzheimer’s disease cases was observed in stratum pyramidale. Perforated synapses are larger than macular synapses. This lower proportion of perforated synapses may indicate a smaller synaptic surface area in particular synapses. Taking together both the synaptic shape and size results (i.e. lower proportions of large macular axospinous asymmetric synapses), it seems that there is a reduction in the synaptic surface in Alzheimer’s disease. In contrast with our results, previous studies have reported an increment in synaptic apposition length in different brain regions in animal models of Alzheimer’s disease (Hillman and Chen, 1984; Cambon et al., 2000) and humans (Davies et al., 1987; Adams, 1987a, b; Bertoni-Freddari et al., 1990, 1988; Scheff et al., 1990, 1996; Scheff and Price, 1993, 1998, 2001; Neuman et al., 2015). These authors speculate the enlargement of synaptic size to represent an attempt to increase the active zone in order to enhance the weakened synaptic signal caused by the loss of synapses, constituting a morphological compensatory mechanism (Scheff and Price, 2003). However, we did not find evidence of this adaptive process, but rather a decrease in the frequency of the largest synapses. Importantly, our method in which we quantified the SAS—rather than only the synaptic apposition length—presents clear advantages (Morales et al., 2013). Briefly, the SAS is a 3D object extracted automatically that reproduces the shape and curvature of the PSD, avoiding any manual tracing and associated biases. In this regard, a previous study using SAS measurements failed to report any synaptic size differences in the human transentorhinal cortex of Alzheimer’s disease cases (Domínguez-Álvaro et al., 2018). However, taking into account that dendritic spine size correlates with synaptic size (Harris and Stevens, 1989; Knott et al., 2006; Arellano et al., 2007; Bosch et al., 2015), previous studies in plaque-free regions of the hippocampus and the amygdala of transgenic mice revealed a reduction in the proportion of larger spines (Knafo et al., 2009a, b; Merino-Serrais et al., 2011), in accordance with our results. Similarly, the presence of tau aggregates forming intraneuronal NFTs was associated with a progressive decrease in the proportion of larger spines, depending on the degree of tangle development (Merino-Serrais et al., 2013). Furthermore, the size of asymmetric synapses (PSD length) was observed to be shorter in the neuropil of layer 2/3 of the frontal cortex of a mouse model of tauopathy (Crimins et al., 2011), consistent with our present findings in the human hippocampus.
Synaptic size has been directly related to synaptic function. The shape and size of the synaptic junctions are strongly correlated with release probability, synaptic strength, efficacy and plasticity (Ganeshina et al., 2004a, b; Tarusawa et al., 2009; Holderith et al., 2012; Südhof, 2012; Biederer et al., 2017; Wegner et al., 2018). In this regard, the size of synapses has been associated with different functional attributes. For example, it has been proposed that small dendritic spines (with small synapses) are preferential sites for long-term potentiation induction, while large dendritic spines (with large synapses) may represent physical long-term memory storage locations (Fauth and Telzlaff, 2016; Lisman, 2017). Thus, differences in size might imply different ways of integrating information. In this regard, the presence of a lower proportion of large synapses in Alzheimer’s disease cases could indicate an impairment of synaptic functioning, which may not be able to strengthen in response to activity, leading to learning and memory retaining difficulties, which are major symptoms in Alzheimer’s disease cases.
Synaptic alterations and differences between layers: pathology and connectivity
The CA1 field of the human brain is one of the hippocampal fields that is most damaged by amyloid and tau pathologies. As mentioned previously, recent evidence from our group indicates a greater number of plaques and PHF-Tau immunoreactive neurons in the CA1 field when compared to other hippocampal areas (CA3, dentate gyrus or subiculum). Specifically, the medial portion of CA1 was the most affected area, with most plaques found in stratum pyramidale, followed by stratum radiatum (Furcila et al., 2018, 2019). There are numerous studies providing a wealth of evidence for amyloid-β peptides and abnormally phosphorylated tau proteins generating toxic effects under pathological conditions, leading to synaptic loss and neurotransmitter release dysfunction (Gylys et al., 2004; Lacor et al., 2007; Merino-Serrais et al., 2011, 2013; Wilcox et al., 2011; Spires-Jones and Hyman, 2014; Dorostkar et al., 2015; Henstridge et al., 2016; Rajmohan and Reddy, 2017; Zhou et al., 2017). For instance, the presence of intracellular well-developed NFTs in human CA1 pyramidal neurons causes profound alterations in the whole dendritic arbor of the affected neurons (Merino-Serrais et al., 2013), while it has been proposed that plaques trigger local alterations in the neuronal structures located in their proximity (Adalbert et al., 2009; García-Marin et al., 2009; Blazquez-Llorca et al., 2013; Dorostkar et al., 2015). However, these local alterations can have further consequences depending on the neuronal structures affected. For example, axonal alterations—such as axonal degeneration and truncation (Fiala et al., 2007; Blazquez-Llorca et al., 2017)—have also been described near plaques. Thus, connections from these axons might be impaired downstream from these local points. Moreover, different forms of non-fibrillary tau and amyloid-β peptides could cause further synaptic alterations (Forner et al., 2017; Chen et al., 2019). The variable degree of pathological changes between layers could be underlying the differences observed in synaptic alterations between stratum pyramidale and stratum radiatum.
See Supplementary material for further discussion on the significance of CA1 differences.
Individual differences: synaptic alterations
Several differences were observed between cases [both in control (Montero-Crespo et al., 2020) and Alzheimer’s disease cases] regarding many of the examined parameters. This interindividual variability could be a consequence of the degree of Alzheimer’s disease pathology. Indeed, we observed an inverse correlation between the synaptic density in stratum pyramidale and the degree of amyloid and tau pathology. Synapse loss has been observed to correlate closely with cognitive performance in Alzheimer’s disease, while the association with the degree of amyloid and tau pathology remains controversial (DeKosky and Scheff, 1990; Terry et al., 1991; Sze et al., 1997; Scheff and Price, 2003; Nelson et al., 2012; Spires-Jones and Hyman, 2014). However, other variables, such as sex and age, could also explain some of the variability, as previously observed in the microanatomy of the human cerebral cortex (Leuba and Kraftsik, 1994; Jacobs et al., 1997; Pakkenberg and Gundersen, 1997; Alonso-Nanclares et al., 2008). We did not find an effect of sex in our study (again this observation should be considered with caution given the small sample size); regarding age, we observed that older ages are associated with a higher degree of tau and amyloid pathology and lower synaptic density in stratum pyramidale. However, control cases were on average younger (50.4 years old) than Alzheimer’s disease cases (81.6 years old) and it remains uncertain whether some of the synaptic alterations observed in the present work were due to normal ageing or due to the pathology per se. While some interindividual differences could be observed between both control and Alzheimer’s disease cases (see Supplementary material for interindividual variability), the Alzheimer’s disease case with the most advanced neuropathological state (Case VK16; Supplementary Table 1) suffered the most severe alterations, even when compared with all of the other Alzheimer’s disease cases. Interestingly, the volume fraction occupied by neuronal somata in Case VK16 was more than 70% lower compared to control cases and around 60% lower compared to the rest of the Alzheimer’s disease cases; while the synaptic density was more than 90% lower in Case VK16 compared to both control and Alzheimer’s disease cases in stratum pyramidale and stratum radiatum. Hence, it could be hypothesized that progressive subcellular deterioration may account for synaptic alterations and may precede synaptic and neuronal loss, mainly affecting pyramidal neurons in the CA1 field, which highlights the selective nature of the neuronal loss. Moreover, in our study we observed cortical atrophy occurring in the hippocampus of Alzheimer’s disease cases. While care should be taken interpreting these differences, a reduction in the total number of synapses (but not the synaptic density) may be occurring in the Alzheimer’s disease brain even at early stages of the disease, with a much more accentuated reduction in cases with late stages.
Acknowledgements
We would like to thank Emilio González-Arnay for his help with the neuropathological diagnosis of some of the Alzheimer’s disease cases; Carmen Álvarez, Miriam Martín and Lorena Valdés for their helpful technical assistance; Nick Guthrie for his excellent text editing; and Ricardo Insausti for his helpful assistance with anatomical delimitation.
Funding
This study was funded by grants from the Spanish “Ministerio de Ciencia e Innovación” (grant PGC2018-094307-B-I00), Centro de Investigación Biomédica en Red sobre Enfermedades Neurodegenerativas (CIBERNED, Spain, CB06/05/0066), the Alzheimer’s Association (ZEN-15-321663) and the Universidad Nacional de Educación a Distancia (UNED, Spain, Plan de Promoción de la Investigación, 2014-040-UNED-POST). M.M-C. was awarded a research fellowship from the Spanish “Ministerio de Educación, Cultura y Deporte” (contract FPU14/02245).
Competing interests
The authors declare no competing interests.
Supplementary material
Supplementary material is available at Brain online.
References
Alzheimer’s Association.
- CA
cornu ammonis
- FIB/SEM
focused ion beam/scanning electron microscopy
- PSD
postsynaptic density
- SAS
synaptic apposition surface
- TEM
transmission electron microscopy

