


Abstract
Structural neuroimaging studies of individuals with chronic pain conditions have often observed decreased regional grey matter at a phenotypic level. However, it is not known if this association can be attributed to genetic factors.
Here we employed a novel integrative data-driven and hypothesis-testing approach to determine whether there is a genetic basis to grey matter morphology differences in chronic pain. Using publicly available genome-wide association study summary statistics for regional chronic pain conditions (n = 196 963) and structural neuroimaging measures (n = 19 629–34 000), we applied bivariate linkage disequilibrium-score regression and latent causal variable analyses to determine the genetic correlations (rG) and genetic causal proportion (GCP) between these complex traits, respectively. Five a priori brain regions (i.e. prefrontal cortex, cingulate cortex, insula, thalamus and superior temporal gyrus) were selected based on systematic reviews of grey matter morphology studies in chronic pain.
Across this evidence-based selection of five brain regions, 10 significant negative genetic correlations (out of 369) were found (false discovery rate < 5%), suggesting a shared genetic basis to both reduced regional grey matter morphology and the presence of chronic pain. Specifically, negative genetic correlations were observed between reduced insula grey matter morphology and chronic pain in the abdomen (mean insula cortical thickness), hips (left insula volume) and neck/shoulders (left and right insula volume). Similarly, a shared genetic basis was found for reduced posterior cingulate cortex volume in chronic pain of the hip (left and right posterior cingulate), neck/shoulder (left posterior cingulate) and chronic pain at any site (left posterior cingulate); and for reduced pars triangularis volume in chronic neck/shoulder (left pars triangularis) and widespread pain (right pars triangularis). Across these negative genetic correlations, a significant genetic causal proportion was only found between mean insula thickness and chronic abdominal pain [rG (standard error, SE) = −0.25 (0.08), P = 1.06 × 10⁻³; GCP (SE) = −0.69 (0.20), P = 4.96 × 10⁻⁴]. This finding suggests that the genes underlying reduced cortical thickness of the insula causally contribute to an increased risk of chronic abdominal pain.
Altogether, these results provide independent corroborating evidence for observational reports of decreased grey matter of particular brain regions in chronic pain. Further, we show for the first time that this association is mediated (in part) by genetic factors. These novel findings warrant further investigation into the neurogenetic pathways that underlie the development and prolongation of chronic pain conditions.
Introduction
Chronic pain is a leading cause of disability worldwide.1,2 To optimize clinical management, further advancements in delineating its fundamental mechanisms are critically needed.3-7 Towards this end, large-scale international collaborations comprising clinical, neuroimaging and genetic data are increasingly being leveraged to interrogate the complex and heterogeneous pathophysiology underlying chronic pain. Notably, these large-scale datasets are sufficiently powered for genome-wide association studies (GWAS) to elucidate biological mechanisms that contribute to chronic pain phenotypes.8–19
Previous GWAS of chronic pain conditions suggest brain and CNS pathophysiological involvement at both cellular pathway and tissue levels. For example, neurogenesis and synaptic plasticity have been implicated in pathway and gene-level association analyses from GWAS data in chronic low back pain16 and widespread pain.17 Furthermore, in chronic low back pain,15,16 widespread pain17–19 and neck/shoulder pain,8 tissue-level analyses reveal enrichment of brain-expressed genes, particularly in the cerebral cortex, cerebellum and basal ganglia. Taken together, these data demonstrate a genetic basis for nervous system mechanisms that may contribute to presence of chronic pain. These data are complemented by studies employing neuroimaging modalities—such as structural MRI, functional MRI and diffusion tensor imaging (DTI)—as potential biomarkers to provide insights into the aetiopathogenesis of chronic pain (reviewed in Tracey et al.20 and van der Miesen et al.21) and inform clinical decision-making.22,23 For instance, structural MRI measures of grey matter morphology have revealed that a range of morphological differences in cortical and subcortical structures (e.g. thalamus, prefrontal and cingulate cortex) are associated with chronic pain conditions24–29 such as low back pain30–32 and fibromyalgia.33–36 These morphological findings appear to have clinical relevance in chronic pain based on the following: (i) certain reductions in grey matter morphology are associated with clinical outcomes (e.g. pain intensity and pressure pain threshold37); (ii) longitudinal data suggest grey matter morphological reductions occur in the transition from acute to chronic pain38; and (iii) increases in regional grey matter morphology following treatment are associated with improvements in clinical outcomes.39–43 These neuroimaging data suggest that brain grey matter morphological alterations may be involved in the development and/or maintenance of ongoing pain and disability in chronic pain conditions.
In psychiatric and neurological conditions, genetics research has been applied to neuroimaging traits via large-scale collaborations such as the Enhancing NeuroImaging Genetics through Meta-Analysis (ENIGMA) Consortium. These studies have delivered novel insights into the heritability, genetic architecture and functional implications of neuroimaging traits including associations with disease-related genetic variants.44 Notably, genetic variants underlying brain morphology are associated with a risk of psychiatric diagnoses/traits44 such as depression,45 anxiety disorders,46 post-traumatic stress disorder,46 anhedonia47 and neuroticism.45 However, the genetic factors underlying neuroimaging traits in chronic pain conditions remain largely unknown.
It is not clear to what extent the associations between neuroimaging traits—such as reductions in regional grey matter morphology—and chronic pain may be explained by genetic factors. Should such associations be attributable to shared genetics, it is not known whether grey matter morphology and chronic pain are independently affected by the same set of genetic variants (i.e. horizontal pleiotropy) or by causal mechanistic pathways (i.e. vertical pleiotropy—the effect of a genetic variant on one trait leads to an effect on another trait via a biological pathway).48 Associations due to causal mechanistic pathways could represent future targets for clinical assessment and intervention.
To elucidate whether previously observed associations between chronic pain and grey matter morphology can be explained through shared genetics, we performed the first investigation of genetic correlations (rG) between chronic pain and neuroimaging traits at five a priori selected brain regions (i.e. prefrontal cortex, cingulate cortex, insula, thalamus and superior temporal gyrus) based on previous phenotypic studies. We then examined whether any observed significant genetic correlations likely represent horizontal or vertical pleiotropic associations to identify causal relationships between these traits.
Materials and methods
Discovery GWAS dataset for chronic pain
We carried out a GWAS of chronic pain using data from UK Biobank. Chronic pain was defined with a minimal phenotyping approach using responses to the questions: ‘Have you had back pains for more than 3 months?’, ‘Have you had hip pains for more than 3 months?’, ‘Have you had knee pains for more than 3 months?’, ‘Have you had neck or shoulder pains for more than 3 months?’, ‘Have you had abdominal pains for more than 3 months?’, ‘Have you had facial pains for more than 3 months?’, ‘Have you had headaches for more than 3 months?’, ‘Have you had pains all over the body for more than 3 months?’ (Questionnaire field ID: 6159). Each of these questions could be answered with ‘Yes’, ‘No’, ‘Don’t know’, or ‘Prefer not to answer’. Individuals who selected ‘Yes’ to one of these questions were defined as cases for the specific phenotype (e.g. individuals who replied yes to ‘Have you had facial pains for more than 3 months’ were defined as cases for the ‘Facial chronic pain’ phenotype). Chronic pain at any site was defined as all the individuals who replied ‘Yes’ to at least one of these questions. Chronic widespread pain was defined as answering ‘Yes’ to ‘Have you had pains all over the body for more than 3 months?’. This approach to defining the chronic pain phenotypes provides: (i) one broad all-encompassing phenotype of chronic pain at any site; and (ii) eight regional chronic pain sub-phenotypes (i.e. back, neck/shoulder, hip, knee, abdominal, facial, headache and widespread pain). Controls were defined as individuals who reported not having experienced any pain for more than 3 months. Table 1 summarizes the sample sizes included in each of the GWAS.
Distribution of chronic pain across sites, gender and prevalence
| Chronic pain site | Males | Females | Total | Prevalence in cohort |
|---|---|---|---|---|
| Any site | 84 960 | 112 003 | 196 963 | 45.8% |
| Widespread | 2244 | 3819 | 6063 | 1.3% |
| Back | 35 693 | 43 396 | 79 089 | 17.9% |
| Face | 1101 | 2936 | 4037 | 0.9% |
| Headache | 11 560 | 27 723 | 39 283 | 8.9% |
| Hip | 15 345 | 26 332 | 41 677 | 9.4% |
| Knee | 36 565 | 41 431 | 77 996 | 17.6% |
| Neck or shoulder | 29 742 | 42 474 | 72 216 | 16.3% |
| Abdominal | 8118 | 13 167 | 21 285 | 4.8% |
| None | 115 204 | 123 921 | 239 125 | 54.2% |
Association testing between each of the chronic pain phenotypes and genetic variants was conducted using REGENIE (v1.0.6.2)—a machine learning-based GWAS method that implements a logistic mixed model, whereby the genetic relationship between individuals is modelled as a random effect to account for cryptic relatedness. Sex, age, genotyping array and the top 10 principal components derived from genetic data were used as covariates for the association analysis. Quality control procedures included exclusion of variants with minor allele frequency <0.005, imputation quality <0.6 and those deviating from Hardy–Weinberg equilibrium (P-value <1 × 10⁻⁵). After quality control exclusions, a total of 11 172 285 single nucleotide polymorphisms (SNPs) remained in the analysis. Subject data were excluded if their genotype-derived principal components 1 and 2 were further than 6 standard deviations away from those of 1000 Genomes European population. After quality control, a total of up to 441 088 individuals remained in the GWAS. Informed consent was provided by all participants. This research was conducted using data from the UK Biobank resource (application number 25331) and was approved by the UK Biobank’s governing Research Ethics Committee.
Selecting brain regions of interest
A PubMed literature search was undertaken to identify systematic reviews that compared grey matter morphology measures between participants with chronic pain conditions and controls. The search terms used pertained to chronic pain, brain MRI, grey matter volume (GMV) and cortical thickness. Chronic pain was defined as >3 months’ duration49,50 and chronic pain at any site was eligible for consideration. Assessment of grey matter morphology by brain MRI using voxel-based morphometry, cortical thickness or regional brain volumes was considered. The search engine filter function was used to return reviews, systematic reviews or meta-analyses only, which yielded 14 applicable systematic reviews.25–33,35,51–54 Their cited reference lists were examined for additional applicable and related papers to complement the database search, yielding a further two systematic reviews.34,36 The main findings of each systematic review were summarized and the brain regions with the strongest evidence of altered grey matter morphology were selected for inclusion (i.e. considering frequency and consistency of findings and meta-analytical versus qualitative synthesis).
Supplementary Table 1 summarizes the systematic reviews on various chronic pain conditions most frequently reported to have decreased regional GMV, cortical thickness or brain volume (as applicable to measurement method) at the prefrontal cortex,25–33,35,36,51,52,54 cingulate cortex,25,26,28,29,31–36,51–54 insula,25,27–33,52–54 and thalamus.27–29,31,33,52 Reduced GMV was consistently reported at the superior temporal gyrus in four studies (including two meta-analyses).25,29,51,52 Other brain regions less consistently demonstrated differences in regional grey matter morphology (e.g. cerebellum,25,26,28,30,33,36,52,53 somatosensory27,28,30,31,51–54 and primary motor26,28–31,52,53 cortices), while total GMV differences were also inconsistently reported.30,31,33,53 Prefrontal cortex, cingulate cortex, insula, thalamus and superior temporal gyrus were therefore selected a priori for investigating the genetic basis of regional grey matter morphology in chronic pain.
Selecting neuroimaging traits for genetic correlations analysis
These five brain regions (above) were then defined using Desikan-Killiany-Tourville labelling.55 The prefrontal cortex was defined based on Machts et al.56 to comprise the following: superior frontal gyrus, middle frontal gyrus (rostral), inferior frontal gyrus (pars opercularis, pars orbitalis, pars triangularis) and orbitofrontal cortex (lateral and medial) atlas regions. Cingulate cortex comprised anterior (rostral and caudal), isthmus and posterior cingulate atlas regions. Insula, thalamus and superior temporal gyrus are represented in their own atlas regions.
We obtained GWAS summary statistics for these brain atlas regions from previously published data (Table 2):
MRI measures of grey matter morphology in the selected brain regions for which genome-wide association study summary statistics were used
| Brain region | Corresponding Desikan-Killiany-Tourville atlas regions | Grey matter morphology measures |
|---|---|---|
| Prefrontal cortex | Superior frontal gyrus; middle frontal gyrus (rostral); inferior frontal gyrus (pars opercularis, pars orbitalisa, pars triangularis); orbitofrontal cortex (lateral and medial) | Volume left and right; mean cortical thickness |
| Cingulate cortex | Anterior cingulate (rostral and caudal); Isthmus; posterior cingulate | Volume left and right; mean cortical thickness |
| Insula | Insula | Volume left and right; mean cortical thickness |
| Thalamus | Thalamus | Volume left and right; mean volume |
| Superior temporal gyrus | Superior temporal gyrus | Volume left and right; mean cortical thickness |
Genetic correlation for mean pars orbitalis cortical thickness could not be calculated due to an underpowered GWAS.
Region of interest volumes for cortical and subcortical areas (left- and right-sided data) were used from Zhao et al.57 These data represented left- and right-sided measures at 14 regions of interest (i.e. 28 in total): superior frontal gyrus, middle frontal gyrus (rostral), inferior frontal gyrus (pars opercularis, pars orbitalis, pars triangularis), orbitofrontal cortex (lateral and medial), superior temporal gyrus, anterior (rostral and caudal), isthmus and posterior cingulate regions, insula and thalamus.
Cortical thickness and subcortical (thalamus) regional brain volume mean data (i.e. average of left and right hemispheres) were used from Grasby et al.45 and Satizabal et al.,58 respectively. Estimation of genetic correlation for mean pars orbitalis cortical thickness could not be done due to reduced statistical power for bivariate linkage disequilibrium score regression. Thus, 13 measures were included for mean cortical thickness or subcortical (thalamus) regional brain volume: superior frontal gyrus, middle frontal gyrus (rostral), inferior frontal gyrus (pars opercularis, pars triangularis), orbitofrontal cortex (lateral and medial), superior temporal gyrus, anterior (rostral and caudal), isthmus and posterior cingulate regions, insula and thalamus.
Image acquisition, processing and normalization methods for the MRI measures are described in their respective publications. The sample sizes and reference for each of the GWAS encompassing these neuroimaging traits are described in Supplementary Table 2.
Genetic correlation analyses
Genetic correlation between each of the neuroimaging phenotypes (i.e. 28 GMV region of interest and 13 cortical thickness/subcortical volume traits) and pain phenotypes were estimated using cross-trait bivariate linkage disequilibrium score regression59 implemented in the Complex Traits Genetics Virtual Lab (CTG-VL; http://genoma.io).60 A genetic correlation summarizes the genetic concordance between a pair of traits across the whole genome; genetic correlation values range from −1 to 1. Genetic correlation values approaching 1 or −1 indicate a proportion of genetic variants having concordant or divergent effects on both traits (respectively), whereas genetic correlation values approaching 0 indicate little genetic concordance or largely independent genetic predictors between traits. Multiple testing was accounted for by applying a Benjamini-Hochberg false discovery rate (FDR < 5%) across genetic correlations between neuroimaging traits per each of the body-site-specific GWAS of chronic pain.
Latent causal variable analyses
For the trait pairs with evidence of non-zero genetic correlation, latent causal variable (LCV)61 analysis was used to investigate whether the observed genetic correlation may reflect a causal relationship or horizontal pleiotropy (i.e. the genetic variants that affect chronic pain also affect neuroimaging traits, independently) by estimating the genetic causal proportion (GCP) on the traits displaying genetic correlations at FDR < 5%. LCV is robust to horizontal pleiotropy, which is ubiquitous in complex traits. LCV model assumes a latent ‘causal’ variable that mediates the genetic correlation of two traits. Using mixed fourth moments of bivariate effect size distribution of all SNPs in both GWAS, LCV estimates the posterior mean for GCP that indicates the degree to which one trait is correlated with the latent ‘causal’ variable. GCP values range from −1 to 1; high positive values indicate greater partial genetic causality for one trait (e.g. chronic pain phenotypes) on another trait (e.g. neuroimaging phenotypes) while high negative values indicate greater partial genetic causality for neuroimaging phenotypes on pain phenotypes.
Data availability
Neuroimaging GWAS summary statistics are publicly available (Supplementary Table 2). Full GWAS summary statistics for the chronic pain phenotypes reported in the current study (Table 1) are available at https://view.genoma.io.
Results
Genetic correlations and genetic causal proportions between chronic pain and neuroimaging traits
Bivariate linkage disequilibrium score analyses between chronic pain and the 28 GMV region of interest traits and 13 thickness/subcortical volume traits revealed 10 genetic correlations with chronic pain at FDR < 5% (Fig. 1, Table 3 and Supplementary Table 3). These statistically significant genetic correlations were all negative (rG range −0.15 to −0.39), indicating that genetic variants associated with reduced GMV or cortical thickness in six particular brain regions are also associated with increased risks of the applicable chronic pain phenotypes. Specifically, negative genetic correlations were identified between: (i) reduced grey matter at the insula and chronic hip (left insula GMV), neck/shoulder (left and right insula GMV) and abdominal pain (mean insula cortical thickness); (ii) reduced GMV at the posterior cingulate cortex (PCC) and chronic hip pain (left and right PCC GMV), neck/shoulder pain (left PCC GMV) and pain at any site (left PCC GMV); (iii) reduced GMV at pars triangularis—part of the prefrontal cortex—and chronic neck/shoulder (left pars triangularis GMV) and widespread pain (right pars triangularis GMV). The strongest evidence of negative genetic correlation was observed between hip pain and left PCC GMV [rG (standard error, SE) = −0.25 (0.07), P = 2.08 × 10⁻⁴] (Fig. 1 and Table 3). Data for all genetic correlations are reported in Supplementary Table 3.
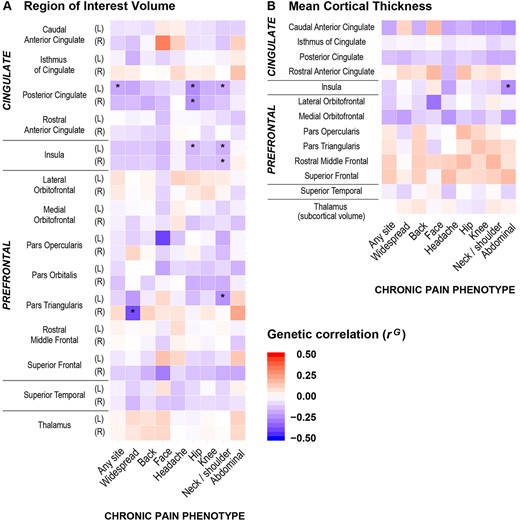
Heat maps for genetic correlations (rG) between the nine chronic pain phenotypes and neuroimaging traits. (A) Region of interest volume, and (B) mean cortical thickness (or subcortical volume as applicable) for cingulate cortex, insula, prefrontal cortex, superior temporal gyrus and thalamus. Asterisk denotes significant rG at 5% FDR. Direction of correlation is shown by heat map colours (i.e. red denotes positive rG and blue denotes negative rG), with darker shading indicating stronger genetic associations. Significant negative genetic correlations were observed at the insula, posterior cingulate cortex and pars triangularis between neuroimaging traits and a number of chronic pain phenotypes (i.e. chronic hip, neck/shoulder, abdominal, widespread pain and pain at any site). L = left; R = right.
Grey matter morphology traits genetically correlated with chronic pain phenotypes
| Chronic pain phenotype | Brain region | MRI trait | rG (SE) | GCP (SE) |
|---|---|---|---|---|
| P-value | P-value | |||
| Hip pain | Left posterior cingulate | GMV | −0.25 (0.07) | 0.22 (0.48) |
| 2.08 × 10⁻⁴ | 0.64 | |||
| Right posterior cingulate | GMV | −0.24 (0.07) | 0.43 (0.35) | |
| 3.19 × 10⁻⁴ | 0.21 | |||
| Left insula | GMV | −0.16 (0.06) | 0.41 (0.37) | |
| 4.17 × 10⁻³ | 0.27 | |||
| Neck/shoulder pain | Left insula | GMV | −0.17 (0.05) | −0.01 (0.30) |
| 6.43 × 10⁻⁴ | 0.96 | |||
| Right insula | GMV | −0.15 (0.05) | −0.07 (0.45) | |
| 1.41 × 10⁻³ | 0.88 | |||
| Left posterior cingulate | GMV | −0.17 (0.06) | 0.00 (0.42) | |
| 2.09 × 10⁻³ | >0.99 | |||
| Left pars triangularis | GMV | −0.24 (0.08) | 0.05 (0.37) | |
| 3.50 × 10⁻³ | 0.90 | |||
| Abdominal pain | Mean insula (left and right) | Cortical thickness | −0.25 (0.08) | −0.69 (0.20) |
| 1.06 × 10⁻³ | 4.96 × 10⁻⁴ | |||
| Widespread pain | Right pars triangularis | GMV | −0.39 (0.12) | −0.08 (0.21) |
| 1.57 × 10⁻³ | 0.72 | |||
| Pain at any site | Left posterior cingulate | GMV | −0.18 (0.05) | 0.01 (0.58) |
| 4.10 × 10⁻⁴ | 0.99 |
This table presents the grey matter traits where there was a significant genetic correlation (rG; FDR < 5%) with chronic pain. A negative genetic correlation (rG < 0) indicates the chronic pain condition is associated with lower values of the grey matter trait. A positive genetic correlation (rG > 0) indicates the chronic pain condition is associated with higher values of the grey matter trait. GCP indicates the likelihood of chronic pain affecting a trait (i.e. positive values up to 1) or the trait affecting chronic pain (i.e. negative values down to −1). GCP is significant (i.e. FDR < 5%) for mean insula cortical thickness in chronic abdominal pain, which suggests the genes underlying reduced insula cortical thickness causally contribute to an increased risk of chronic abdominal pain. For the other genetic correlations with non-significant GCP, reduced regional grey matter volume was associated with the chronic pain phenotypes but without evidence of a causal relationship between the traits. rG = genetic correlation.
Table 3 presents GCP statistics for each of the 10 neuroimaging trait pairs with evidence of non-zero genetic correlation. Significant genetic correlations [rG (SE) = −0.25 (0.08), P = 1.06 × 10⁻³] and significant genetic causal proportions [GCP (SE) = −0.69 (0.20), P = 4.96 × 10⁻⁴] were found for mean insula cortical thickness in chronic abdominal pain, which indicates that reduced mean insula cortical thickness increases the risk of chronic abdominal pain.
Discussion
We have demonstrated a shared genetic basis to associations between chronic pain phenotypes and reduced grey matter morphology in particular brain regions. Significant negative genetic correlations were observed between neuroimaging measures at the insula, PCC and pars triangularis and various chronic pain conditions including hip, neck/shoulder, abdominal, widespread pain and pain at any site. Among these, novel evidence of a causal relationship was found between reduced mean insula cortical thickness and chronic abdominal pain (i.e. vertical pleiotropy). For the other trait pairs with evidence of genetic correlation, LCV results suggest their genetic correlation may be explained by horizontal pleiotropy, whereby grey matter morphology and chronic pain are independently affected by a same set of genetic variants.62 More broadly, our study has advanced the field of pain neuroimaging and biomarker identification with the first comprehensive examination and demonstrated evidence for specific genetic associations between these traits.
Neuroimaging genetics studies have been applied for nearly a decade to a host of complex traits and disorders, notably in the fields of neurology and psychiatry by the ENIGMA Consortium.44,63 Large-scale collaborations such as ENIGMA enable meta-analyses incorporating a range of data, including multimodal MRI measures (anatomical, diffusion, functional) and genetic data, sufficiently powered for GWAS.44 Such work has delivered novel insights into the heritability, genetic architecture and functional implications of neuroimaging traits including associations with disease-related genetic variants (reviewed in Thompson et al.44). In the present study, we used previously published GWAS summary statistics for structural neuroimaging at the brain atlas regions of interest, derived from ENIGMA45,58 and UK Biobank data.57 These three studies45,57,58 did not investigate chronic pain in their analyses, so we leveraged their summary statistics to generate genetic correlations and genetic causal proportions for structural T1-weighted brain MRI versus chronic pain phenotypes. While no other study to date has applied this analytical approach to investigating neuroimaging genetics in chronic pain, it independently corroborates a range of observational findings from clinical neuroimaging studies (explained further below) thus providing support for our novel methodological approach.
Genetic associations between chronic pain conditions and neuroimaging traits are an emerging area of investigation. Sun et al.64 reported phenotypic and genetic correlations between chronic pain and sleep disturbance, while at a phenotypic level they found shared functional MRI functional connectivity in chronic pain and sleep disturbance involving the prefrontal cortex, temporal gyrus, pre- and postcentral gyri, anterior cingulate gyrus, hippocampus and fusiform gyrus. Interestingly, of these shared functional connections, the polygenic score for chronic pain was significantly associated with ‘right middle temporal gyrus—right hippocampus’ connectivity, representing a genetic link between chronic pain and a neuroimaging outcome. However it should be noted that the chronic pain phenotype definition used by Sun et al.64 was average pain intensity ≥6/10 on a numerical rating scale in the preceding 7 days, which differs considerably from the prevailing definition of >3 months49,50 used in the present study. Furthermore, while functional MRI has been widely employed in chronic pain research21,22 to elucidate both state and trait biomarkers, there are issues concerning the reproducibility of results with this modality that need to be resolved (e.g. reporting transparency and data accessibility).65 Nevertheless, our data complement the findings of Sun et al.64 by providing further genetic evidence linking chronic pain and neuroimaging traits.
Previous GWAS investigations of chronic pain phenotypes have implicated the brain and CNS at both cellular pathway and tissue levels. For instance, pathway and gene-level association analyses from GWAS data have implicated neurogenesis and synaptic plasticity in chronic low back pain16 and widespread pain.17 Further, tissue-level analyses have found enrichment of brain-expressed genes in chronic low back pain,15,16 widespread pain17–19 and neck/shoulder pain,8 particularly in the cerebral cortex, cerebellum and basal ganglia, and notably in the anterior cingulate8,17–19 and frontal8,19 cortices—regions investigated in the present study. Interestingly, our data demonstrate significant negative genetic correlations between pars triangularis volume in chronic widespread and neck/shoulder pain (Table 3), which is consistent with tissue-level expression analysis by Johnston et al.19 and Meng et al.8 indicating enrichment of genes expressed in frontal cortex in chronic widespread and neck/shoulder pain (respectively). While specific mechanisms leading to grey matter morphological decreases in chronic pain conditions remain an area of ongoing enquiry,66 together our results and others19 provide independent converging evidence for a genetic basis to frontal cortical regions in chronic pain processing pathways.
Regional grey matter morphological changes may have utility as a chronic pain biomarker by reflecting mechanistic pathways underlying the development and/or maintenance of ongoing pain and disability.23 This inference arises from associations between grey matter morphology and patient outcomes observed in clinical studies. For instance, in chronic musculoskeletal pain, reduced grey matter at the cingulate, prefrontal and insula cortices and superior temporal gyrus is associated with pain intensity and blunt pressure pain threshold.37 In low back pain, grey matter reductions in insula, primary motor and somatosensory cortices occur during the transition to chronicity.38 In post-traumatic headache following a whiplash injury, reduced GMV at anterior cingulate cortex and dorsolateral prefrontal cortex (DLPFC) was present when patients were symptomatic at 3 months post-injury; however, these GMVs normalized when symptoms had resolved 1 year post-injury.67 Furthermore, improvements in clinical outcomes (i.e. decreased pain) following successful treatment are accompanied by increased grey matter at: (i) DLPFC in low back pain39; (ii) DLPFC, thalamus, basal ganglia, amygdala, hippocampus in complex regional pain syndrome40; and (iii) DLPFC, anterior cingulate cortex, amygdala, insula, thalamus and brainstem in hip osteoarthritis.41–43 In the current study, our findings are consistent with previous clinical neuroimaging results as shown by the genetic correlations indicating chronic pain associations with decreased grey matter morphology in the insula,25,27–33,52–54 posterior cingulate31,35,36,51,53 and pars triangularis (prefrontal cortex).26,29
Chronic pain conditions are often comorbid with psychiatric conditions and psychological symptoms.68–81 Genetic associations between structural neuroimaging traits and psychiatric conditions or related psychological traits have been identified in prior investigations. Zhao et al.57 observed depressive symptoms to be negatively genetically correlated with total grey matter and right superior temporal gyrus volume, indicating genetic factors that contribute to smaller total grey matter and superior temporal gyrus volume were also associated with increased risk of depressive symptoms. In contrast, the same study57 reported that bipolar disorder was positively correlated with a number of regions of interest in the prefrontal cortex (left and right pars opercularis, right caudal middle frontal gyrus, left rostral middle frontal gyrus). We found no significant genetic correlations between neuroimaging traits at these brain regions and chronic pain phenotypes. Grasby et al.45 reported major depressive disorder, depressive symptoms, attention deficit hyperactivity disorder, neuroticism and insomnia to be negatively genetically correlated with total cortical surface area; however, no significant genetic correlations were identified in their data between cortical thickness (also investigated in the present study) and psychiatric conditions or psychological traits, in contrast to our data. Shared genetic factors appear to underlie increased anxiety risk and smaller amygdala volume, as well as increased risk of post-traumatic stress disorder and smaller putamen volume.46 Interestingly, these two brain regions are implicated in emotion-related aspects of pain processing in chronic pain conditions.82 However, due to inconsistent increases28,30 and reductions28,29,52 in grey matter measures at these regions in systematic reviews of clinical neuroimaging studies (Supplementary Table 1), the putamen and amygdala were not selected a priori for investigation in the present study. At a phenotypic level, the aforementioned psychiatric conditions and psychological traits are often comorbid with chronic pain conditions68–81 and GWAS have identified genetic overlap between chronic pain conditions and such factors (e.g. depression symptoms,8,15,17,83–86 depressive disorders,8,15,17,84,87–89 neuroticism,15,17,84 anxiety,85 post-traumatic stress disorder,17 sleep disturbance15). These shared genetic factors partly account for the comorbidity between chronic pain conditions and psychiatric conditions/psychological traits. However, with respect to structural neuroimaging traits, our findings indicate that genetic factors underpinning grey matter morphology in chronic pain phenotypes differ from comparable data in psychiatric conditions and psychological traits. Nevertheless, further large-scale studies are required to directly investigate this issue.
The insula cortex is a key region in pain processing, responsible for encoding pain intensity and cognitive control of pain.82 The present study’s finding of a causal relationship (i.e. significant GCP; Table 3) indicates genetic factors are partly responsible for reduced cortical thickness at the insula, which in turn contributes to an increased risk of chronic abdominal pain (i.e. vertical pleiotropy). Interestingly, the direction of this relationship is contrary to that inferred by longitudinal clinical phenotypic data: in people with hip osteoarthritis41–43 and chronic back pain,39 decreased grey matter morphology in the insula41,42 and other brain regions (i.e. thalamus, DLFPC, anterior cingulate, amygdala, brainstem, cerebellum39,41–43) subsequently increased following successful peripheral surgical39,41–43 or medical39 treatment, thus suggesting the prior reduced grey matter was secondary to the presence of chronic pain. However, it should be noted that these were musculoskeletal conditions rather than chronic abdominal pain (implicated in our data), which may reflect different pathophysiological mechanisms. It should also be noted that in our data, genetic correlations for left and right insula region of interest volumes and chronic abdominal pain were not significant [P = 0.75 and 0.50, respectively (Supplementary Table 3)], and nor were the GCP statistics for insula measures with significant genetic correlations in the other chronic pain phenotypes [P = 0.27–0.96 (Supplementary Table 3)]. Interestingly, Grasby et al.45 did not find significant genetic correlations between insula cortical thickness or surface area and psychiatric diagnoses/psychological traits, which suggests the present study’s significant GCP finding cannot be explained by such comorbid complex traits; however, further work is needed to specifically investigate this hypothesis. More broadly, it should be noted that given the highly polygenic architecture of structural neuroimaging traits45,57,58,90 and the likely small effects of individual variants, much larger sample sizes are needed to detect numerous weak causal variants.57 Thus, as publicly available datasets (e.g. ENIGMA, UK Biobank) continue to increase in sample size,91 more powerful analyses will enable further insights into the causal relationship between neuroimaging traits and chronic pain conditions.
Nine of the regional grey matter morphology traits and chronic pain conditions showed evidence of genetic correlation only (i.e. non-significant GCP). These results suggest a common set of genetic variants contribute to reduced regional grey matter and risk of chronic pain phenotypes via their own distinct pathways (horizontal pleiotropy). It should also be noted that most of the brain regions examined did not demonstrate significant genetic correlation after FDR, including those commonly implicated in systematic literature reviews [e.g. anterior cingulate cortex, DLPFC (i.e. rostral and caudal middle frontal cortex92)]. This finding implies that the grey matter decreases observed in clinical studies at regions with non-significant genetic correlation cannot be attributed to the average effect of pleiotropy (i.e. when a gene effects multiple phenotypic traits) across all applicable chromosomal locations. It should be noted, however, that: (i) the underlying architecture of genetic correlations at individual loci can vary, such that local genetic correlations can deviate from the genome-wide average62,93; (ii) in highly polygenic complex traits such as regional neuroimaging measures,45,57,58,90 individual effect sizes are typically small and larger sample sizes than presently available will allow detection of more subtle genetic correlations44,94,95; and (iii) while structural MRI is less susceptible to potential reproducibility issues than functional MRI,96,97 variation in MRI hardware and the influence of imaging artefacts must be considered as potential sources of variance in large-scale multisite neuroimaging studies94,98 (although this issue is somewhat mitigated in the ENIGMA data through standardized protocols for extraction of brain measures from raw imaging data,44 including structural MRI and standardized processing and analysis of functional MRI data99). Each of these factors may have impacted our capacity to detect significant genetic correlations, which in turn may have contributed to the non-significant genetic correlations at brain regions commonly implicated in the systematic review of clinical neuroimaging studies, such as the anterior cingulate cortex or DLPFC.
Strengths, limitations and further research
A major strength of the current study is its novel scientific methodology, which integrates: (i) a data-driven minimal phenotyping approach for GWAS of both broad and regional chronic pain conditions; (ii) leveraging large independent structural neuroimaging genetic datasets to select MRI phenotypes based on prior systematic reviews of grey matter morphology studies in chronic pain; and (iii) using these carefully selected a priori structural neuroimaging phenotypes for hypothesis-driven analyses with linkage disequilibrium-score regression and LCV to determine whether there are shared genetics between these complex traits. The LCV method61 was used over a more conventional approach such as Mendelian randomization as the chronic pain and neuroimaging GWAS were derived mainly from UK Biobank data and overlapping samples in Mendelian randomization analysis can bias the estimates towards the confounded associations.100 Furthermore, the LCV method leverages information from genome-wide genetic variants to assess the evidence for causality, whereas Mendelian randomization only uses genetic variants robustly associated with the trait (e.g. P < 5.00 × 10⁻⁸), thus precluding its application to most of the neuroimaging phenotypes in the current study. Finally, in defining the chronic pain phenotypes, we used one broad phenotype of chronic pain at any site and eight regional sub-phenotypes. The broad phenotype enabled maximal power for our GWAS of chronic pain at any site (n = 196 963 cases versus n = 239 125 controls), in keeping with growing evidence for genetic overlap across different chronic pain conditions.84,101–106 In contrast, the eight regional chronic pain sub-phenotypes were associated with a loss of power due to smaller sample sizes (n = 4037–79 089) but provided more detailed findings on the genetic correlations with brain morphology.
A limitation of the current study is that the LCV method cannot detect bidirectional relationships (i.e. chronic pain → brain volume and brain volume → chronic pain). This issue could explain, for example, the apparent disagreement between longitudinal clinical studies39,41–43 (suggesting regional grey matter decreases to be secondary to ongoing nociceptive input) and our LCV analysis (which implies that reduced insula cortical thickness affects chronic abdominal pain, not the other way around), as a bidirectional relationship could indeed still be present. Another limitation of this study is that the chronic pain GWAS did not discern the chronic pain conditions by their underlying diagnoses (e.g. musculoskeletal, rheumatological, oncological, neuropathic and other clinical factors underlying the pain reported by participants). This variation may have affected the current study’s capacity to detect more significant (true) genetic correlations.
Further neuroimaging genetics studies of chronic pain can investigate: (i) grey matter morphology across the entire brain; (ii) genetic associations with other brain-imaging modality measures such as functional MRI,107,108 DTI109–111 and EEG,112 which, respectively, examine functional (state) and structural connectivity and electrophysiological activity; (iii) chronic pain phenotypes at a finer diagnostic level (e.g. chronic whiplash-associated disorder, fibromyalgia) rather than a broad symptom description (e.g. chronic neck/shoulder pain, chronic widespread pain) in order to elucidate the genetic heterogeneity across chronic pain syndromes and (genetically) associated comorbid conditions8,15,17,84,86–89,113–125; (iv) genetic correlations between chronic pain and neuroimaging traits at individual loci (e.g. using LAVA126) as such genetic associations can exist and be statistically significant while genome-wide genetic correlations remain non-significant; and (v) the genetic architecture of chronic pain in large-scale longitudinal GWAS of non-European populations.
Conclusion
We have identified significant genetic correlations between grey matter morphology and chronic pain at a genome-wide level, indicating that genetic variants associated with decreased volume at specific brain regions are also associated with an increased risk of particular chronic pain conditions. These data independently corroborate the findings from previous clinical neuroimaging studies and provide the first evidence for a genetic basis to reported associations between chronic pain conditions and structural neuroimaging traits. This work provides the basis for further large-scale GWAS along with targeted pharmacogenomics trials, neuromodulation and animal model studies to drive advances in identifying objective neurogenetic markers of chronic pain and their clinical translation.
Acknowledgements
The authors thank Graham Galloway (National Imaging Facility, Brisbane, Australia) for initial feedback on the present study’s methodological approach. We also thank the anonymous reviewers for helpful comments on an earlier version of this manuscript.
Funding
A.I.C. is supported by a UQ Research Training Scholarship from The University of Queensland. P.F.K. is supported by an Australian Government Research Training Program Scholarship from Queensland University of Technology (QUT). M.E.R. thanks the support of a fellowship from Australia’s National Health and Medical Research Council (APP1102821). RECOVER Injury Research Centre (M.S., S.F.F.) receives unrestricted grant funding from the Motor Accident Insurance Commission (Queensland). This research was initially carried out at the Translational Research Institute (TRI), Woolloongabba, QLD 4102, Australia. TRI is supported by a grant from the Australian Government. The funders had no role in the design or interpretation of this study.
Competing interests
G.C.-P. contributed to this study while employed at The University of Queensland. He is now an employee of 23andMe, Inc. and he may hold stock or stock options from the company.
Supplementary material
Supplementary material is available at Brain online.
References
- DLPFC
dorsolateral prefrontal cortex
- ENIGMA
Enhancing NeuroImaging Genetics through Meta-Analysis Consortium
- GCP
genetic causal proportion
- GMV
grey matter volume
- GWAS
genome-wide association study
- LCV
latent causal variable
- PCC
posterior cingulate cortex
Author notes
Trung Thanh Ngo and Gabriel Cuéllar-Partida contributed equally to this work.
Present address: 23andMe, Inc., Sunnyvale, CA, USA

