


 https://orcid.org/0000-0003-1933-8098

Abstract
Evidence suggests exposure to particulate matter with aerodynamic diameter <2.5 μm (PM2.5) may increase the risk for Alzheimer’s disease and related dementias. Whether PM2.5 alters brain structure and accelerates the preclinical neuropsychological processes remains unknown. Early decline of episodic memory is detectable in preclinical Alzheimer’s disease. Therefore, we conducted a longitudinal study to examine whether PM2.5 affects the episodic memory decline, and also explored the potential mediating role of increased neuroanatomic risk of Alzheimer’s disease associated with exposure. Participants included older females (n = 998; aged 73–87) enrolled in both the Women’s Health Initiative Study of Cognitive Aging and the Women’s Health Initiative Memory Study of Magnetic Resonance Imaging, with annual (1999–2010) episodic memory assessment by the California Verbal Learning Test, including measures of immediate free recall/new learning (List A Trials 1–3; List B) and delayed free recall (short- and long-delay), and up to two brain scans (MRI-1: 2005–06; MRI-2: 2009–10). Subjects were assigned Alzheimer’s disease pattern similarity scores (a brain-MRI measured neuroanatomical risk for Alzheimer’s disease), developed by supervised machine learning and validated with data from the Alzheimer’s Disease Neuroimaging Initiative. Based on residential histories and environmental data on air monitoring and simulated atmospheric chemistry, we used a spatiotemporal model to estimate 3-year average PM2.5 exposure preceding MRI-1. In multilevel structural equation models, PM2.5 was associated with greater declines in immediate recall and new learning, but no association was found with decline in delayed-recall or composite scores. For each interquartile increment (2.81 μg/m3) of PM2.5, the annual decline rate was significantly accelerated by 19.3% [95% confidence interval (CI) = 1.9% to 36.2%] for Trials 1–3 and 14.8% (4.4% to 24.9%) for List B performance, adjusting for multiple potential confounders. Long-term PM2.5 exposure was associated with increased Alzheimer’s disease pattern similarity scores, which accounted for 22.6% (95% CI: 1% to 68.9%) and 10.7% (95% CI: 1.0% to 30.3%) of the total adverse PM2.5 effects on Trials 1–3 and List B, respectively. The observed associations remained after excluding incident cases of dementia and stroke during the follow-up, or further adjusting for small-vessel ischaemic disease volumes. Our findings illustrate the continuum of PM2.5 neurotoxicity that contributes to early decline of immediate free recall/new learning at the preclinical stage, which is mediated by progressive atrophy of grey matter indicative of increased Alzheimer’s disease risk, independent of cerebrovascular damage.
Introduction
Exposure to ambient air pollution represents a novel environmental risk factor of accelerated brain ageing (Underwood, 2017). In recent years, a growing number of epidemiological studies have shown that fine particulate matter with aerodynamic diameter <2.5 μm (PM2.5) may increase the risk of dementia, including Alzheimer’s disease (Jung et al., 2015; Cacciottolo et al., 2017; Chen et al., 2017; Carey et al., 2018; Oudin et al., 2018). Toxicopathological studies suggest air pollution accelerates amyloid-β accumulation in mice (Bhatt et al., 2015; Cacciottolo et al., 2017) and neurofibrillary tangles in canines (Calderón-Garcidueñas et al., 2003). Despite the increasing evidence supporting the neurological effects of PM2.5 on Alzheimer’s disease and related dementias, definitive conclusions on the causal association cannot be made because the underlying mechanisms remain unclear (The Lancet Neurology, 2018).
Declines in verbal episodic memory (e.g. the ability to remember details, with context, from daily and remote experiences) are the hallmark symptom of Alzheimer’s disease detectable in the preclinical stage (Gallagher and Koh, 2011). Episodic memory is composed of distinct cognitive processes such as encoding the target information (learning) and subsequently retrieving the target information, each involving complex neural systems (Dickerson and Eichenbaum, 2010). Several animal studies have demonstrated that inhaled PM2.5 exposures affect various neural systems thought to underlie these episodic memory processes (Fonken et al., 2011; Cheng et al., 2017; Ku et al., 2017; Liu et al., 2018). Few longitudinal epidemiological studies examined the association between PM2.5 and episodic memory (Weuve et al., 2012; Tonne et al., 2014; Wurth et al., 2018), and the majority of these studies used composite scores with mixed results. Importantly, no previous studies had directly linked air pollution exposures with cognitive decline and altered brain structure predictive of dementia risk. Therefore, we conducted a longitudinal study to examine the association between long-term exposure to PM2.5 and decline in episodic memory (immediate recall/new learning; delayed-recall), and to investigate the extent to which the putative adverse PM2.5 effects on declines were mediated by changes in neuroanatomic structure indicative of increased Alzheimer’s disease risk.
Materials and methods
Study design and population
We conducted a prospective cohort study that included community-dwelling females who were initially enrolled in the Women’s Health Initiative (WHI) Memory Study and subsequently participated in both the WHI Study of Cognitive Aging (WHISCA) and the WHI Memory Study of Magnetic Resonance Imaging (WHIMS-MRI) ancillary studies (Resnick et al., 2009; Coker et al., 2014). WHIMS participants (n = 7479) were postmenopausal females aged 65 years and older who were recruited from 1996 through 1999 across 48 states and free of dementia as determined by standardized study protocols, described elsewhere (Shumaker et al., 2004) (Supplementary material). A subsample of cognitively-intact WHIMS participants (n = 2304) were followed in WHISCA with annual neurocognitive testing during the period of 1999–2010. Between April 2005 and January 2006, WHIMS participants (n = 1403) across 14 (of 38) active WHIMS sites were enrolled in the WHIMS-MRI study, yielding 1365 scans that met quality control standards. A total of 1050 females participated in both WHISCA and WHIMS-MRI. For the present study, we excluded subjects with missing data on relevant covariates, resulting in a final analytic sample of 998 females (Fig. 1). A total of 531 females underwent a second MRI between 2009 and 2010.
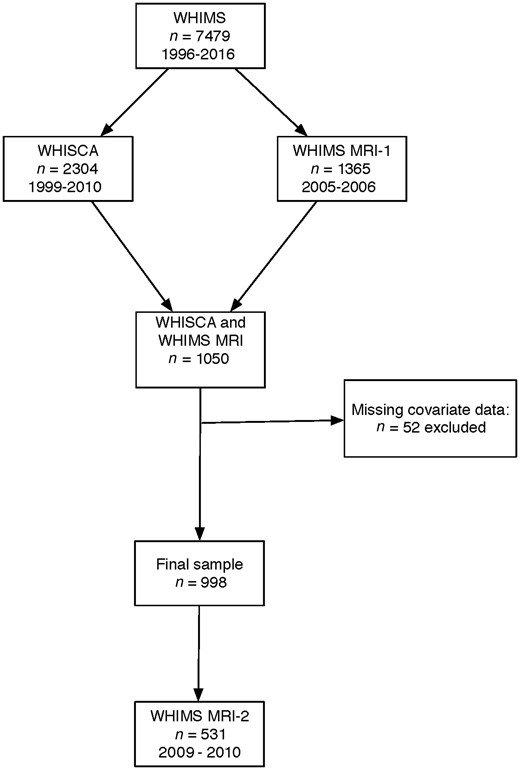
Flowchart for selection of final analytical sample..
Measures of episodic memory
Episodic memory was assessed using the California Verbal Learning Test (CVLT), focusing on immediate recall, new learning, and delayed-recall (Delis et al., 1987). Participants were read a 16-item list of words (List A) from four semantically-related categories. Each time the list was read the participant was instructed to immediately repeat back as many words as she could remember. In WHISCA, participants were administered only three learning trials. After completion of the List A trials, a single learning/recall trial of the alternate List B items was administered. Promptly after the List B ‘interference’ trial, the participants were asked to freely recall all words from List A (short-delay free recall). After an approximate 20-min delay, the free recall trials were repeated (long-delay free recall). For the outcome variables, we used the total number of correct responses on each measure: (i) List A learning trials 1–3; (ii) List B learning/recall trial; (iii) List A short-delay free recall; and (iv) List A long-delay free recall. Each measure was Z-score standardized based on the mean and standard deviation (SD) at the initial WHISCA assessment. The Z-scores for these three List A measures were averaged to create the composite score of CVLT performance.
WHIMS-MRI acquisition and processing
MRI scans were performed using standardized scan acquisition protocols developed by the MRI Quality Control Center (Resnick et al., 2009). Standard T1-, T2-, proton density-weighted, and fluid-attenuated inversion recovery (FLAIR) scans were acquired with a 22-cm field of view and a matrix of 256 × 256 in 1.5 T scanners at 14 sites. Included were oblique axial spin density/T2-weighted spin echo (repetition time = 3200 ms, echo time = 30/120 ms, slice thickness = 3 mm), FLAIR T2-weighted spin echo (repetition time = 8000 ms, inversion time = 2000 ms, echo time = 100 ms, slice thickness = 3 mm), and oblique axial 3D T1-weighted gradient echo (flip angle = 30°, repetition time = 21 ms, echo time = 8 ms, slice thickness = 1.5 mm) images from the vertex to the skull base parallel to the anterior commissure–posterior commissure plane.
As part of the WHIMS-MRI protocol developed by the reading centre, a brain lesion segmentation algorithm was applied to T1-, T2-, and FLAIR scans to segment small-vessel ischaemic disease (SVID) (Lao et al., 2008). By combining the tissue segmentation and lesion segmentation algorithm, each voxel was classified as either normal (not SVID-affect) or abnormal (SVID-affected). Normal-appearing brain volume and SVID volumes in grey and white matter regions were calculated, then abnormal brain volumes in these regions were combined to classify total SVID volume.
Joint brain MRI data processing across two populations
We used high-dimensional warping methods to process structural brain MRI images (T1-weighted) from WHIMS-MRI participants. More details about the MRI data processing across dataset can be found in other reports (Tustison et al., 2014; Casanova et al., 2018). Here, we briefly describe the main steps. The Advanced Normalization Tools software was used to align the brain images from the WHIMS-MRI and the Alzheimer’s Disease Neuroimaging Initiative (ADNI) into a common template. The images were submitted to N4 bias field correction (Tustison et al., 2010), brain extraction, segmentation (Avants et al., 2011), template construction and normalization. A script consisting of six stages (brain extraction, template registration, tissue segmentation, improved template registration, cortical thickness registration, and quality control and summary measurements) was used to generate the template based on a randomly selected sample of 50 cognitively normal Caucasian females (55–90 years old; mean age: 76.8) from ADNI. The brain MRI images (n = 2436) from both WHIMS-MRI and ADNI were segmented and warped to the template.
Alzheimer’s disease pattern similarity score
The Alzheimer’s disease pattern similarity (AD-PS) score was derived using a high-dimensional (voxel-wise) supervised machine learning algorithm based on the elastic net regularized logistic regression (EN-RLR) to analyse structural brain MRI data pattern at voxel level (Friedman et al., 2010), comparing Alzheimer’s disease cases and cognitively normal individuals (Casanova et al., 2011). The EN-RLR is known to produce sparse models (Zou and Hastie, 2005), which translates in the context of our neuroimaging application into a variable selection mechanism able to identify voxels or brain areas relevant for classification that we call discriminative maps. The score formally is the class-conditional probability of membership to the Alzheimer’s disease group as modelled by the EN-RLR model when discriminating cognitively normal from Alzheimer’s disease participants in ADNI (Casanova et al., 2013), interpreted as a measure of similarity of the brain spatial patterns found in one individual’s MRI to those found in individuals diagnosed with Alzheimer’s disease.
The AD-PS scores of WHIMS MRI participants were derived by two steps: (i) estimating the EN-RLR classifier based on grey matter probability maps from cognitively-normal and Alzheimer’s disease participants in ADNI; and (ii) providing baseline and follow-up WHIMS-MRI grey matter probability maps as input to the EN-RLR classifier to generate the grey matter AD-PS score for WHIMS-MRI participants. The discriminative maps derived in step (i) revealed grey matter atrophies in areas (e.g. amygdala, hippocampus, para-hippocampal gyrus, thalamus, inferior temporal lobe areas and midbrain) where Alzheimer’s disease neuropathologies are thought to first emerge (Brettschneider et al., 2015). We had previously reported both cross-sectional and longitudinal relationships of higher AD-PS scores with increased age, poorer cognitive performance, and greater SVID volume in WHIMS-MRI participants (Casanova et al., 2018). In a longitudinal analysis of global cognitive trajectories over 10 years, the groups of older females with relatively lower AD-PS scores were considered more resilient to cognitive decline (Espeland et al., 2018). Our empirical data also showed that an SD (=0.23) increase in AD-PS scores over a 5-year period was associated with a 122% increase in dementia risk [hazard ratio = 2.22; 95% confidence interval (CI): 1.80 to 2.75] defined by DSM-IV criteria, adjusting for socio-demographics, region, lifestyle factors, and clinical characteristics.
Air pollution exposure assessment
Residential addresses of WHIMS participants were prospectively collected during each clinic visit and updated at least biannually. Residential histories were then sent to a single vendor that followed standardized protocols for geocoding (Whitsel et al., 2004). Ambient concentration of PM2.5 was estimated using the Bayesian maximum entropy (BME)-based spatiotemporal modelling approach, integrating nationwide monitoring data from both the US Environmental Protection Agency (EPA) Air Quality System (AQS) and the output of chemical transport models, entitled Community Multiscale Air Quality (Reyes et al., 2017). Our empirical data showed that the BME estimates of daily PM2.5 exposures correlated well with recorded concentrations from the AQS (average cross-validation Pearson’s R2 = 0.70). The statistically-validated BME model was then applied to each geocoded residential location, accounting for residential mobility in 1999–2010, and exposure estimates were then aggregated to represent the average PM2.5 3 years preceding the first MRI scan. See Supplementary material for further details.
Covariate data
A structured questionnaire was administered to participants at WHIMS enrolment to gather information on demographics [e.g. age; race/ethnicity (Black/African-American, Hispanic White, non-Hispanic White, other/missing)], socioeconomic factors [e.g. education (<high school, high school/GED, >high school); family income (<$10 000, $10 000–34 999, $35 000–74 999, ≥$75 000); employment status (currently employed, not working, retired)], and lifestyle factors [e.g. smoking status (never smoked, past smoker, current smoker); alcohol intake (non-drinker, past drinker, <1 drink per day, >1 drink per day); physical activity (no activity, some activity, 2–4 episodes per week, >4 episodes per week)]. Additionally, clinical characteristics were ascertained including any postmenopausal hormone treatment ever, history of cardiovascular disease [including previous coronary heart disease (e.g. myocardial infarction, coronary angioplasty, or coronary artery bypass graft), stroke, or transient ischaemic attack, hypertension [defined as elevated blood pressure (systolic ≥140 or diastolic ≥90 mmHg), or use of antihypertensive medication], and diabetes mellitus (defined as physician diagnosis plus oral medications, or insulin therapy). Good reliability and validity of both the self-reported medical histories and the physical measures have been previously documented (Heckbert et al., 2004; Johnson-Kozlow et al., 2007; Margolis et al., 2008).
Statistical analysis
We constructed multilevel structural equation models (SEM) to characterize the longitudinal trajectory of each CVLT measure and examined the respective association with PM2.5 exposure. Years across repeated CVLT assessments were used as the time scale, centred on the individual-specific date of the first MRI (MRI-1). The average trajectories of CVLT performance were assumed to follow piecewise-linear declines joined at MRI-1. The multilevel SEM allowed for one random intercept (representing CVLT performance at MRI-1) and two random slopes (individual-specific linear changes before and after the MRI-1), while accounting for the practice effect and the use of two CVLT forms, as defined in the within-individual portion of SEM (Supplementary material, Equation 1). These individual-specific parameters of individual trajectories were entered into the between-individual portion of the multilevel SEM to assess the associations between PM2.5 exposure and linear change in CVLT. To ensure the appropriate temporal relations between PM2.5 and identified CVLT trajectories, the relevant exposure time window was defined as 3 years preceding the MRI-1, with the resulting effect on annual rate of CVLT change after MRI-1. The between-individual portion of the fully adjusted multilevel SEM is depicted in Fig. 2A and in the Supplementary material. Separate SEMs were run for each CVLT measure and composite score.
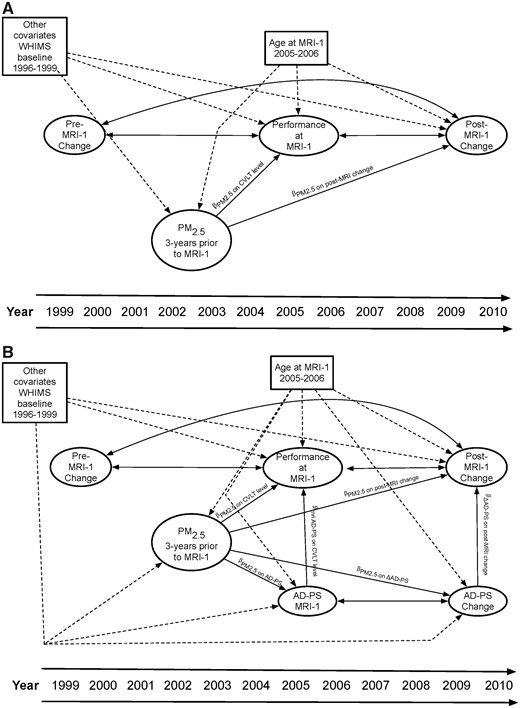
Depiction of the SEMs constructed. (A) Panel shows the portion of the fully adjusted multilevel SEM examining the associations between PM2.5 exposure and level and change in CVLT performance. (B) Panel depicts parallel-process mediation SEM estimating the extent to which change in AD-PS score mediates the association between long-term fine particulate matter exposure and declines in episodic memory.
The estimated PM2.5 exposure effects on CVLT performance at MRI-1 and change post MRI-1 were all adjusted for the following covariates: age at MRI-1, race/ethnicity, geographic region of residence, education, household income, employment status, lifestyle factors (smoking; alcohol use; physical activities), and clinical characteristics (any prior hormone use ever, hypercholesterolaemia, hypertension, diabetes, and history of cardiovascular disease).
We used multilevel SEMs with parallel-process mediation (Cheong et al., 2003) to assess whether increased AD-PS scores mediated the adverse PM2.5 effects, if any observed on the post MRI-1 decline in CVLT performance. Figure 2B depicts the between-individual portion of the fully adjusted parallel process mediation SEM. AD-PS scores at MRI-1 and average annual changes in AD-PS [(AD-PSMRI2 − AD-PSMRI1)/years between MRI assessments] were added as variables to the between-individual portion of the multilevel model. The indirect effect, defined as the extent to which change in AD-PS score mediated the PM2.5 effect on CVLT change, was estimated by multiplying the two SEM paths: (i) the effect of PM2.5 on change in AD-PS score; and (ii) the effect of change in AD-PS score on change in CVLT. We then estimated the direct effect of PM2.5 on CVLT change, defined as the PM2.5 exposure effects on post MRI-1 change in CVLT performance, independent of change in AD-PS score. Using the approach described by Cheong et al. (2003) and MacKinnon et al. (2002), we estimated the proportion of the total PM2.5 effect (the sum of the direct and indirect effect) on CVLT change that was mediated by changes in AD-PS score. In fully-adjusted multilevel parallel-process mediation SEMs, the PM2.5 effects on the outcome variables (CVLT performance at MRI-1; annual change post MRI-1) and the putative mediators (AD-PS score at MRI-1 and subsequent change in AD-PS score) were all adjusted for the same set of covariates as described in the multilevel SEM models examining the PM2.5 effect on CVLT trajectories.
Several additional analyses were conducted to examine the robustness of our findings. To assess the possible confounding by neighbourhood socioeconomic characteristics, the SEMs further adjusted for census track-level socioeconomic characteristics of residential neighbourhood (Qi et al., 2012) closest to MRI-1 (Supplementary material). To explore whether any observed associations between PM2.5 and CVLT decline simply reflect the underlying dementia risk, we repeated our analyses after excluding incident dementia cases before the year 2010. To explore whether any observed associations could be explained by cerebrovascular disease and associated damage, we excluded incident stroke cases by 2010 (Supplementary material) and further adjusted for global SVID volume in the mediation analyses. We also conducted ad hoc mediation analyses by replacing the AD-PS score with global grey matter volume, to illustrate whether the associations between PM2.5 and CVLT decline may be mediated by standard volumetric measures of global grey matter atrophy. To assess the possible unmeasured confounding by other factors that may operate through affecting the pre-MRI trajectories, we ran a sensitivity analysis allowing the correlation between exposure and the change in CVLT performance before MRI-1. Lastly, to ensure we were not overfitting the covariate structure, we constructed an alternative SEM where the estimated PM2.5 effect on the post MRI-1 trajectory was only adjusted for the selected covariates significantly associated with changes in CVLT performance after MRI-1. All analyses were performed using MPLUS version 8 (Muthén and Muthén, 1998–2018) via the MPLUS automation package (Hallquist and Wiley, 2018) in R version 3.5.1.
Data availability
Access to all data elements used in this study may be made available following the established WHI policies.
Results
Population characteristics
The majority of the older females in our study population were Caucasian (92.0%) and had more than a high-school education (75.4%). Table 1 compares the distribution of the 3-year average PM2.5 exposure prior to MRI-1, stratified by population characteristics. Participants exposed to higher levels of PM2.5 were more likely to self-identify as African-American or Hispanic, reside in the West, and report higher household incomes (≥$75 000). Our study sample (n = 998) and the excluded subjects (n = 367) did not significantly differ by race/ethnicity, employment status, household income, smoking status, alcohol use, or selected clinical characteristics including hypertension, diabetes, or cardiovascular disease (Supplementary Table 1). Compared to females from the WHIMS-MRI cohort who were excluded from our final analytic sample, subjects included in our analyses were more likely to reside in the Midwest (P < 0.01), were more educated (P < 0.01), and reported more physical activities (P = 0.02), and also tended to have high cholesterol (P = 0.07) and use hormone treatment (P = 0.06). We also compared the population characteristics of our final sample (n = 998) by those who did (n = 531) and did not (n = 467) return for their second MRI scan (Supplementary Table 1). Compared to females who did not return, MRI-2 participants were more likely to reside in the Midwest and Northeast regions (P < 0.01) and self-identify as non-Hispanic White (P = 0.01), but were less likely to report having hypertension (P = 0.02).
Comparison of estimated PM2.5 exposure measured at MRI-1 visit by baseline population characteristics (n = 998)
| Population characteristics | n (%) | Distribution of 3-year average PM2.5a | Pb | ||||
|---|---|---|---|---|---|---|---|
| Mean | SD | 25th | Median | 75th | |||
| Overall | 998 | 11.63 | 2.41 | 10.1 | 10.8 | 13.0 | |
| Region of residence | <0.01 | ||||||
| Northeast | 174 (17.4) | 11.62 | 1.36 | 10.7 | 11.2 | 12.6 | |
| South | 156 (15.6) | 10.98 | 1.42 | 9.8 | 10.2 | 12.3 | |
| Midwest | 398 (39.9) | 11.53 | 2.10 | 10.2 | 10.5 | 14.0 | |
| West | 270 (27.1) | 12.16 | 3.47 | 10.1 | 10.8 | 14.5 | |
| Race/ethnicity | <0.01 | ||||||
| African-American | 42 (4.2) | 13.44 | 2.59 | 12.0 | 13.0 | 14.3 | |
| Hispanic white | 13 (1.3) | 12.34 | 2.38 | 10.6 | 11.5 | 13.7 | |
| Non-Hispanic white | 918 (92) | 11.52 | 2.33 | 10.1 | 10.7 | 12.6 | |
| Other or missing | 25 (2.5) | 12.13 | 3.44 | 10.2 | 11.3 | 12.7 | |
| Education | 0.05 | ||||||
| Less than high school | 36 (3.6) | 11.62 | 2.25 | 10.4 | 11.2 | 13.5 | |
| High school | 210 (21) | 11.27 | 1.96 | 10.1 | 10.6 | 11.6 | |
| More than high school | 752 (75.4) | 11.73 | 2.52 | 10.1 | 10.8 | 13.2 | |
| Employment | 0.28 | ||||||
| Currently working | 185 (18.5) | 11.40 | 2.53 | 10.1 | 10.6 | 12.3 | |
| Not working | 99 (9.9) | 11.84 | 2.33 | 10.2 | 10.9 | 13.4 | |
| Retired | 714 (71.5) | 11.66 | 2.38 | 10.1 | 10.8 | 13.0 | |
| Income, in USD | 0.03 | ||||||
| <9999 | 198 (19.8) | 11.29 | 2.05 | 10.2 | 10.7 | 11.8 | |
| 10 000–34 999 | 299 (30) | 11.59 | 2.38 | 10.0 | 10.7 | 13.0 | |
| 35 000–49 999 | 230 (23) | 11.62 | 2.40 | 10.1 | 10.7 | 12.8 | |
| 50 000–74 999 | 141 (14.1) | 11.77 | 2.64 | 10.2 | 10.9 | 13.2 | |
| 75 000 or more | 100 (10) | 12.28 | 2.71 | 10.4 | 11.0 | 14.5 | |
| Don't know | 30 (3) | 11.59 | 2.41 | 10.1 | 11.1 | 13.2 | |
| Lifestyle | |||||||
| Smoking status | 0.26 | ||||||
| Never smoked | 584 (58.5) | 11.67 | 2.42 | 10.2 | 10.8 | 13.0 | |
| Past smoker | 376 (37.7) | 11.52 | 2.34 | 10.1 | 10.7 | 12.6 | |
| Current smoker | 38 (3.8) | 12.14 | 2.72 | 10.1 | 11.1 | 14.1 | |
| Alcohol use | 0.30 | ||||||
| Non-drinker | 131 (13.1) | 11.85 | 2.46 | 10.1 | 11.0 | 13.5 | |
| Past drinker | 157 (15.7) | 11.56 | 2.23 | 10.1 | 10.7 | 13.0 | |
| Less than one drink per day | 596 (59.7) | 11.54 | 2.37 | 10.1 | 10.7 | 12.5 | |
| More than one drink per day | 114 (11.4) | 11.92 | 2.73 | 10.3 | 11.0 | 13.2 | |
| Moderate or strenuous activities ≥20 min | 0.15 | ||||||
| No activity | 547 (54.8) | 11.66 | 2.44 | 10.1 | 10.8 | 13.2 | |
| Some activity | 57 (5.7) | 12.01 | 2.35 | 10.4 | 10.8 | 14.3 | |
| 2–4 episodes/week | 214 (21.4) | 11.73 | 2.48 | 10.2 | 10.7 | 13.0 | |
| ≥4 episodes/week | 180 (18) | 11.30 | 2.18 | 10.0 | 10.8 | 12.2 | |
| Physical health | |||||||
| Hypertension | 0.78 | ||||||
| No | 644 (64.5) | 11.61 | 2.44 | 10.1 | 10.8 | 13.0 | |
| Yes | 354 (35.5) | 11.66 | 2.35 | 10.2 | 10.7 | 12.9 | |
| High cholesterol | 0.10 | ||||||
| No | 827 (82.9) | 11.57 | 2.37 | 10.1 | 10.7 | 12.9 | |
| Yes | 171 (17.1) | 11.91 | 2.58 | 10.3 | 10.9 | 13.3 | |
| Diabetes mellitus | 0.62 | ||||||
| No | 969 (97.1) | 11.64 | 2.43 | 10.1 | 10.7 | 13.0 | |
| Yes | 29 (2.9) | 11.41 | 1.33 | 10.6 | 10.9 | 12.3 | |
| Cardiovascular disease | 0.39 | ||||||
| No | 857 (85.9) | 11.60 | 2.41 | 10.1 | 10.8 | 12.8 | |
| Yes | 141 (14.1) | 11.79 | 2.40 | 10.2 | 10.7 | 13.7 | |
| Hormone treatment ever | 0.77 | ||||||
| No | 520 (52.1) | 11.61 | 2.28 | 10.2 | 10.7 | 12.9 | |
| Yes | 478 (47.9) | 11.65 | 2.53 | 10.1 | 10.8 | 13.0 | |
PM2.5 represents the 3-year exposures aggregated from the daily exposure levels estimated at each residential location prior MRI-1 visit time using the Bayesian maximum entropy spatiotemporal model.
P-values estimated from ANOVA tests comparing average exposure.
Associations between PM2.5 exposure and change in CVLT
Multilevel SEMs revealed significant linear declines in episodic memory before MRI-1 across all CVLT measures (Supplementary Table 2 with estimated population trajectories). Linear declines in CVLT performance were generally larger after the MRI-1 across all measures except for long-delay free recall. The observed between-individual variability was statistically significant for the level of CVLT performance at the MRI-1 and linear changes in individual-specific estimates of all CVLT trajectories before MRI-1. Between-individual variability in change was generally larger after the MRI-1 but not statistically significant.
Across all CVLT measures, PM2.5 exposure was not associated with the estimated level of performance at MRI-1 (Table 2, top section). There was evidence for adverse PM2.5 effects with greater declines in both CVLT measures of immediate recall and new learning (List A learning Trials 1–3 and List B learning/recall trial), but no statistically significant associations were found with delayed-recalls or composite measure (Table 2, bottom section). Across each interquartile increment of PM2.5 (2.81 μg/m3), the average rate of annual decline in immediate recall/new learning was significantly accelerated by 0.040 SDs (95% CI: −0.076 to −0.004) for Trials 1-3 and 0.057 SDs (−0.096 to −0.017) for List B. As compared with the effect of age at MRI-1 (βage = −0.010; P = 0.017) in the same model on post MRI-1 change in CVLT Trials 1–3, the magnitude of the adverse exposure effect (per interquartile increment of PM2.5) was equivalent to ∼4 years of accelerated decline in immediate recall/new learning performance. Overall, the multicovariate-adjusted average rate of change was significantly accelerated by 19.3% (95% CI: 1.9% to 36.2%) for Trials 1–3 and 14.8% (4.4% to 24.9%) for List B.
Associations between 3-year average PM2.5 (per IQR of 2.81 μg/m3) exposure and estimated trajectories of CVLT performance
| CVLT measures | Unadjusted | Fully-adjusted |
|---|---|---|
| β (95% CI) | β (95% CI) | |
| Estimatesaof PM2.5 effects on CVLT performance at MRI-1b | ||
| Trials 1–3 | 0.014 (−0.043, 0.070) | 0.002 (−0.052, 0.057) |
| List B | 0.045 (−0.002, 0.091) | 0.041 (−0.003, 0.084) |
| Short-delay free recall | −0.011 (−0.067, 0.028) | −0.017 (−0.071, 0.038) |
| Long-delay free recall | −0.017 (−0.073, 0.038) | −0.026 (−0.080, 0.029) |
| Composite score | −0.008 (−0.063, 0.046) | −0.017 (−0.070, 0.036) |
| Estimatesaof PM2.5 effects on the annual change in CVLT performance after MRI-1c) | ||
| Trials 1–3 | −0.039 (−0.075, −0.004) | −0.040 (−0.076, −0.004) |
| List B | −0.053 (−0.093, −0.014) | −0.057 (−0.096, −0.017) |
| Short-delay free recall | −0.009 (−0.046, 0.028) | −0.007 (−0.045, 0.031) |
| Long-delay free recall | −0.006 (−0.045, 0.033) | −0.002 (−0.041, 0.037) |
| Composite score | −0.020 (−0.052, 0.013) | −0.018 (−0.051, 0.015) |
All estimates derived from the multilevel structural equation model (SEM) as depicted in Fig. 2A.
Estimates correspond to the βPM2.5 on CVLT level parameter depicted in Fig. 2A. In fully adjusted models, the effect of PM2.5 on CVLT performance at MRI-1 was adjusted for age at MRI-1, race/ethnicity, geographic region of residence, education, household income, employment status, lifestyle factors (smoking, alcohol use, physical activities) and clinical characteristics (use of hormone treatment; hypercholesterolaemia, hypertension, diabetes, and history of cardiovascular disease).
Estimates correspond to the βPM2.5 on post-MRI change parameter depicted in Fig. 2A. In fully-adjusted models, the effect of PM2.5 on change in CVLT performance after MRI-1 was adjusted for age at MRI-1, race/ethnicity, geographic region of residence, education, household income, employment status, lifestyle factors (smoking, alcohol use, physical activities) and clinical characteristics (use of hormone treatment; hypercholesterolaemia, hypertension, diabetes, and history of cardiovascular disease).
Bolded estimates denote PM2.5 effects that are statistically significant at P < 0.05.
Mediation analyses involving AD-PS scores
The results of the multilevel SEMs with parallel process mediation are presented in Table 3. PM2.5 exposure was associated with an increased AD-PS score (βPM2.5 on ΔAD-PS = 0.018; 95% CI: 0.001 to 0.034). Increases in the AD-PS score were also associated with greater declines on both Trials 1-3 (βΔAD-PS on Trials 1-3 post-MRI change = −0.459; 95% CI: −0.804 to −0.115) and List B (βΔAD-PS on List B post-MRI change = −0.347; 95% CI: −0.609 to −0.085) performance after MRI-1. The multicovariate-adjusted indirect PM2.5 effects on post MRI-1 changes were statistically significant for both Trials 1-3 (IndirectPM2.5 on Trials 1-3 post-MRI change = −0.008; 95% CI: −0.0262 to −0.0002) and List B performance (IndirectPM2.5 on List B post-MRI change = −0.006; 95% CI: −0.0170 to −0.0002). Together, the estimated change in AD-PS significantly mediated the observed association between PM2.5 exposure and post MRI-1 declines of both Trials 1–3 and List B performance. In fully-adjusted models, the mediation path that linked PM2.5 exposure with accelerated declines of episodic memory by increasing the AD-PS score explained 22.6% (95% CI: 1.0% to 68.9%) and 10.7% (1.0% to 30.3%) of the adverse effects on CVLT performance in Trials 1–3 and List B performance, respectively.
Multilevel SEMs with parallel process mediation to examine whether increased Alzheimer's disease pattern similarity scores mediate the adverse PM2.5 effects (per IQR of 2.81 mg/m3) on declines of immediate recall/new learning
| CVLT Trials 1–3 | CVLT List B | |||
|---|---|---|---|---|
| Unadjusted | Adjusted | Unadjusted | Adjusted | |
| β (95% CI) | β (95% CI) | β (95% CI) | β (95% CI) | |
| Estimatesa of direct effect | ||||
| Effect of PM2.5 on annual change in CVLT performance after MRI-1, accounting for the indirect effectb | −0.024 (−0.059, 0.012) | −0.030 (−0.089, −0.008) | −0.045 (−0.085, −0.006) | −0.049 (−0.089, −0.010) |
| Estimatesa of indirect effect | ||||
| Effects of PM2.5 on the increase of in AD-PS scoresc | 0.022 (0.006, 0.039) | 0.018 (0.001, 0.034) | 0.022 (0.006, 0.039) | 0.018 (0.001, 0.034) |
| Effects of increased AD-PS score on annual change in CVLT performance after MRI-1d | −0.592 (−0.913, −0.271) | −0.459 (−0.804, −0.115) | −0.333 (−0.587, −0.079) | −0.347 (−0.609, −0.085) |
| Proportion of total PM2.5 effect mediated by increased AD-PS scores | 35.1% (6.2%, 78.1%) | 22.6% (1%, 68.9%) | 13.2% (1.3%, 35.1%) | 10.7% (1%, 30.3%) |
Estimates bolded if statistically significant at P < 0.05. AD-PS was z-score standardized based on the mean and SD at WHIMS MRI-1.
All estimates derived from the multilevel structural equation models with parallel process mediation as depicted in Fig. 2B. In fully-adjusted models, all the presented effect estimates on CVLT decline (direct PM2.5 effects; indirect effect paths, including CVLT decline affected by increased AD-PS scores) were adjusted for age at MRI-1, race/ethnicity, attrition, geographic region of residence, education, household income, employment status, lifestyle factors (smoking, alcohol use, physical activities), and clinical characteristics (use of hormone treatment; hypercholesterolaemia, hypertension, diabetes, and history of cardiovascular disease).
Estimate corresponds to the βPM2.5 on post-MRI change parameter depicted in Fig. 2B.
Estimate corresponds to the βPM2.5 on ΔAD-PS parameter depicted in Fig. 2B.
Estimate corresponds to the βΔAD-PS on post-MRI change parameter depicted in Fig. 2B.
Sensitivity analyses
In the analysis further adjusting for census track-level socioeconomic characteristics of residential neighbourhood, the findings were robust (Supplementary Tables 3 and 4). After excluding 31 older females with incident dementia, the association with CVLT decline in Trials 1-3 was modestly attenuated and became marginally significant (P = 0.056), but the corresponding association with CVLT decline in List B performance remained statistically significant (Supplementary Table 5). Importantly, excluding the incident dementia cases only caused minimal changes to the results on mediation by increased AD-PS scores (Supplementary Table 6). Furthermore, the overall patterns of observed associations, including the estimates of adverse PM2.5 effect and results of mediation analyses, were robust after excluding 17 females with incident clinical stroke by 2010 and further adjusting for global SVID (Supplementary Tables 7 and 8). When the change in total grey matter volume was assumed as a mediator of PM2.5 effect on changes in CVLT performance, we found the direct PM2.5 effects on decline of immediate recalls/new learning remained statistically significant, but global change in grey matter did not play any significant role in mediating the observed associations (Supplementary Table 9). Lastly, allowing CVLT change before MRI-1 to covary with PM2.5 exposure (Supplementary Tables 10 and 11) or regressing change after MRI-1 only on selected covariates (age at MRI-1; geographic region of residence; household income) predictive of the post MRI-1 trajectories (Supplementary Tables 12 and 13) did not have any notable impacts on the results.
Discussion
In this prospective study on older females, our findings suggest that long-term exposure to ambient PM2.5 at residential locations was associated with accelerated declines in episodic memory, specifically in the measures of immediate recall and new learning. Using a parallel-process SEM approach, we further demonstrated that the PM2.5-associated greater decline in episodic memory (immediate recall and new learning) was partly (10–22%) mediated by increasing AD-PS scores (a structural brain MRI-based neuroanatomic biomarker reflecting high-dimensional grey matter atrophies in brain areas vulnerable to Alzheimer’s disease neuropathology). These observed associations could not be explained by socio-demographic factors (age, geographic region, race/ethnicity, education, income), lifestyle (smoking, alcohol, physical activity), employment status, clinical characteristics (diabetes, high cholesterol, hypertension, cardiovascular diseases, hormone therapy), or MRI-measured cerebrovascular disease, and remained measurable after excluding incident cases of dementia and stroke. In contrast, we found no evidence of statistically significant associations between PM2.5 exposure and the observed declines in delayed-recall or the composite measure of episodic memory. To our knowledge, this is the first study to suggest that long-term PM2.5 exposure accelerates the early cognitive decline commonly seen before the dementia onset, and this putative neurotoxic effect in the preclinical stage is mediated by altered brain structure that predicts subsequent Alzheimer’s disease risk.
Previous studies on air pollution and cognitive decline had yielded inconsistent results (Peters et al., 2019), but our data provide the most compelling epidemiological evidence so far to support the adverse effect on the preclinical trajectories of episodic memory in older females affected by PM2.5 exposure in late life, suggesting the long-term air pollution neurotoxicity across the Alzheimer’s disease continuum. Episodic memory is one of the cognitive domains with early declines detectable in preclinical Alzheimer’s disease (Aisen et al., 2017). Three cohort studies had examined the association between PM2.5 exposure and episodic memory decline, but their reported findings were mixed, including no significant association in the Nurses’ Health Study (Weuve et al., 2012), a positive association in the Boston Puerto Rican Health Study (Wurth et al., 2018) and a negative association (with a single measure of immediate recall) in the Whitehall II study (Tonne et al., 2014). These three reports were limited by only two to three cognitive assessments, and so far none of these cohort studies had examined the association between exposure and incident dementia or clinically significant cognitive impairment. Investigators in the Betula Project in Sweden possibly made the first attempt to establish the air pollution exposure effect continuum in dementia. They found nitrogen oxide exposure was associated with increased dementia risk (Oudin et al., 2016), but not with episodic memory decline (Oudin et al., 2017). The exact reasons for this discrepancy were unclear, because episodic memory measured 10 years prior to clinical diagnosis significantly predicted dementia in the Betula cohort (Boraxbekk et al., 2015). One possible explanation is that the air pollution neurotoxicity observed in the Swedish cohort only accelerated the pathological brain ageing process during the clinical stage. However, this interesting hypothesis was not supported by the neurotoxicological data showing that diesel engine exhaust accelerated amyloid-β plaque formation, with no overt deficits in spatial memory (Hullmann et al., 2017). In contrast, we have previously reported that residing in locations with high PM2.5 exposure was associated with clinically significant cognitive impairment and dementia among non-Hispanic white older females from WHIMS (Cacciottolo et al., 2017). In the current study using data from WHIMS participants who were tested with CVLT annually for the WHISCA, we further found that PM2.5 exposure was associated with greater declines in episodic memory (immediate recall and new learning), equivalent to ∼4 years of accelerated decline. These findings were observed even among cognitively intact older females without dementia. We also showed these observed adverse PM2.5 effects on accelerated decline in episodic memory were partly mediated by the increased AD-PS score, an earlier biomarker reflecting the neuroanatomic risk associated with progressive grey matter atrophy in brain regions vulnerable to Alzheimer’s disease neuropathology. Although our collective findings point to the possible continuum of PM2.5 neurotoxicity across the early neuropsychological processes and altered brain structures predictive of subsequent dementia risk, we call for future studies to replicate our results in other populations and to further substantiate the scientific evidence of the continuum of air pollution neurotoxicity in the preclinical stage.
Our study illustrates the promise of new approaches to understanding the neuropsychological processes and altered brain structure associated with air pollution exposure.
First, to the best of our knowledge, this was the first air pollution epidemiological study to combine both longitudinal brain MRI and cognitive function data, allowing us to investigate the brain–behaviour relations affected by PM2.5 neurotoxicity. Such combined neuroimaging-neuropsychological data analyses are important as they better inform our understanding of the brain determinants of the cognitive changes of Alzheimer’s disease to address important clinical and scientific challenges presented by Alzheimer’s disease (Mungas et al., 2012). Second, using a sophisticated parallel-process SEM, our study represents the first application to air pollution epidemiology of brain ageing to simultaneously model level and change in both cognitive decline and longitudinal change in structural brain MRI measures and further examine the hypothesized mediation effects. This analytical approach is important because it allows researchers to directly examine complex questions about intra-individual changes in cognitive performance and neuroimaging data in a single statistical model. Lastly, we used the AD-PS scores as a more specific measure of altered brain structure in brain areas that are likely more vulnerable to the Alzheimer’s disease neurodegenerative processes. In contrast, previous human studies using neuroimaging data to investigate PM2.5 effects on altered brain structure used the region-of-interest approach (Chen et al., 2015; Wilker et al., 2015; Power et al., 2018) or conducted whole-brain analyses (Casanova et al., 2016), and none of these studies found a significant association with the volumes of hippocampus, which is not specific to Alzheimer’s disease (Frisoni et al., 2010). Also, the majority of these previous studies (Chen et al., 2015; Wilker et al., 2015; Casanova et al., 2016) did not evaluate the possibility that PM2.5 neurotoxicity may result in brain atrophy with unique spatial patterns, similar to the spreading of neurodegenerative proteins as shown in many neuropathological studies in Alzheimer’s disease (Brettschneider et al., 2015). Although Power et al. (2018) also studied grey matter volumes in brain regions vulnerable to Alzheimer’s disease neuropathology, a few methodological differences were noteworthy. For instance, Power et al. investigated the putative neurotoxic effects of PM2.5 on brain volumes measured at one time point, while we conducted a longitudinal study based on changes of AD-PS score across two time points (2005–06 and 2009–10). Additionally, the ‘Alzheimer’s disease signature regions’ used by Power et al. were selected based on work by Dickerson et al. (2011) applying a hypothesis-driven region-of-interest approach. In contrast, to create the AD-PS score, we took a data-driven approach using supervised machine learning based on a large-scale regularization algorithm that analyses whole-brain grey matter tissue at the voxel-level and identifies the unique spatial patterns of localized grey matter atrophy in Alzheimer’s disease.
Our empirical data pointed to the possibility that PM2.5 neurotoxicity may have differential effects across the episodic memory processes, although the biological underpinnings of such observed differences are unclear. Published work on PM2.5 and episodic memory decline had found an unexpected positive association in the Boston Puerto Rican Health Study (Wurth et al., 2018) and no statistically significant association in the Nurses’ Health Study (Weuve et al., 2012), both using a composite measure, which ignores the important heterogeneity in the neuropsychological processes that comprise episodic memory performance. In the present study, we were able to show the differential effects of PM2.5 exposure on episodic memory, with the exposure-associated decline predominantly affecting immediate recall and new learning and no significant association with delayed-recall ability or our composite measure of episodic memory. In the Baltimore Longitudinal Study of Aging, declines in CVLT immediate recall/encoding processes were observed first with Alzheimer’s disease progression, followed by changes in long-delayed free recall scores, suggesting that changes in immediate recall/new learning may take place earlier during the preclinical stages of Alzheimer’s disease (Bilgel et al., 2014). Thus, the observation of differential exposure effects on CVLT measures reinforces the suggestion that our study was capturing the PM2.5 neurotoxic effects on the early neuropsychological processes of episodic memory decline at the preclinical stage. The medial temporal lobe and the interactions of its structural components play a central role in the episodic memory (Dickerson and Eichenbaum, 2010). Early studies have documented the functional specification of the prefrontal cortex involved in different cognitive processes in episodic memory (Fletcher et al., 1998a, b). More recent studies further demonstrated the distinctive roles of large-scale cortical networks contributing to the different cognitive processes of episodic memory in individuals with prodromal (Putcha et al., 2019) and clinical Alzheimer’s disease (Wolk et al., 2011). Future studies need to continue examining the possibly differential exposure effects on the episodic memory processes and further elucidate how these related neural networks are affected by PM2.5 neurotoxicity.
Our study results, as well as the growing literature on air pollution neurotoxicity, point to several important directions for advancing the environmental neurosciences of brain ageing associated with exposure to ambient particles. We found that long-term PM2.5 exposure was associated with increasing AD-PS scores, which only accounted for 10–22% the PM2.5-associated greater decline in episodic memory, and the direct exposure effects remained statistically significant (Table 3). Other contributors to the observed episodic memory decline associated with PM2.5 exposure may include the alteration of other brain structures, changes in neural networks, and specific neuropathological processes, not fully captured by the increased AD-PS scores. For example, hippocampal subfields may be critical targets of the air pollution neurotoxicity on the neuropsychological processes of episodic memory decline. The medial temporal lobe and its structural components (especially the hippocampus) play a central role in encoding (learning; recall) and retrieving (recall) details of events that compose episodic memories (Dickerson and Eichenbaum, 2010). Although the roles of hippocampal subfields [e.g. cornu ammonis (CA, CA2-3), CA4-denate gyrus, presubiculum, subiculum] on these distinct processes (encoding, retrieval) remain to be delineated, animal studies have demonstrated the adverse effects of particulate matter and its constituents on morphological and functional changes within hippocampal subfields. For instance, decreased apical dendritic spine density and dendritic branches in the CA1 and CA3 regions (Fonken et al., 2011), reduced synaptic function (Ku et al., 2017) in CA1 neurons (Davis et al., 2013), and decreased myelin basic protein in white matter and increased atrophy of neurites in the CA1 region (Woodward et al., 2017) have been observed. These neurotoxicological data collectively suggest that some hippocampal subfields may be more sensitive than others to the adverse particulate matter effects. Additionally, human imaging studies (Zhao et al., 2019) have found that atrophy in hippocampal subfields imposed varying degrees of influences on different measures of episodic memory (immediate recalls; delayed-recalls; recognition). Previous research also suggests that the CA2, CA3, and dentate gyrus are responsible for encoding, while the CA1 and subiculum are responsible for retrieval (Zammit et al., 2017). Our findings of significant declines predominantly in immediate recall/new learning imply that the adverse PM2.5 effects on episodic memory processes may be more targeted towards hippocampal subfields related to encoding, such as the CA2, CA3, and dentate gyrus. High-resolution neuroimaging studies are needed to determine whether there is indeed a subfield neurotoxicity involved. Next, studies have shown that cerebrovascular disease, MRI measures of vascular brain injury (e.g. white matter hyperintensities; infarcts), and vascular risk factors are independently associated with cognitive decline (Marchant et al., 2013; DeCarli et al., 2019). Our exploratory analyses showed robust findings even after further adjustment for global SVID volume (a proxy for cerebrovascular damage) or excluding females with incident clinical stroke. Although these results suggest that the observed mediation by increased AD-PS score associated with late-life exposure to PM2.5 may be independent of large-vessel diseases or global cerebrovascular damage, it is important not to rule out other measures of cerebral small-vessel diseases (e.g. microbleeds, cerebral amyloid angiopathy) for their potential contributions to the exposure effects on episodic memory declines. Lastly, other neuropathological processes underlying the observed mediation by increasing AD-PS scores are unclear. Meta-analyses of studies with PET scans of cognitively-normal individuals found that high amyloid-β status predicts subsequent decline in episodic memory (Baker et al., 2017). PET studies have also shown that grey matter atrophy may be a consequence of tau neuropathological processes, which in turn may be driving the observed cognitive decline (Bejanin et al., 2017; Jagust, 2018; Harrison et al., 2019). Future neuroimaging studies are needed to determine whether specific neuropathological processes (e.g. aggregation of phosphorylated tau in neurofibrillary tangles; amyloid-β plaque deposition) drive the PM2.5-associated greater decline in episodic memory.
We recognize several limitations of our study. First, although the BME spatiotemporal models were well cross-validated (average Pearson’s R2 = 0.70) to estimate PM2.5 exposures, these resulting estimates were still subject to measurement errors because individual-level data on time-activity patterns of our study participants were not available. However, such estimation errors tend to be non-differential, most likely resulting in attenuation of the observed associations. Second, we were unable to estimate early- or mid-life PM2.5 exposures, because nationwide PM2.5 monitoring data were unavailable prior to 1999 and early-life residential location data were not collected in WHI. Since air pollution levels have been declining over the past two decades, early- or mid-life PM2.5 exposure effects could have been greater than or different from what we observed in our study on late-life exposure. Third, our study focused on regional PM2.5 only, and we did not investigate its chemical constituencies (e.g. black carbon; inorganic secondary aerosols), other exposure sources (e.g. from near roadways), or possible interactions with other pollutant mixtures (e.g. with photochemical reactions of gaseous pollutants). Fourth, although our sensitivity analyses suggest stroke and cerebrovascular disease damage could not explain the observed adverse PM2.5 effects on episodic memory decline, we did not examine multiple mediation pathways involving longitudinal SVID changes. Extant literature on air pollution neuroimaging studies do not support the association between late-life exposure to air pollution and MRI-measured cerebrovascular damage (Chen et al., 2015; Wilker et al., 2015, 2016; Kulick et al., 2017; Power et al., 2018), but it remains possible that PM2.5 exposures before late-life could impart adverse effects that we may have missed in the current study. Fifth, we could not completely rule out the possibility of unmeasured confounding by other environmental factors (e.g. outdoor noise; neighbourhood green space) that may be correlated with PM2.5. However, the extant epidemiologic data do not provide strong evidence for these environmental factors to accelerate episodic memory decline at the preclinical stage; therefore, their role as potential confounders is not well-established. Lastly, our findings may not be generalizable to males or younger females.
This study also had several major strengths. First, females were prospectively followed over a long period of time (∼11 years), with annual assessments of both their immediate- and delayed-recall, allowing us to examine whether of PM2.5-exposure was differentially associated with these cognitive processes. Second, we used the sophisticated parallel-process mediation SEM approach, which allowed us to examine whether PM2.5 effects level and change of episodic memory performance, while also investigating to what extent AD-PS scores may mediate this association. Third, our AD-PS scores were able to capture the spatial patterns of brain tissue atrophy more specific to Alzheimer’s disease. Lastly, the rich, comprehensive data of the geographically diverse WHIMS cohort allowed us to adjust for potential confounding by multiple covariates and address other sources of biases.
In summary, this study provided the first epidemiological evidence suggesting long-term PM2.5 exposure in late life is associated with accelerated decline of episodic memory, predominantly affecting immediate recall and new learning. Increases in neuroanatomical risk for Alzheimer’s disease associated with PM2.5 partially explained these negative associations. The adverse effects remained measurable even after excluding incident dementia, suggesting the possible continuum of PM2.5 neurotoxicity that may contribute to early decline of immediate recall and new learning abilities at the preclinical stage. Because this is the first study of its kind combining both longitudinal data on cognitive decline and a neuroanatomic risk score for Alzheimer’s disease, replication of our findings will be needed to substantiate the suggestion for continuum of air pollution neurotoxicity. Future neuroimaging studies are needed to further explore the links between episodic memory processes and altered brain structures, especially hippocampal subfields and other related neural networks, underpinning the observed association between PM2.5 and dementia risk.
See Power (doi:) for a scientific commentary on this article.
Acknowledgement
The investigators appreciate Dr Eric Whitsel for assisting in post-estimation data processing and delivering of pollution exposure data and neighborhood contextual data used in this study.
Funding
The results reported herein correspond to the specific aims of R01ES025888 from the National Institute of Environmental Health Sciences. The air pollution exposure data were derived from the R01AG033078 (PI: J-C.C.) and the AD-PS score data were generated from R21AG051113 (PI: R.C. and J-C.C.), both supported by the National Institute on Aging. This work is also supported by R01AG033078 (PI: J-C.C.) and RF1AG054068 (PI: J-C.C.). D.Y., A.J.P., X.W., M.A.E. and J-C.C. are also supported by RF1AG054068 (PI: J-C.C.). D.Y. and J-C.C are also supported by P01AG055367. Research work of D.Y. and J-C.C. are also supported by the Southern California Environmental Health Sciences Center (5P30ES007048). H.C.C. is supported by P50AG05142. R.C., M.A.E., and S.R.R. receive funding from the Wake Forest Alzheimer’s Disease Core Center (P30AG049638–01A1). S.M.R. is supported by the Intramural Research Program, National Institute on Aging, NIH. V.W.H. is supported by P50AG047366. The WHI programs is funded by the National Heart, Lung, and Blood Institute, National Institutes of Health, US Department of Health and Human Services through contracts, HHSN268201100046C, HHSN268201100001C, HHSN268201100002C, HHSN268201100003C, HHSN268201100004C and HHSN271201100004C. For a list of all the investigators who have contributed to WHI science, please visit: https://www.whi.org/researchers/Documents%20%20Write%20a%20Paper/WHI%20Investigator%20Long%20List.pdf. The Women's Health Initiative Memory Study was funded cas an ancillary study to the WHI by Wyeth Pharmaceuticals, Inc., Wake Forest University; and the National Heart, Lung, and Blood Institute, National Institutes of Health; and the National Institute of Aging, National Institutes of Health (contract number HHSN271-2011-00004C). The Women's Health Initiative Magnetic Resonance Imaging Study was funded by contract N01-WH-44221, from the National Heart, Lung, and Blood Institute.
Competing interests
The authors report no competing interests.
References
Abbreviations
- AD-PS =
Alzheimer’s disease pattern similarity
- ADNI =
Alzheimer’s Disease Neuroimaging Initiative
- CA =
cornu ammonis
- CVLT =
California Verbal Learning Test
- PM2.5 =
particulate matter with aerodynamic diameter <2.5 μm
- SEM =
structural equation model
- SVID =
small vessel ischaemic disease
- WHI =
Women’s Health Initiative
- WHIMS =
Women’s Health Initiative Memory Study
- WHIMS-MRI =
Women’s Health Initiative Memory Study of Magnetic Resonance Imaging
- WHISCA =
Women’s Health Initiative Study of Cognitive Aging
Author notes
Diana Younan and Andrew J. Petkus contributed equally to this work.


