


 https://orcid.org/0000-0001-9995-7870

Abstract
Essential tremor is one of the most common movement disorders. Despite its high prevalence and heritability, the genetic aetiology of essential tremor remains elusive. Up to now, only a few genes/loci have been identified, but these genes have not been replicated in other essential tremor families or cohorts. Here we report a genetic study in a cohort of 197 Chinese pedigrees clinically diagnosed with essential tremor. Using a comprehensive strategy combining linkage analysis, whole-exome sequencing, long-read whole-genome sequencing, repeat-primed polymerase chain reaction and GC-rich polymerase chain reaction, we identified an abnormal GGC repeat expansion in the 5′ region of the NOTCH2NLC gene that co-segregated with disease in 11 essential tremor families (5.58%) from our cohort. Clinically, probands that had an abnormal GGC repeat expansion were found to have more severe tremor phenotypes, lower activities of daily living ability. Obvious genetic anticipation was also detected in these 11 essential tremor-positive families. These results indicate that abnormal GGC repeat expansion in the 5′ region of NOTCH2NLC gene is associated with essential tremor, and provide strong evidence that essential tremor is a family of diseases with high clinical and genetic heterogeneities.
Introduction
Essential tremor (ET) is one of the most common adult-onset movement disorders, affecting 0.9% of the population across all ages worldwide (Louis and Ferreira, 2010). The prevalence of ET increases dramatically with age: at age 65 or older, 4.6% of individuals are affected, and at age 95 or older, 20% of individuals are affected (Dogu et al., 2003; Benito-Leon et al., 2005; Louis and Ferreira, 2010). The most recognizable clinical feature of ET is a 4–12 Hz kinetic tremor of the arms, usually occurring during a variety of voluntary movements (Elble et al., 1994; Louis et al., 2013). A bilateral postural tremor is often seen in ET patients as well. Other parts of the body including head, face, tongue, trunk or lower limbs are less commonly involved (Deuschl and Elble, 2009). ET is a chronic and progressive disease. Typical ET patients exhibit no neurological abnormalities other than tremor; however, some patients may present with tremor along with other motor and non-motor manifestations, such as parkinsonism (Thenganatt and Jankovic, 2016), ataxia (Benito-Leon and Labiano-Fontcuberta, 2016), dystonia (Jankovic, 2002), sensory abnormalities (Ondo et al., 2003), cognitive impairments (Louis et al., 2010) and psychiatric symptoms (Benito-Leon and Labiano-Fontcuberta, 2016; Chunling and Zheng, 2016; Hopfner et al., 2016; Thenganatt and Jankovic, 2016).
Because more than half of ET subjects have a positive family history, genetic factors are generally considered to be a strong contributor to the disease aetiology; although exact causes of ET are yet to be explained (Louis and Dogu, 2007; Clark and Louis, 2018; Hopfner and Helmich, 2018). There are numerous reports of large ET pedigrees, and in many cases the inheritance pattern appears to be Mendelian autosomal-dominant (Findley, 2000; Tanner et al., 2001; Lorenz et al., 2004; Tio and Tan, 2016). Genome-wide linkage studies have mapped three loci to chromosomal locations in ET families, which are located at 3q13 (ETM1; OMIM: 190300) (Gulcher et al., 1997), 2p22-p25 (ETM2; OMIM: 602134) (Higgins et al., 1997), and 6p23 (ETM3; OMIM: 611456) (Shatunov et al., 2006). Several additional genetic loci are also likely (Abbruzzese et al., 2001; Kovach et al., 2001; Hicks et al., 2016). However, these candidate regions have not been replicated in other ET families and no genes in these regions have been shown to be correlated with ET phenotypes thus far. A whole-exome sequencing (WES) approach, proven successful in identifying causal variants for many Mendelian disorders, has been recently used to analyse some ET families of various populations. Several different genes have been identified (e.g. FUS, HTRA2, and TENM4) (Merner et al., 2012; Unal Gulsuner et al., 2014; Hor et al., 2015; Liu et al., 2016), but no specific gene has been confirmed in additional ET families or cohorts (Tio and Tan, 2016). In addition, genome wide association studies (GWAS) have reported that common variants in LINGO1 and SLC1A2 may be linked to ET (Stefansson et al., 2009; Thier et al., 2012). Recently, another GWAS study based on a European population has identified three new susceptibility loci (STK32B, PPARGC1A and CTNNA3) found to be associated with ET (Muller et al., 2016). However, whether these gene candidates or loci play a causative role in the pathogenesis of ET remains unclear, indicating the need for investigation of potentially more complex inheritance patterns and genetic architecture.
Utilizing a comprehensive strategy that combines linkage analysis, WES analysis, long-read whole-genome sequencing (LRS), repeat-primed PCR (RP-PCR) and GC-rich PCR (GC-PCR), we have identified an abnormal GGC repeat expansion in the 5′ region of the NOTCH2NLC gene that co-segregates with disease in 11 of 197 (5.58%) ET pedigrees of Chinese origin that we have identified. The results show that expansion of GGC repeat in human-specific NOTCH2NLC gene is associated with ET.
Materials and methods
Subjects
A total of 197 ET pedigrees from mainland China were enrolled from 2013 to 2018 in the National Clinical Research Center for Geriatric Disorders, Xiangya Hospital, Central South University, and probands and other affected family members were subjected to a thorough neurological examination by at least two experienced neurologists. The diagnosis of ET was made according to the guidelines of the Consensus Statement of the Movement Disorders Society (Deuschl et al., 1998). In addition, 1305 unaffected individuals matched for age and geography were recruited from the medical examination centre of Xiangya Hospital as the healthy control subjects. After obtaining written informed consent, peripheral blood samples were collected from all participants. Genomic DNA was extracted from peripheral blood leucocytes via standard methods. All probands of ET pedigrees underwent brain MRI or CT examination and subjects with any of the following known mutations were excluded: any of the 11 spinocerebellar ataxia (SCA) dynamic mutations [SCA 1, 2, 3, 6, 7, 8, 10, 12, 17, dentatorubral and pallidoluysian atrophy (DRPLA), Friedreich ataxia (FRDA)] and FMR1 premutation for fragile X-associated tremor/ataxia syndrome (FXTAS). This study was approved by the Ethics Committee of Xiangya Hospital of Central South University in China.
Linkage analysis and haplotype analysis
Whole genome single nucleotide polymorphism (SNP) scanning on genomic DNA of selected samples from two ET pedigrees (Families 1 and 2) was performed using the Illumina Asian Screening Array according to the manufacturer’s recommendations. Genomestudio (version 2011) was used to extract information on SNPs. Linkage analysis was performed in Merlin with a parametric model assuming an autosomal-dominant mode of inheritance, and a disease-allele frequency of 0.001 with 90% penetrance. Haplotype analysis was also performed in the two ET pedigrees (Families 1 and 2) using SNPs.
Whole-exome sequencing
Whole-exome capture by SureSelect Human All Exon V6 (Agilent) and high-throughput sequencing by NovaSeq 6000 System (Illumina Inc.) were conducted in four affected members (Family 1: Patients III 2 and III 10; Family 2: Patients II 4 and III 5). Sequencing data passing quality control was subjected to a computational pipeline for data processing and analysis with human genome build hg38 as reference that included Burrows-Wheeler Alignment-Maximum Exact Matches (BWA-MEM, v.0.7.17-r1188) for read mapping. Genome Analysis Tool Kit (GATK, v.4.0.4.0) was used for single nucleotide variants and insertion and deletion (indels) calling, and ANNOVAR was used for variant annotation. We focused on the shared loss-of-function variants or predicted deleterious missense variants with minor allele frequency <0.001 in each family. The loss-of-function variants include nonsense, splicing site single nucleotide variants and frameshift indels. The deleterious missense variants were predicted by ReVe from VarCards, a program recently developed by our group (Li et al., 2018, 2019).
Long-read genome sequencing
LRS was first done on the four affected individuals who underwent WES (Family 1: Patients III 2 and III 10; Family 2: Patients II 4 and III 5), and this was performed on the Oxford Nanopore platform with ∼15× coverage. Then, additional 13 patients (Patients F1-III 6, F2-II 2, F3-III 9, F4-III 9, F6-II 4, F6-II 8, F6-II 11, F7-II 1, F8-II 1, F9-II 1, F10-II 1, F11-II 3 and F11-II 5) were also sequenced by LRS on the same platform. Genomic DNA was extracted and large insert-size libraries were created according to the manufacturer recommended protocols (Oxford Nanopore). Libraries were sequenced on R9.4.1 flow cells using PromethION. NGMLR and Sniffles were used to analyse structural variations (Sedlazeck et al., 2018). All reads were aligned to the human reference genome (hg38) using NGMLR (ngmlr 0.2.6), and structural variation calls were detected by Sniffles. Candidate structural variations were subjected to manual examination and further validation. The short tandem repeat (STR) expansion in the target region was analysed by RepeatHMM and inScan.
Repeat-primed PCR and repeat size determination
The repeat sequence was amplified by repeat-primed PCR (RP-PCR) with a FAM-labelled gene specific primer (5′CCTCAGCCCGATACTCACCAT) and a repeat-containing primer [TACCAATACGCATCCCGCGATTTGTCTTA(CGG)5]. For repeat size determination, GC-rich PCR (GC-PCR) was used with a FAM-labelled forward primer (5′-AGCGCCAGGGCCTGAGCCTTTGAAGCAG) and a reverse primer (5′-TCGCCCCAGGTGGCAGCCCCGGGCGCCGCGGAC). PCR amplification and processing were performed as described previously (Tian et al., 2019). GeneScan 1000 ROX Size Standard (Applied Biosystems) was used to calculate allele sizes. For the determination of GGC repeats, when the number of repeats was <200, the size of PCR products were determined using the ABI 3500xL (Applied Biosystems), and then compared with the PCR products of known FMR1 (MIM: 309550) premutation CGG repeat alleles of various sizes. In addition, as needed, an Agilent 2100 was used to determine the size of GGC repeats >200.
Skin biopsy, immunohistochemistry, and electron microscopic study
After local anaesthesia, a 5-mm diameter biopsy specimen was obtained at 10 cm above the lateral malleolus for a subset of study subjects. Specimens were fixed in 10% formalin, embedded in paraffin, sectioned at 6-mm thickness and were stained by haematoxylin and eosin. Immunohistochemical analysis was performed using anti-ubiquitin (3936; Cell Signaling) and anti-p62 (610833; BD Biosciences) antibodies. Images were acquired by deconvolution digital microscope (Axioplan 2, Carl Zeiss). Samples for electron microscopic study were prepared as described previously (Tian et al., 2019), and then were examined and photographed on a Hitachi HT-7700 electron microscope.
Statistical analyses
Statistical data were divided into numerical variables and categorical variables. Numerical variables were presented as mean and standard deviation. For comparison on continuous variables, a t-test was used, and for comparison of categorical variables, a χ2 test was used. P < 0.05 was defined to be statistically significant. All statistics were performed using software SPSS for Windows, version 22.0 (SPSS Inc, Chicago, USA).
Data availability
The data that support the findings of this study are available from the corresponding author, upon reasonable request.
Results
Linkage analysis identified the candidate region
Linkage analysis performed in two ET pedigrees (Families 1 and 2) identified a maximum logarithm of odds (LOD) score of 2.486 on chromosome 1 (Fig. 1A and B), a 54.70 Mb region between rs17679376 and rs7553072 at 1p13.3-q23.3 (chr1:110448567–165147184), which contains 504 genes. Haplotype analysis in the two families revealed the minimum candidate region flanked by rs138960450 and rs10888499 (Supplementary Fig. 1).
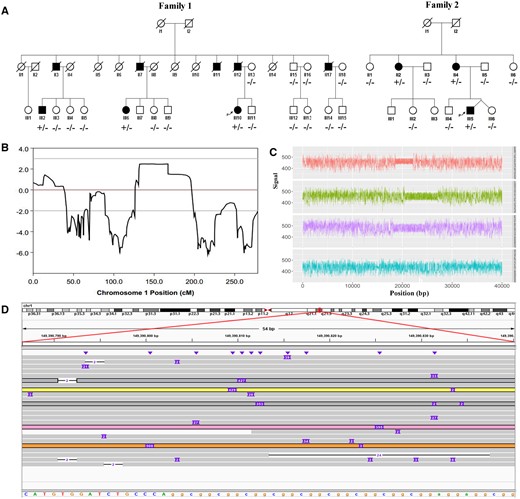
Identification of expanded GGC Repeat within 5′ region of the NOTCH2NLC gene in two ET families. (A) Pedigrees of two ET families (Families 1 and 2) and corresponding individual genotypes. (B) Genetic linkage analysis indicated the maximum logarithm of odds (LOD) score 2.486 in chromosome 1, a 54.70-Mb region between rs17679376 and rs7553072 at 1p13.3-q23.3 (chr1:110448567–165147184). (C and D) Abnormal GGC repeat expansions in the 5′ region of NOTCH2NLC gene detected by LRS on the four affected individuals (Family 1: Patients III 2 and III 10; Family 2: Patients II 4 and III 5) using the Oxford Nanopore platform. (C) Representative Nanopore electric signals indicating abnormal repeat expansions in three lanes compared to the normal allele seen in the fourth lane. (D) Integrative Genomics Viewer for subject Family 1: III10 revealed that five reads were determined to carry the ‘insertion’ variation (chr1:149390802–149390842, hg38 version), corresponding to the GGC triplet expansion in the 5′ region of the NOTCH2NLC gene.
Whole exome sequencing failed to detect any causal mutation
To determine the genetic aetiology of the two ET pedigrees, we performed WES on four affected individuals (Family 1: Patients III 2 and III 10; Family 2: Patients II 4 and III 5) (Fig. 1A). After quality control and data cleaning, we obtained 13.08 GB of clean data with an average sequencing depth read >100× (Supplementary Table 1). On average, 99.14% and 63.09% of the clean data were able to be mapped to the reference genome and whole exome regions, respectively (Supplementary Table 2). However, no candidate mutation was found in the linked region, and no potential disease-causing mutations were identified using standard variant filtering and analysis pipelines.
Long-read sequencing identified a GGC repeat expansion within the NOTCH2NLC gene
To determine whether a structural variant might play a pathogenic role in the two pedigrees, we next carried out the LRS on the same four affected individuals (Family 1: Patients III 2 and III 10; Family 2: Patients II 4 and III 5) using the Oxford Nanopore platform. The average read length was >10 kb. Using our analysis strategy, we did not detect any common structural variants, such as insertions, deletions, inversions, or translocations in the linkage region. Therefore, we next focused on possible STR expansions by using RepeatHMM and inScan to detect STR variations in the target region. We identified an insertion fragment for an STR region (GGC, chr1:149390802-149390842) that was seen in at least one supporting read among all four affected individuals (Fig. 1C). We next manually inspected the reads covering this region. The characteristic repeat expansion region is covered by 5 of 24 total reads (Fig. 1D). The repeat expansion in all expanded alleles was mainly a ‘GGC’ repeat, located in the 5′ region of NOTCH2NLC gene.
Expanded GGC repeat is associated with essential tremor
To confirm the repeat expansion and determine the repeat size, repeat-primed PCR (RP-PCR) and GC-rich PCR (GC-PCR) assays were performed in both affected individuals and normal controls. Our RP-PCR analysis confirmed the expanded GGC repeat among the affected family members in Families 1 and 2. All affected individuals in the two families showed similar peak patterns using RP-PCR, indicating the presence of expanded GGC repeats (Fig. 2A), while unaffected members of the two pedigrees carried only normal repeats (Fig. 2C). We then determined the repeat size using GC-PCR and found that all the affected individuals from these two pedigrees carry alleles ranging from 81 to 138, with an average of 108.67 ± 22.24 GGC repeats (Fig. 2B). The GGC repeat sizes of all unaffected members from the two pedigrees ranged from 7 to 23, with an average of 14.60 ± 4.28 repeats (Fig. 2D). Among the 1305 healthy controls that we examined, the GGC repeat sizes ranged from 4 to 41, with an average of 16.19 ± 5.21 repeats (Fig. 2E).
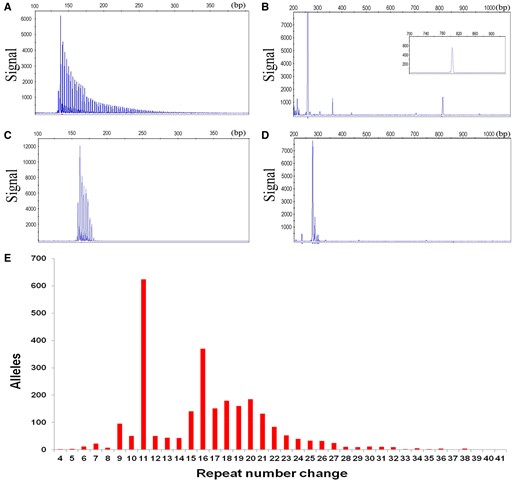
Validation of GGC repeat expansion and repeat size determination by RP-PCR and GC-PCR assays. RP-PCR (A) and GC-PCR assays (B) of one patient revealed abnormal repeat expansions. RP-PCR (C) and GC-PCR assays (D) of one unaffected member showed no repeat expansions. (E) GGC repeat sizes among 1305 healthy controls ranged from 4 to 41, with an average of 16.19 ± 5.21 repeats.
To understand the impact of the GGC repeat expansion in other ET patients, we examined 195 additional ET families by RP-PCR and GC-PCR assays. Intriguingly, we found that nine other families (Families 3–11) also carried expanded GGC repeats >60 (Supplementary Fig. 2). Among these families, 13 patients (Patients F1-III 6, F2-II 2, F3-III 9, F4-III 9, F6-II 4, F6-II 8, F6-II 11, F7-II 1, F8-II 1, F9-II 1, F10-II 1, F11-II 3 and F11-II 5) were further confirmed by LRS (Supplementary Table 3). The GGC repeat sizes of patients from the 11 families ranged from 60 to 250, with an average of 117.75 ± 44.96 repeats (Table 1). All unaffected members of the 11 pedigrees carried normal repeats, ranging from 6 to 23, with an average of 14.36 ± 4.73 repeats. Together, these results suggest that GGC repeat expansion is indeed associated with ET.
Comparison of age at onset and GGC repeats between expansion (+) ET and NIID
| ET | NIID | NIID-M | NIID-D | NIID-P | Pa | Pb | Pc | Pd | |
|---|---|---|---|---|---|---|---|---|---|
| n | 27 | 40 | 15 | 16 | 9 | Null | Null | Null | Null |
| Sex, female, n (%) | 13 (48.14) | 14 (35.00) | 3 (20.00) | 10 (62.50) | 1 (11.11) | 0.170 | 0.044* | 0.497 | 0.051 |
| Age, years | 58.50 ± 15.79 | 63.00 ± 12.69 | 52.21 ± 11.38 | 70.44 ± 8.11 | 66.56 ± 10.16 | 0.241 | 0.212 | 0.006** | 0.173 |
| Age at onset, years | 45.85 ± 14.48 | 50.54 ± 14.89 | 35.57 ± 7.12 | 58.10 ± 9.94 | 60.56 ± 13.00 | 0.253 | 0.010** | 0.007** | 0.015* |
| GGC repeats sizes | 117.75 ± 44.96 | 188.00 ± 114.68 | 272.31 ± 106.93 | 129.00 ± 71.04 | 83.00 ± 43.39 | 0.004** | 0.0001** | 0.250 | 0.316 |
NIID-D/M/P = the dementia/muscle weakness/parkinsonism-dominant type of NIID.
P-values are shown as: aET versus NIID; bET versus NIID-M; cET versus NIID-D; dET versus NIID-P. *P < 0.05, **P < 0.01.
Comparison of the GGC repeat expansion between essential tremor and neuronal intranuclear inclusion disease
To clarify the differences of GGC repeat expansion between ET and neuronal intranuclear inclusion disease (NIID), another rare and neurodegenerative disease caused by the GGC repeat expansion in NOTCH2NLC gene, we compared the age at onset, GGC repeat sizes and repeat interruptions between ET and NIID (data for NIID are derived from Tian et al., 2019). There was no significant difference in age at onset between ET and NIID (45.85 ± 14.48 years versus 50.54±14.89 years, P = 0.253) (Table 1). Then we compared the age at onset between ET and three NIID subgroups respectively (NIID-M subgroup (muscle weakness-dominant type), NIID-D subgroup (dementia-dominant type), NIID-P subgroup (parkinsonism-dominant type). Intriguingly, we found that the age at onset in ET group was significantly higher than that of the NIID-M subgroup (45.85±14.48 years versus 35.57±7.12 years, P = 0.010) and lower than those of the NIID-D subgroup (45.85±14.48 years versus 58.10±9.94 years, P = 0.007) and the NIID-P subgroup (45.85 ± 14.48 years versus 60.56 ± 13.00 years, P = 0.015) (Table 1).
The GGC repeat sizes in the ET group were significantly less than those of the NIID group (117.75 ± 44.96 versus 188.00 ± 114.68, P = 0.004) (Table 1). As for the comparison between ET and the three NIID subgroups, we found the GGC repeat sizes in the ET group were significantly less than those of the NIID-M subgroup (117.75 ± 44.96 versus 272.31 ± 106.93, P = 0.0001) (Table 1). There were no significant differences in GGC repeat sizes between the ET and NIID-D or NIID-P subgroups (Table 1).
In addition to GGC repeats, there are mainly two forms of repeat interruptions, including GGA and AGC, in both ET and NIID patients (Table 2 and Supplementary Table 3). We compared the frequencies of GGC repeats and repeat interruptions between 17 ET and 17 NIID cases, and found that the frequency of GGC in ET was significantly higher than that of NIID (0.810 ± 0.071 versus 0.640 ± 0.170, P = 0.0001) (Table 2 and Supplementary Fig. 3). The frequency of GGA interruptions in ET was significantly less than that of NIID (0.048 ± 0.022 versus 0.120 ± 0.088, P = 0.007), especially the NIID-M subgroup (0.048 ± 0.022 versus 0.160 ± 0.086, P = 0.0001) (Table 2 and Supplementary Fig. 3).
Comparison of frequencies of GGC repeats and repeat interruptions between 17 expansion (+) ET patients and 17 familial NIID patients by LRS
| ET | NIID | NIID-M | NIID-D | NIID-P | Pa | Pb | Pc | Pd | |
|---|---|---|---|---|---|---|---|---|---|
| n | 17 | 17 | 11 | 4 | 2 | Null | Null | Null | Null |
| GGC | 0.810 ± 0.071 | 0.640 ± 0.170 | 0.630 ± 0.190 | 0.610 ± 0.130 | 0.770 ± 0.110 | 0.0001** | 0.0001** | 0.006** | 0.57 |
| GGA | 0.048 ± 0.022 | 0.120 ± 0.088 | 0.160 ± 0.086 | 0.074 ± 0.040 | 0.028 ± 0.039 | 0.007** | 0.0001** | 0.28 | 0.49 |
| AGC | 0.033 ± 0.035 | 0.081 ± 0.080 | 0.061 ± 0.058 | 0.120 ± 0.140 | 0.110 ± 0.029 | 0.095 | 0.24 | 0.47 | 0.047* |
| Others | 0.100 ± 0.043 | 0.150 ± 0.160 | 0.150 ± 0.170 | 0.200 ± 0.180 | 0.091 ± 0.041 | 0.96 | 0.65 | 0.36 | 0.75 |
NIID-D/M/P = the dementia/muscle weakness/parkinsonism-dominant type of NIID.
P-values are shown as: aET versus NIID; bET versus NIID-M; cET versus NIID-D; dET versus NIID-P. *P < 0.05, **P < 0.01.
Clinical characteristics of genetically-positive essential tremor families and all probands
Eleven ET families with an autosomal dominant inheritance pattern were identified as carrying the abnormal GGC repeat expansions. Clinically, 27 patients from the 11 families presented with simple kinetic and/or postural tremor, without cognitive impairment, peripheral neuropathy, cerebellar ataxia, hypermyotonia. We compared the clinical features and GGC repeat sizes between the parental generations and younger generations from the 11 families (Table 3). There were no significant differences in severities of tremor [Tremor Essential Tremor Rating Assessment Scale (TETRAS-I)], activities of daily living ability (TETRAS-II), and GGC repeat sizes between the two groups (Table 3). Interestingly, the mean age at onset in the younger generations of the 11 pedigrees was statistically lower than that of the parents (38.45 ± 13.37 versus 54.89 ± 10.37 years, P = 0.007) (Table 3), indicating significant genetic anticipation in these 11 families.
Clinical features and GGC repeat sizes of 27 patients from 11 ET families
| Parental generations | Younger generations | P | |
|---|---|---|---|
| n | 10 | 17 | Null |
| Age, years | 66.33 ± 11.34 | 52.09 ± 16.45 | 0.041* |
| Sex, female, n (%) | 4 (40) | 9 (52.94) | 0.695 |
| Age at onset, years | 54.89 ± 10.37 | 38.45 ± 13.37 | 0.007** |
| Duration, years | 9.75 ± 3.11 | 21.82 ± 16.06 | 0.033* |
| TETRAS-I | 24.14 ± 8.76 | 26.30 ± 15.75 | 0.748 |
| TETRAS-II | 19.86 ± 14.39 | 22.00 ± 18.01 | 0.798 |
| GGC repeats sizes (range) | 116.43 ± 61.68 (68–250) | 118.78 ± 30.55 (60–170) | 0.922 |
P < 0.05, **P < 0.01.
TETRAS = Tremor Essential Tremor Rating Assessment Scale.
We further summarized the clinical data of 197 probands in our ET cohort, and compared the manifestations between 11 genetically positive probands [expansion (+)] and 186 genetically negative probands [expansion (−)] (Table 4). The 197 probands were predominantly female (55.84%) with typical education levels (10.62 ± 4.87 years) and an average age of 52.78 ± 15.60 years. There were no significant differences in age, sex, age at onset, duration time, education, or BMI between the expansion (+) group and expansion (−) group. The possibilities of tremor involving upper limbs, head, lower limbs and trunk were not different between the two groups; however, voice tremors were more likely in subjects from the expansion (+) group (P = 0.011). Few probands presented with other neurological symptoms such as cognitive impairment, frequent urination, hypermyotonia, ataxia, pyramidal signs, peripheral neuropathy and paroxysmal loss of consciousness. No severe brain leukodystrophy and cerebellar atrophy were found in the MRI examination of any probands (Fig. 3A and B). TETRAS I and TETRAS II scores of the expansion (+) group were significantly higher than those of expansion (−) group, indicating that expansion (+) patients experienced more severe tremor phenotypes and lower activities of daily living ability. Four probands underwent skin biopsies, and eosinophilic intranuclear inclusions immunoreactive to anti-ubiquitin and anti-p62 antibodies in fibroblasts and sweat gland cells were detected in all three probands with expanded GGC repeats (Fig. 3E–L). The proband without expanded GGC repeats was negative for the skin biopsy test.
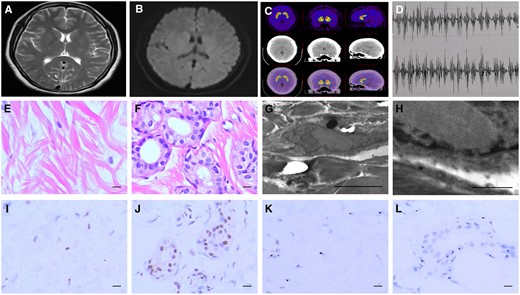
Representative brain MRI and PET images, surface EMG, and skin pathological features of ET pedigree proband with expanded GGC repeats (Family 2: III 5). (A) T2-weighted image and (B) Diffusion-weighted imaging showed no brain leukodystrophy and cerebellar atrophy. (C) 11C-CFT PET images showed no abnormalities in DAT binding in both putamen and the caudate nucleus. (D) Surface EMG showed a 9 Hz postural tremor in right forearm. (E and F) Representative images showing eosinophilic intranuclear inclusions in fibroblasts (E) and sweat gland cells (F). Scale bars = 10 μm. (G) Representative electron microscopy imaging revealed intranuclear inclusions. Scale bar = 5 μm. (H) Enlarged image of intranuclear inclusion in (G). Scale bar = 1 μm. (I–L) Representative images show ubiquitin-positive intranuclear inclusions in fibroblasts (I) and sweat gland cells (J), as well as p62-positive intranuclear inclusions in fibroblasts (K) and sweat gland cells (L). Scale bars = 10 μm.
Discussion
Despite the high prevalence and heritability of ET, only a handful of susceptibility genes have been identified, and these identified genes have not been replicated in other ET cohorts thus far (Tio and Tan, 2016). Contributing factors to this disparity could be a lack of stringent diagnostic criteria, the lack of pathological definition or defining biomarkers, a high phenocopy rate and the high clinical heterogeneity in ET (Bergareche et al., 2015; Hopfner et al., 2016; Tio and Tan, 2016). Clearly, a more complex mode of inheritance and genetic architecture such as long repetitive elements or copy number alterations cannot be discounted and must be considered (Clark and Louis, 2018). Recent findings of the pentanucleotide ATTTC repeat insertion in the 5′ UTR introns of DAB1 as the cause of SCA37 (Seixas et al., 2017) and the intronic pentanucleotide repeat expansion in the SAMD12 gene as the causative mutation in familial cortical myoclonic tremor with epilepsy (FCMTE) (Cen et al., 2018; Ishiura et al., 2018; Zeng et al., 2019), suggest that repeat expansions could contribute to the genetic causes of these Mendelian disorders for which detection by conventional short-read sequencing has failed.
In this study, we failed to detect any potential disease-causing mutations for the two Chinese ET pedigrees (Families 1 and 2) through linkage analysis and whole-exome sequencing in the target region 1p13.3-q23.3. Then the long-read whole-genome sequencing (LRS) identified an abnormal GGC repeat expansion in the 5′ region of NOTCH2NLC gene. The sequencing data were further confirmed by RP-PCR and GC-PCR. One hundred and ninety-five additional ET families were examined. Finally, we identified abnormal GGC repeat expansions co-segregated with disease in 11 ET pedigrees from mainland China (5.58% of this cohort), suggesting that abnormal expansion of GGC repeat in NOTCH2NLC gene is the genetic cause of ET in the 11 families.
Historically, ET was commonly considered to be a monosymptomatic disorder with a mild, non-progressive course, and hence the original term ‘benign essential tremor’ was coined (Clark and Louis, 2018). In more recent years, numerous clinical, pathological, and neuroimaging findings have challenged this view of the disease (Bermejo-Pareja, 2011; Louis and Okun, 2011; Louis, 2018). Apart from kinetic and/or postural tremor, a series of clinical features, including motor and non-motor manifestations, have also been detected in ET (Jankovic, 2002; Ondo et al., 2003; Benito-Leon and Labiano-Fontcuberta, 2016; Chunling and Zheng, 2016; Thenganatt and Jankovic, 2016). Pathologically, it is still controversial whether there is neurodegeneration of the cerebellum in the pathogenesis of ET (Louis, 2016; Samson and Claassen, 2017). For ET treatment, the obvious pharmacological response heterogeneity has often been observed in clinical practice (Louis, 2014b). Emerging evidence has led to the idea that ET may not be a single disease, but a family of diseases (Louis, 2014a; Clark and Louis, 2018; Hopfner and Deuschl, 2018). In our ET cohort, probands with a GGC repeat expansion experienced more severe tremor phenotypes, lower activities of daily living ability. Our results suggest that although the genetic cause for ∼5.58% of our pedigrees can be explained by this repeat expansion, there are obviously other subsets of patients in our ET cohort for which further exploration is needed to identify the genetic loci responsible.
Recently, the expanded GGC repeat within NOTCH2NLC has been identified as the probable pathogenic genetic cause of NIID (Ishiura et al., 2019; Sone et al., 2019; Tian et al., 2019), a rare and progressive neurodegenerative disease with highly variable clinical manifestations, the most prominent among them being dementia and peripheral neuropathy (Kimber et al., 1998; Sone et al., 2016). Pathologically, NIID is characterized by eosinophilic hyaline neuronal and glial intranuclear inclusions immunoreactive to anti-ubiquitin and anti-p62 antibodies in the central and peripheral nervous systems (Takahashi-Fujigasaki, 2003; Sone et al., 2016). This kind of intranuclear inclusion can also be detected in a proportion of adipocytes, fibroblasts, and sweat gland cells in skin samples of NIID patients (Sone et al., 2011). Thus, skin biopsy is considered to be an effective and less invasive diagnostic tool for NIID. The symmetrical high signals in corticomedullary junctions on diffusion-weighted imaging (DWI) is also a neuroimaging feature of NIID (Sugiyama et al., 2017).
In this report, we identified the abnormal GGC repeat expansion in the 5′ region of NOTCH2NLC gene co-segregated with disease in 11 clinically diagnosed ET families, and eosinophilic intranuclear inclusions were detected to be positive in skin biopsies of three genetically positive probands. Obviously, a reasonable next step would be whether to ask these subjects that have been clinically diagnosed with ET are actually NIID; or whether the kinetic and/or postural tremors are only a phenotype of NIID. For the patients from genetically positive families in our cohort, they each had a long course of disease with nearly half of them having more than 10 years of disease duration. However, these patients presented with simple kinetic and/or postural tremor, without cognitive impairment, autonomic dysfunction, cerebellar ataxia, hypermyotonia, pyramidal signs, paroxysmal loss of consciousness, during our follow-up. Brain MRI and EMG examination also revealed no severe brain leukodystrophy, cerebellar atrophy or peripheral neuropathy for the probands with repeat expansions. Therefore, these genetically positive families should be clinically diagnosed as ET. Neuropathologically, p62- and ubiquitin-positive neuronal intranuclear inclusions have also been detected in brains of FXTAS (Gelpi et al., 2017) and C9orf72-linked frontotemporal lobar degeneration (FTLD) and motor neuron disease/amyotrophic lateral sclerosis (MND/ALS) patients (Al-Sarraj et al., 2011). Intriguingly, both of these disorders, like NIID, are genetically caused by repeat expansions located in non-coding regions. Because we do not currently have post-mortem histopathological information for the genetically positive patients from our cohort, we cannot rule out a definitive diagnosis of NIID for these subjects that have clinically presented with ET. A longer follow-up with comprehensive clinical and pathological examinations may clarify this uncertainty.
The mechanism by which the abnormal GGC repeat expansion in the NOTCH2NLC gene causes these different phenotypes remains elusive. Whether GGC repeat sizes and different repeat interruptions play important roles among these phenotypes are still not clear. Inspired by the striking similarity of NIID and fragile X-associated disorders, we compared the age at onset, GGC repeat sizes and repeat interruptions between ET and NIID. Intriguingly, the findings that there were significant differences in age at onset, GGC repeat sizes and repeated interruptions between ET and NIID further support the assumption and demonstrate the high complexity and heterogeneity of NOTCH2NLC-related disorders.
In summary, we identified an abnormal GGC repeat expansion in the 5′ region of NOTCH2NLC gene in affected individuals from 11 Chinese pedigrees that have been clinically diagnosed with ET. Our study provides strong evidence that ET may be a family of diseases with high clinical, genetic and pathological heterogeneities, and provides a clue for exploring the different mechanisms underlying the disease. Further studies with longitudinal large case-control and familial ET cohorts are needed.
Web resources
Online Mendelian Inheritance in Man (OMIM), https://omim.org/
GenBank, https://www.ncbi.nlm.nih.gov/genbank/
GnomAD, https://gnomad.broadinstitute.org/
UCSC Browser, http://genome.ucsc.edu
Genomestudio (v.2011.1), https://support.illumina.com/array/array_software/genomestudio/downloads.html
MERLIN (V.1.1.2), http://csg.sph.umich.edu/abecasis/Merlin/download/
RepeatHMM, https://github.com/WGLab/RepeatHMM
inScan, https://github.com/Nextomics/inScan
Clinical characteristics of probands with/without expanded GGC repeats
| All probands | Expansion (+) | Expansion (−) | P | |
|---|---|---|---|---|
| n | 197 | 11 | 186 | Null |
| Age, years | 52.78 ± 15.60 | 54.64 ± 14.56 | 52.61 ± 15.74 | 0.682 |
| Sex, female, n (%) | 110 (55.84) | 7 (63.64) | 103 (55.38) | 0.43 |
| Age at onset, years | 43.17 ± 16.61 | 42.55 ± 13.79 | 43.23 ± 16.89 | 0.896 |
| Duration, years | 9.96 ± 8.89 | 10.91 ± 9.32 | 9.42 ± 8.18 | 0.146 |
| Education, years | 10.62 ± 4.87 | 8.67 ± 6.56 | 10.76 ± 4.72 | 0.214 |
| BMI | 22.73 ± 2.97 | 21.27 ± 2.02 | 22.83 ± 3.01 | 0.152 |
| Tremor, n (%) | ||||
| Upper limbs, n (%) | 187 (94.92) | 11 (100.00) | 176 (94.62) | Null |
| Head, n (%) | 74 (37.56) | 6 (54.55) | 67 (36.02) | 0.418 |
| Voice, n (%) | 24 (12.18) | 5 (45.45) | 19 (10.22) | 0.011* |
| Lower limbs, n (%) | 62 (31.47) | 2 (18.18) | 60 (32.26) | 0.327 |
| Trunk, n (%) | 6 (3.05) | 2 (18.18) | 4 (2.15) | 0.307 |
| Frequent urination, n (%) | 3 (1.52) | 0 (0.00) | 3 (1.63) | 0.497 |
| Cognitive impairment, n (%) | 0 (0.00) | 0 (0.00) | 0 (0.00) | Null |
| Hypermyotonia, n (%) | 0 (0.00) | 0 (0.00) | 0 (0.00) | Null |
| Ataxia, n (%) | 0 (0.00) | 0 (0.00) | 0 (0.00) | Null |
| Pyramidal signs, n (%) | 0 (0.00) | 0 (0.00) | 0 (0.00) | Null |
| Peripheral neuropathy, n (%) | 0 (0.00) | 0 (0.00) | 0 (0.00) | Null |
| Paroxysmal loss of consciousness, n (%) | 0 (0.00) | 0 (0.00) | 0 (0.00) | Null |
| TETRAS-I | 16.36 ± 9.48 | 34.69 ± 16.86 | 15.16 ± 7.47 | 0.013* |
| TETRAS-II | 12.45 ± 11.06 | 32.50 ± 17.65 | 11.13 ± 9.16 | 0.011* |
| MMSE | 27.57 ± 2.35 | 26.88 ± 2.60 | 27.69 ± 2.30 | 0.238 |
| MRI, n (%) | ||||
| Severe leukodystrophy, n (%) | 0 (0.00) | 0 (0.00) | 0 (0.00) | Null |
| Cerebellar atrophy, n (%) | 0 (0.00) | 0 (0.00) | 0 (0.00) | Null |
| EMG (+) | 0 (0.00) | 0 (0.00) | 0 (0.00) | Null |
| Skin biopsy (+), n (%) | 3/4 (75.00) | 3/3 (100) | 0/1 (0.00) | Null |
| GGC repeats sizes (range) | 31.37 ± 37.54 (6–170) | 117.78 ± 29.61 (60–170) | 18.83 ± 5.63 (6–37) | 0.001** |
P < 0.05, **P < 0.01.
BMI = body mass index; DBS = deep brain stimulation; MMSE = Mini-Mental State Examination; TETRAS = Tremor Essential Tremor Rating Assessment Scale.
See Westenberger and Klein (doi:) for a scientific commentary on this article.
Acknowledgements
We are indebted to the pedigrees members for their generous participation in this study.
Funding
This work was funded by National Natural Sciences Foundation of China (Grant 81430023), National Key Plan for Scientific Research and Development of China (Grants 2016YFC1306000 and 2017YFC0909100) and National Key R&D Program of China (Grant 2018YPC1312003).
Competing interests
The authors report no competing interests.
References
Abbreviations
- ET =
essential tremor
- GC/RP-PCR =
GC/repeat primed polymerase chain reaction
- LRS =
long-read genome sequencing
- NIID =
neuronal intranuclear inclusion disease
Author notes
Qi-Ying Sun and Qian Xu contributed equally to this work.


