


Abstract
Speech disorders are highly prevalent in the preschool years, but frequently resolve. The neurobiological basis of the most persistent and severe form, apraxia of speech, remains elusive. Current neuroanatomical models of speech processing in adults propose two parallel streams. The dorsal stream is involved in sound to motor speech transformations, while the ventral stream supports sound/letter to meaning. Data-driven theories on the role of these streams during atypical speech and language development are lacking. Here we provide comprehensive behavioural and neuroimaging data on a large novel family where one parent and 11 children presented with features of childhood apraxia of speech (the same speech disorder associated with FOXP2 variants). The genetic cause of the disorder in this family remains to be identified. Importantly, in this family the speech disorder is not systematically associated with language or literacy impairment. Brain MRI scanning in seven children revealed large grey matter reductions over the left temporoparietal region, but not in the basal ganglia, relative to typically-developing matched peers. In addition, we detected white matter reductions in the arcuate fasciculus (dorsal language stream) bilaterally, but not in the inferior fronto-occipital fasciculus (ventral language stream) nor in primary motor pathways. Our findings identify disruption of the dorsal language stream as a novel neural phenotype of developmental speech disorders, distinct from that reported in speech disorders associated with FOXP2 variants. Overall, our data confirm the early role of this stream in auditory-to-articulation transformations.
Introduction
Approximately 5% of school-aged children have a communication impairment that affects speech, language, or both (Law et al., 2000; Eadie et al., 2015). Family aggregation of these disorders is well known (Viding et al., 2004; Newbury and Monaco, 2010). There are many subtypes of speech sound disorders (Morgan and Webster, 2018) but the most severe is childhood apraxia of speech (CAS), which impacts sequencing of speech movements. In persistent cases, speech cannot easily be understood throughout life (Morgan et al., 2017). Although CAS is rare, unravelling its neurobiological causes is likely to identify brain networks crucial to more common and less severe forms of speech disorders. Unlike adults with acquired apraxia of speech (e.g. post stroke, Trupe et al., 2013), individuals with CAS have radiologically-normal brain MRIs. Consequently, CAS must be caused by alterations in brain development that cannot be detected via routine radiological examination. The neurobiological pathways and networks that underlie CAS are yet to be fully characterized (Liégeois and Morgan, 2012).
Several genes have been implicated in CAS (Eising et al., 2018) including FOXP2 (Lai et al., 2001; Graham and Fisher, 2015); however, for most individuals, the aetiology of their disorder remains unknown. Studies of individuals with inherited CAS provide an opportunity to gain insights into the biology and structural correlates underpinning a shared aetiology. This has been exemplified by studies of a large British family with severe, persistent CAS associated with a FOXP2 mutation. In affected individuals, quantitative MRI techniques have revealed both structural (Watkins et al., 2002b; Belton et al., 2003) and functional (Liégeois et al., 2003, 2011) brain anomalies impacting cortical-subcortical networks (Vargha-Khadem et al., 2005) that mainly alter the striatum (large volume reductions in the caudate nucleus), cerebellum, motor cortex, and inferior frontal gyrus. A recent report of an unrelated male child with a FOXP2 intragenic deletion (Liégeois et al., 2016) confirmed reductions of the caudate nucleus bilaterally, as well as of the globus pallidus and hippocampus. Altogether, these findings have pointed to a crucial role of subcortical structures in FOXP2-related impairments. Of note, these individuals present with CAS alongside language and literacy impairments. The few available MRI studies on sporadic cases with CAS have revealed an inconsistent pattern of brain anomalies in the cortex (e.g. increased cortical thickness in the supramarginal gyrus in Kadis et al., 2014) and basal ganglia (e.g. putamen and caudate nucleus reductions, for a review see Liégeois et al., 2014).
Models of acquisition of speech production (Terband et al., 2009) suggest that somatosensory and auditory feedback contribute to the refinement of auditory and somatosensory targets necessary for motor planning. Similarly, hierarchical models of speech production in adults (Hickok, 2012) suggest that feedforward and feedback loops, in both auditory and somatosensory modalities, provide input to the planning regions. Altogether, auditory-to-motor and somatosensory-to-motor circuits involving posterior temporal, temporo-parietal and inferior frontal regions, as well as corresponding white matter connections (superior longitudinal and arcuate fasciculi) form a dorsal stream crucial to speech production. In the acute phase of stroke, apraxia of speech in adults is associated with anatomical changes in this circuit (Hickok et al., 2014). With the exception of one study (Kadis et al., 2014), there has, however, been little evidence that changes in this dorsal route could be one of the neural phenotypes of CAS.
Here, we aimed to identify the structural and functional MRI correlates of CAS in a new large, two generation family comprising 13 affected individuals. The speech, oral motor, language and cognitive phenotype of 13 family members (two parents and 11 children) is described. Detailed MRI analysis was performed on seven affected siblings, aged 6 to 17 years. In the proband we screened three known CAS genes for mutations. We describe the neural phenotype of this large family to provide novel insights into the neurobiology of CAS.
Materials and methods
Participants
The family was initially referred to our study of the inherited bases of child speech disorders as one child (II-6) was diagnosed with CAS and had four of six siblings who required speech pathology intervention. Both parents had therapy for speech disorders as children, but the father had a less severe presentation with only mild phonological errors and no features of CAS, and there is an extended family history of speech and language disorder on the maternal side. Hence the father was unaffected for the presence of CAS. The four youngest children were born subsequently and later presented with delayed or disordered speech. Thirteen family members (two adults, 11 children) underwent detailed clinical phenotyping. Seven children (three female) aged 6;4 to 15;7 years [mean age = 135 months, standard deviation (SD) 45] took part in the neuroimaging study (Fig. 1). All had average non-verbal cognitive skills and attended mainstream school. Two children were left-handed (one male).
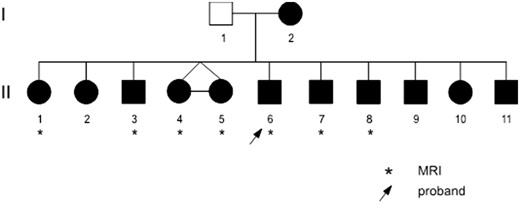
Family pedigree. Individuals in black have CAS errors (see Supplementary Table 2 for details).
Control group for the neuroimaging study
As there are no unaffected (i.e. without speech disorder) children, the control group was unrelated. For each of the seven family members, two age- and gender-matched typically-developing children were recruited to maximize the chances of obtaining a representative distribution of typical values. These participants had taken part in other past (Liégeois et al., 2013) or ongoing studies. The control participants (seven female) were aged 7;5 to 17;9 years (mean age = 145 months, SD = 39). All attended mainstream schools and had average cognitive skills, apart from one female with borderline intellect (Full Scale IQ 72). Four children were left-handed (three male). None had a history of speech problems, neurological disorders, mental disorders, epilepsy or seizures. Control group sizes varied slightly between analyses as some datasets had to be excluded due to excessive motion artefact (see statistical analyses sections).
The study was approved by the Royal Children’s Hospital Human Research Ethics Committee (HREC 27053) in accordance with guidelines set by the National Health and Medical Research Council. All individuals, or their parents in the case of minors, gave written informed consent.
Behavioural phenotype
Family members underwent detailed phenotyping using standardized age-appropriate assessments of speech, oral motor skills, language, phonological skills, literacy and cognition (intellectual functioning, memory and learning, see Supplementary Table 1). Audiovisual recordings of assessments were made using a Marantz PMD671 digital recorder, Countryman Isomax headset microphone, and a Sony DCR-SR85 digital camera. Standard scores were computed using normative data for each test, and speech tasks were analysed for articulation and phonological speech error patterns, and features of CAS. Speech and oral motor tasks were independently rated by two speech pathologists (S.J.T., A.T.M.). Information regarding development and early speech and language skills were obtained, as well as medical records and speech pathology reports.
MRI data acquisition
MRI data were acquired on a 3 T Siemens Trio Tim scanner at the Brain Research Institute in Melbourne (Australia). One hundred and sixty T1-weighted MPRAGE images were acquired approximately aligned in the AC-PC plane at a 0.9 mm isotropic resolution (repetition time = 1900 ms, echo time = 2.6 ms, flip angle: 9°, matrix size: 256 × 256). Five of the control participants had been recruited for parallel studies and their T1-weighted scans had 1 mm resolution (repetition time = 1900 ms, echo time = 2.55 ms, flip angle: 9°, matrix size 256 × 256).
One hundred and twenty functional images were acquired using a continuous echo planar imaging (EPI) sequence with whole brain coverage (repetition time = 3000 ms, echo time = 30 ms, flip angle: 85°, 44 slices, matrix size: 72 × 72, 3 mm isotropic voxels).
Diffusion-weighted imaging (DWI) data were obtained using gradients at 64 evenly spaced directions at a b-value of 3000 s/mm2 [echo time/repetition time = 110/8300 ms, field of view = 240 × 240 mm, matrix size = 96 × 96, slice thickness = 2.5 mm (isotropic voxel size = 2.5 × 2.5 × 2.5 mm), 60 contiguous axial slices].
Functional MRI task
The functional MRI task, where participants heard monosyllabic words and instruction cues via noise-reducing headphones, was identical to that used in a previous study (Morgan et al., 2013). During the Speak condition, words were presented after the auditory cue ‘speak now’ and participants were instructed to repeat them. During the Baseline condition, words were presented after the instruction ‘listen now’. A total of 30 words were presented in five Speak/Baseline cycles, with six stimuli per cycle. Interstimulus interval was 12 s, with 2.5 s of word presentation, 2 s for the response period, followed by a 7.5 s acquisition period.
Functional MRI preprocessing
Analysis was conducted with SPM8 software and associated toolboxes (http://www.fil.ion.ucl.ac.uk/spm/software/spm8). Data were initially corrected for large deviations in movement with a high pass filter and despike technique, and corrected for atypical slices with Artrepair toolbox (v.4). Fewer than 5% of slices were corrected for each individual. Functional MRI data were then spatially realigned, corrected for differences in slice acquisition timing, and coregistered to structural data. Finally, functional MRI data were normalized to the Montreal Neurological Institute (MNI) template and smoothed using an 8 mm full-width half maximum (FWHM) Gaussian smoothing kernel. Atypical volumes were corrected with ArtRepair Volume correction function with individual participant six motion parameters.
Functional MRI statistical analysis
Speech related activation was examined using the Speak > Listen contrast. Group differences were examined using a fixed effects model, with an inclusive mask of the control group speak > listen contrast. Age and six movement parameters were entered as variables of no interest. Voxels that survived corrected P-values of 0.05 [family-wise error (FWE) correction] were considered significant. We applied small volume correction in the putamen using a 5-mm sphere centred on peak coordinates (−18, −6, 15 and 15, −3, 15) obtained from a previous study (Liégeois et al., 2011), as dysfunction in that region was a priori hypothesized.
To interpret functional MRI group differences better, we extracted mean parameter estimates during the Speak > Listen contrast in 3-mm spheres centred on peaks of underactivation, i.e. in the bilateral precentral gyrus and posterior superior temporal gyrus (see Supplementary Table 5 for coordinates). We also examined individual activity in these three regions in all family members using small volume correction (5 mm spheres), for the Speak > Listen as well as for the Listen > Speak contrast.
Global volumes
Total brain grey and white matter volumes were extracted using tissue volume function within SPM12 (http://www.fil.ion.ucl.ac.uk/spm/software/spm12/).
Voxel-based morphometry
Preprocessing involved segmentation of T1-weighted images into grey matter, white matter and CSF, across all participants with the Segmentation option in the SPM12 toolbox (http://www.fil.ion.ucl.ac.uk/spm/software/spm12) using age appropriate tissue probability maps generated using the TOM8 toolbox (Wilke et al., 2008; http://www.neuro.uni-jena.de/software/tom/). This method involves simultaneously aligning grey and white matter among the images, and generating a customized template from all participants. Images were modulated to preserve initial volumes, normalized to MNI space using the DARTEL template, and smoothed using 10 mm FWHM Gaussian kernel. Grey matter maps from family members and control participants were compared using ANCOVA with age, gender, and total grey matter volume as covariates.
The resulting statistical maps therefore represent regions of focal increased or reduced grey matter. Seven family members (mean age = 135 months, SD = 45, range = 76–211) were compared to 14 control participants (mean age = 145 months, SD = 39; range 89–213 months). Small volume correction (5-mm radius sphere centred on peak coordinates from another study, Liégeois et al., 2016) was applied to the caudate nucleus (±14, 3, 18) and putamen (±27, 3, −2). The whole superior temporal gyrus, extracted from the Neuromorphometrics atlas (http://www.neuromorphometrics.com) was also used for small volume correction. These three regions were a priori hypothesized to be structurally atypical based on KE family studies (Belton et al., 2003).
Results were examined at a corrected threshold (P = 0.05 FWE correction] with an extent threshold of 10 voxels, and also at a lower threshold (P = 0.0001 uncorrected) in regions where we had an a priori hypothesis (left superior temporal and supramarginal gyrus, putamen, and caudate).
DWI tractography of speech- and language-related tracts
We performed tractography in native space using MRtrix version 0.2 (Tournier et al., 2012), which identifies the fibre orientation distribution at each voxel using constrained spherical deconvolution, a method proven to be advantageous in voxels where fibres cross (Tournier et al., 2007). We used a probabilistic fibre tracking algorithm (Tournier et al., 2004). The arcuate fasciculus and speech related motor tracts (corticobulbar tract) were tracked using seed regions in two locations of the precentral white matter, as in our previous paediatric studies (Liégeois et al., 2013). For the inferior fronto-occipital fasciculus (IFOF), we used a method similar to that reported in Vandermosten et al. (2012), where we delineated a seed region in the occipital lobe (coronal cross section) and two inclusion regions (one in the extreme capsule in the horizontal plane, one in the frontal lobe in the coronal plane). To ensure that metrics were calculated from the core of the arcuate and IFOF rather than from spurious streamlines, only voxels containing at least 40 streamlines were included in a binary mask. No streamline threshold was applied for the motor tracts. To reduce the number of multiple comparisons, we tracked the dorsal corticobulbar tract only, as microstructural anomalies of this tract were found to be associated with dysarthria after traumatic brain injury (Liégeois et al., 2013) and with developmental speech disorder (Morgan et al., 2018a), indicating it is a major speech motor pathway. Mean fractional anisotropy was calculated by averaging values across all voxels contained within each binary mask. Total number of voxels contained within the mask was used as a measure of tract volume.
Statistical analyses for MRI tractography-derived values
For each tract, we compared metrics from six family members (mean age = 130, SD = 39, range 76–211, after exclusion of one dataset with excessive movement) with those of the 14 control participants using mixed model analyses of variance (Group × Hemisphere), controlling for age (ANCOVA). For post hoc comparisons, non-parametric Mann-Whitney tests were used. Two-tailed P-values are reported as we had no a priori hypothesis regarding the direction of anomaly (increase or decrease) in the family members relative to the control group. IBM SPSS Statistics 23 software was used for analyses. To test both the alternative and null hypotheses when examining group differences, we also ran Bayesian Mann-Whitney tests and extracted Bayes factors using JASP software (https://jasp-stats.org/) using the default Cauchy prior width.
Regional volumes
Regional volumes were extracted from the caudate nucleus, putamen and globus pallidus using FSL (https://fsl.fmrib.ox.ac.uk/fsl/fslwiki) and automated segmentation method [with manual correction of segmentation errors as in a previous study (Liégeois et al., 2016)]. Given the wide age range in our sample, extracted volumes were expressed as percentage of total grey matter.
Direct sequencing of childhood apraxia of speech candidate genes
Candidate genes were amplified using 20 g of genomic DNA from the proband (Patient II-6) and gene-specific primers (oligonucleotides for other genes available on request) designed to reference human gene transcripts (FOXP2: NM_014491). Amplification reactions were cycled using a standard protocol on a Veriti Thermal Cycler (Applied Biosystems). Bidirectional Sanger sequencing of all exons and flanking regions was completed with a BigDyeTM v3.1 Terminator Cycle Sequencing Kit (Applied Biosystems) according to the manufacturer’s instructions. Sequencing products were resolved using a 3730xl DNA Analyzer (Applied Biosystems). All sequencing chromatograms were compared to published cDNA sequence (ensembl genome browser; www.ensembl.org); nucleotide changes were detected using Codon Code Aligner (CodonCode Corporation, Dedham, MA). Coding variants were checked against gnomAD (Cambridge, MA), Exome Variant Server (University of Washington, Seattle) and 1000 Genomes (Wellcome Trust, UK).
Chromosomal microarrays
Genomic DNA (200 ng at 50 ng/µl) from all 13 family members was hybridized to Infinium HumanOmniExpress-12 v1.0 DNA Analysis BeadChips (Illumina) containing 733 302 non-polymorphic markers according to the manufacturer’s instructions. Data analysis was performed using Illumina’s GenomeStudio v2011.1 with Genotyping module 1.9.4 software.
Data availability
The data that support the findings of this study are available from the corresponding author, upon reasonable request.
Results
Family pedigree and clinical phenotype
The family pedigree is shown in Fig.1.
The dominant profile in this family was speech disorder. Six children had CAS characterized by speech sequencing difficulties, error inconsistency, and prosodic impairment (ASHA, 2007; see Supplementary Table 2). All family members had difficulty repeating multisyllabic real words and nonsense words. Speech impairment was more severe in the younger siblings (Patients II-8, II-9, II-10 and II-11) who had unintelligible speech. The five older children and mother had articulation and phonological errors in speech, and features of CAS. Reduced, imprecise or asymmetrical lip, tongue and jaw movement was observed in some individuals. Eight family members had oral structural anomalies including retrognathia: Patients II-4, II-5, II-6 and II-10; bifid uvula: Patients II-4, II-5 and II-11; and high arched palate: Patients I-2, II-1, II-2 and II-10. The father (Patient I-1) had a distinct speech phenotype, including reduced and imprecise tongue movement and phonological speech errors, but not CAS.
All 10 individuals tested had non-verbal intelligence within the normal range (normative mean: 100 ± 15; family range: 84–116), three had verbal working memory impairment (Patients II-1, II-3 and II-6) and four had language impairment (receptive: Patients II-2, II-8 and II-11; expressive: Patients II-6 and II-8) (Supplementary Table 3). Seven individuals had early reading and spelling difficulties that required classroom support (Patients I-1, II-1, II-2, II-3, II-6, II-8 and II-9), but literacy scores were within the normal range at the time of assessment (Supplementary Table 3).
All seven siblings who underwent MRI scanning had: (i) CAS errors; (ii) oral motor impairment; (iii) phonological speech errors; and (iv) impairments repeating nonsense words and multisyllabic words. Two also had language impairment (expressive-receptive for Patient II-8, expressive for Patient II-6), and none had spelling/reading impairments at the time of testing (Supplementary Table 3). These co-occurring features are often present in individuals with CAS (Morgan et al., 2017; Morgan and Webster, 2018).
Genetic analysis to interrogate known genes
FOXP2 was sequenced in the proband (Patient II-6), and no pathogenic variant was identified. Chromosomal microarrays on all 13 family members excluded a copy number variant genome-wide, including at the loci of FOXP2.
MRI group differences
Global brain volumes are intact
There were no group differences in either grey matter [family median = 213 880, interquartile range (IQR) = 13732; control median = 214 220, IQR = 16 664; Mann-Whitney’s U = 48.0, P = 0.97) or white matter (family median = 143 182, IQR = 12 954; control median = 145 340, IQR = 10 459; U = 34.0, P = 0.29) voxels.
Grey matter differences
No region of reduced grey matter was detected in the family relative to controls, using a threshold of P = 0.05 with FWE correction. Using a less stringent threshold (P = 0.0001 uncorrected); however, the largest reduction (in voxels) was located in the superior temporal gyrus/planum temporale extending into the supramarginal gyrus (cluster size = 114 voxels, T = 5.96, peak coordinates −60, −33, 18), which survived small volume correction (T = 5.0, cluster size = 74 voxels, P = 0.009; Fig. 2A).
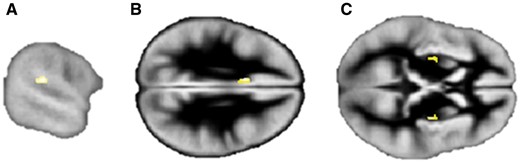
Grey matter differences between family members and control participants. Regions of decreased grey matter in the (A) left planum temporale/supramarginal gyrus, and increased grey matter in the (B) left cingulate and (C) bilateral putamen in family members relative to the control group. Images are displayed at P = 0.0001, uncorrected for multiple comparisons and overlayed onto the group specific grey matter template. See text for peak coordinates. Left hemisphere is on the top in axial views.
One region of significant grey matter increase was detected in the left cingulate cortex (cluster size = 129 voxels, T = 7.17, peak coordinate −8, 12, 29; P = 0.037 with FWE correction; Fig. 2B). Increases in the right putamen (cluster size = 140 voxels, T = 6.74, peak coordinates 30, −12, 8; FWE corrected P = 0.066) and left putamen (cluster size = 45 voxels, T = 5.54, peak coordinates −27, −9, 6; corrected P = 0.32) were detected at the lower threshold (P < 0.0001 uncorrected) but were a priori hypothesized (Fig. 2C). When using small volume correction, an increase in the right putamen (30, −6, 2; T = 5.09, P = 0.004, cluster size seven voxels) was also detected. No group differences were detected in the caudate nucleus. Of note, we ruled out systematic registration errors in the family by inspecting subtraction maps (created in FSL https://fsl.fmrib.ox.ac.uk/fsl/fslwiki) between individual grey matter images and the custom template.
Basal ganglia volumes are intact
There were no significant group differences in volumes for the caudate (left, U = 25, P = 0.079; right, U = 34, P = 0.29), putamen (left, U = 44, P = 0.74; right, U = 41, P = 0.59) or globus pallidus (left, U = 27, P = 0.11; right, U = 31, P = 0.20; Supplementary Fig. 1). No differences were detected either when comparing scans of identical resolution (seven family members versus nine controls).
Differences in the arcuate fasciculus, but not in the IFOF or motor tracts
Fractional anisotropy was reduced in both the direct and anterior segments of the left arcuate fasciculus in the family relative to the control group (Fig. 3D and E; see Supplementary Table 4 for ANCOVA results with post hoc non-parametric group comparisons). In contrast, there were no group differences in fractional anisotropy between the family members and the control group in the motor tracts (Fig. 3A and B) or in the IFOF (Fig. 3C).
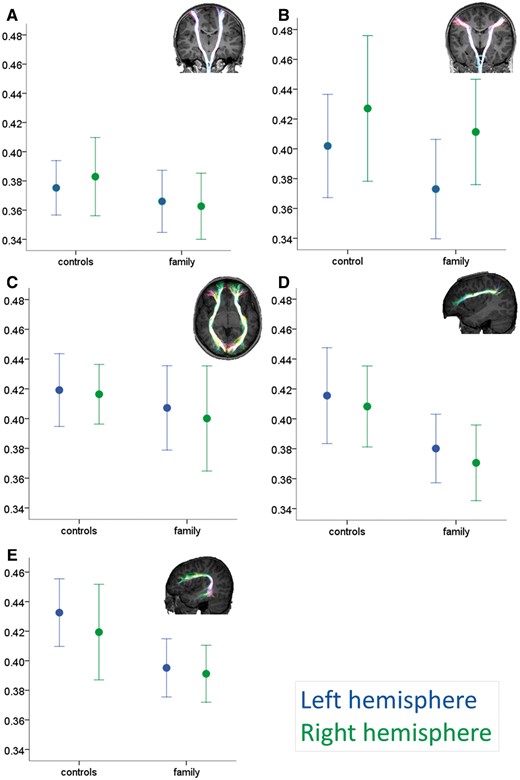
White matter differences between the family and control group. Group values (mean ± 1 SD) for mean fractional anisotropy within the motor tracts (A, hand-related corticospinal; B, speech-related corticobulbar), the ventral language-related tract (C, inferior fronto-occipital fasciculus or IFOF) and dorsal language-related tracts (D, arcuate anterior segment and E, arcuate direct segment). Insets: Examples of tractography output superimposed onto a control participant’s T1-weighted dataset. Tracts are projected onto each slice to allow visualization of full length. See Supplementary Fig. 2 for a scatterplot of the relationship between age and fractional anisotropy in the IFOF and corticospinal tracts.
No tract volumetric differences were significant (P > 0.29 in all cases) except for the IFOF, where family members showed larger volumes than the control group (F = 5.11, P = 0.037). No hemispheric differences or group by hemisphere interaction effects were significant for any tract volumes.
An ANCOVA examining group differences in fractional anisotropy for the dorsal (arcuate) and ventral (IFOF) language tracts within the same model confirmed a tract by group interaction for the anterior segment (F = 6.54, P = 0.020) but not for the direct segment (F = 3.51, P = 0.079). Bayes factors (Supplementary Table 7) indicated that, where we reported no group differences in diffusion metrics, the data were either more likely under the null hypothesis or provided insufficient evidence. When we reported significant differences, the data were more likely under the alternative hypothesis (moderate to strong evidence).
Functional MRI reduced activation during speech in the family relative to a matched control group
Recording of verbal responses confirmed that all participants performed the task in the scanner, including the family members. When repeating words, the family showed reduced activation relative to the control group bilaterally in the pre- and postcentral gyrus, superior temporal gyrus extending into the supramarginal gyrus, cuneus, cerebellum, thalamus, and globus pallidus (Fig. 4 and Supplementary Table 5). The bilateral precentral and left posterior temporal regions will be referred to as the ‘three underactive regions of interest’.
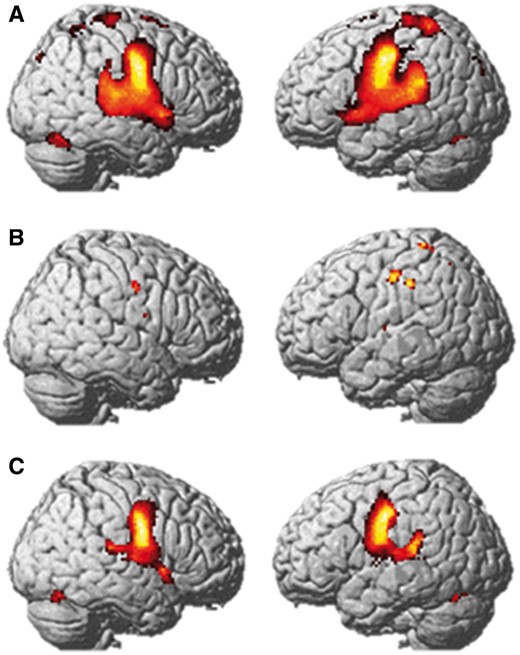
Functional MRI during speech. Average group activation in the control group (A) and family (B), and map of activation difference (Control > family, C) for the Speak versus Listen contrasts. Results are displayed at the FWE corrected 0.05 significance level (A and C), and at the uncorrected P < 0.001 significance level for the family (B) as no activation was detected with FWE correction. Results are projected onto the SPM8 rendered image.
The control group showed bilateral activation in the precentral gyrus extending into the insula, superior temporal gyri, supplementary motor area, and bilateral cerebellum (Fig. 4A and Supplementary Table 6). In contrast, there were no supra-threshold voxels for the family at this threshold. Activation in the precentral gyrus bilaterally was detected at a lower threshold (P = 0.001 uncorrected; Fig. 4B).
Small volume correction (P = 0.05 at peak level) revealed no detectable activation in any family member in the three underactive regions of interest. Left precentral and right precentral activation was however detected at the group level (left: peak at −44, −16, 42, T = 2.34; right: peak at 52, −6, 36, T = 2.16).
Parameter estimates from these three regions revealed individual variability (Supplementary Fig. 4C) and weaker activation than in the control group (Supplementary Fig. 4A). There was no detectable difference in these regions for the Listen > Speak contrast in the family members, as a group or individually. Overall, individual and group data for the family members indicate weak activation (Supplementary Fig. 4A and C) in and left posterior temporal regions. Group map for seven control participants, in contrast, shows detectable activation (P = 0.05, corrected, Supplementary Fig. 4B).
Discussion
The core speech phenotype in this family was CAS. In 12 family members, speech sequencing impairments were evident on tasks designed to stress the phonological system, namely the repetition of pseudowords and multisyllabic words. Encoding phonological representations into motor plans is therefore a persistent core deficit in this family. Repetition deficits that increase with word length and difficulty are a typical feature of both familial (Watkins et al., 2002a; Lewis et al., 2004; Peter et al., 2013) and non-familial (Turner et al., 2013; Nijland et al., 2015) CAS.
Interestingly, most family members scored in the appropriate range on language, non-verbal intelligence, phonological awareness, and verbal memory tests. Similarly, literacy difficulties were not detectable in adolescence or adulthood, despite being reported in the early school years for some. An inherited phenotype of CAS sparing language and literacy in the long term appears rare, as most reported individuals have some degree of persistent language difficulties affecting receptive grammar, vocabulary and sentence production, whether in the setting of a FOXP2 mutation (Morgan et al., 2017) or not (Lewis et al., 2011; Carrigg et al., 2016; Fedorenko et al., 2016; Morgan et al., 2018b). The neural phenotype identified here cannot therefore be explained by co-occurring language or literacy impairments.
Neural phenotype: a dorsal route impairment
Reduced fractional anisotropy in the arcuate fasciculus bilaterally, combined with structural and functional reductions in the left temporoparietal cortex (superior temporal/planum temporale/supramarginal gyrus) are strong indicators of a developmental disorder affecting the dorsal language route (Fig. 5). This route links auditory input/representation to articulatory systems (Hickok, 2012; Fridriksson et al., 2016) and transforms phonological representations into motor programs (Kummerer et al., 2013; Cogan et al., 2014). This dorsal route is therefore also crucial to phonological memory (Buchsbaum and D’Esposito, 2008; Papagno et al., 2017). In contrast, the speech execution white matter pathway (corticobulbar) and the ventral language route (IFOF) were not altered in this family, showing anatomical specificity of our findings.
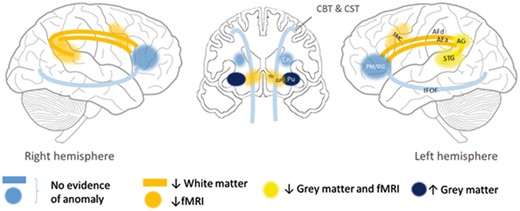
Proposed impaired bilateral dorsal network (yellow/orange) in this family, based on functional and structural imaging results. ↓ = reduced; ↑ = increased; AF = arcuate fasciculus (d = direct segment; a = anterior segment); AG = angular gyrus; CBT = corticobulbar tract; Cn = caudate nucleus; CST = corticospinal tract; GP = globus pallidus; IFOF = inferior fronto-occipital fasciculus; Pu = putamen; PM/IFG = premotor cortex/inferior frontal gyrus; SMC = sensori-motor cortex; STG = superior temporal gyrus; Th = thalamus.
Our hypothesis of a dorsal route impairment is consistent with findings from adult studies showing that direct stimulation of the arcuate fasciculus induces phonemic paraphasias, while stimulation of the fronto-parietal segment induces apraxia of speech (Duffau, 2008). Indeed, both sequencing and phonemic errors were observed in family members. Our findings are also consistent with lesion studies showing the importance of the temporo-parietal region for both word and non-word repetition (Rogalsky et al., 2015), and of the supramarginal gyrus for speech praxis in adults with acute stroke (Hickok et al., 2014) and children with idiopathic CAS (Kadis et al., 2014). Intact phonological representations in this family suggest that only ‘transformation’ of these representations into motor programs is affected. Without longitudinal data in this family, we cannot establish whether white matter alterations precede or follow grey matter dysfunction within the dorsal route during development. Their development could be jointly altered.
In the hierarchical model of speech production proposed by Hickok (2012), there are two feedback loops, one somatosensory and one auditory. Although at weak levels, sensori-motor activation was detected during speech in the family at the group level, and we had no evidence of deactivation in motor regions. Finally, we had no evidence of morphological alteration in the somatosensory (S1) or motor (M1) cortices, and no evidence of altered primary motor pathways. We cannot rule out that early in speech development, alterations in somatosensory feedback in this family were the cause of poorly specified somatosensory targets. Without MRI evidence to support a somatosensory or motor deficit, however, we suggest that the primary deficit in this family is in auditory to motor transformations.
Comparison with FOXP2-related neural phenotypes
Despite phenotypic differences, there were some commonalities between the neural phenotype of our family and that reported in individuals with FOXP2 anomalies. Increased grey matter in the putamen bilaterally has been reported in the KE family (Watkins et al., 2002b), but not in Case A-II (Liégeois et al., 2016). Decreased activation in the wide speech network during speech tasks, including the globus pallidus, is another commonality with FOXP2-related CAS (Liégeois et al., 2003, 2011, 2016). This overlap can be explained by the role of the putamen and globus pallidus in the late phases of sensorimotor learning (Hardwick et al., 2013; Lohse et al., 2014) and initiation/execution of motor plans (Price, 2010), especially in the selection of motor programs (Gil Robles et al., 2005; Argyropoulos et al., 2013). One major difference was that volumetric reductions in the caudate nucleus bilaterally, a major phenotypic marker of FOXP2 disruption, were not observed in the new family. If we consider the caudate nucleus as embedded in language selection [rather than speech selection (Argyropoulos et al., 2013) or cognitive control (Gil Robles et al., 2005)] networks, this difference could be due to the much less severe language impairment in the family reported here. Finally, the grey matter reduction in the superior temporal gyrus observed here was not seen in the KE family, who instead showed increases bilaterally in that region (Watkins et al., 2002a; Belton et al., 2003). Both increases and decreases could be associated with atypical development of the speech processing network.
Possible compensation mechanisms
We suggest that impairment of the dorsal language system can be compensated for via the ventral route for language as well as literacy. Specifically, as lexical knowledge increases, direct mapping between semantic concepts and speech sound maps can develop. For speech sound production, reliance on this ventral route is, however, suboptimal. It results in errors when repeating nonsense and complex words because the high sequential load cannot be coded without using sublexical (i.e. phoneme level) programming. We speculate that disruption of the arcuate fasciculus in our family members has delayed literacy acquisition via the dorsal phonological route (grapheme-phoneme decoding), but has been compensated for by the ventral orthographic route (Vandermosten et al., 2012) via a larger IFOF.
It is noteworthy that our suggestion of the ventral or direct route as a compensatory mechanism is consistent with the hierarchical model of speech production proposed by Hickok (2012). In this model, there is a direct route from semantic/conceptual levels, to word level, to motor programs (premotor cortex/inferior frontal gyrus in Fig. 5). In a developmental condition such as CAS, this route may need to over-develop to compensate for a dorsal impairment—hence larger IFOF volumes in the family.
A developmental neuroanatomical model of childhood apraxia of speech
During the babbling phase (delayed in children with CAS), projections from auditory and sensorimotor maps to feedback control maps are believed to undergo progressive tuning (Guenther, 2006; Terband et al., 2009). At birth, this dorsal route is immature: only short connections between auditory and premotor cortices are present (Skeide and Friederici, 2016), and they support speech repetition (Saur et al., 2008). We propose that if these mappings do not develop appropriately, feedback and feedforward control maps cannot form during the imitation phase, resulting in CAS as in the family reported here. This scenario fits with current computational models of CAS (Terband et al., 2009). Here we provide the first direct neuroimaging evidence to show the importance of the dorsal section of this model in speech disorders.
Prosodic impairments are one of the key features of CAS (ASHA, 2007). Vowel errors were seen across the family, whereas stress errors were mainly shown by the youngest members of the family (Supplementary Table 2). Hickok (2017) proposes that the human laryngeal control circuit provides ‘prosodic frame’ to the planning of speech. Dorsal stream disruption (including in temporo-parietal regions) would therefore also be consistent with prosodic impairments shown by the family.
Implications for speech and language disorders
We have demonstrated that a developmental communication disorder can be associated with cortical and white matter anomalies. This hypothesis complements the more widespread view that language disorders may be of subcortical origin (Krishnan et al., 2016). We posit that disruption or delayed maturation of the dorsal language network could also explain less severe and more common forms of speech disorders and speech delay. Similarly, we suggest that integrity of the dorsal language stream should be examined in speech disorders caused by other genes, and associated with acquired neurological disorders.
In conclusion, we have identified brain anomalies associated with CAS, in a family for whom the underlying molecular basis has not yet been found. We suggest that speech and phonological memory impairment in this family arises from atypical development of the dorsal language network responsible for auditory-motor transformations. Taken together, our data support a novel neurobiological network for an inherited speech disorder.1
Key diagnostic features in 13 family members
| Patient | I-1 | I-2 | II-1a | II-2 | II-3a | II-4a | II-5a | II-6a | II-7a | II-8a | II-9 | II-10 | II-11 |
|---|---|---|---|---|---|---|---|---|---|---|---|---|---|
| Sex | M | F | F | F | M | F | F | M | M | M | M | F | M |
| Oral motor impairment | Y | - | Y | Y | Y | Y | Y | Y | Y | Y | Y | Y | Y |
| CAS errors | - | Y | Y | Y | Y | Y | Y | Y | Y | Y | Y | Y | Y |
| Articulation errors | - | Y | Y | Y | - | Y | Y | Y | Y | - | Y | Y | - |
| Phonological speech errors | Y | Y | Y | Y | Y | Y | Y | Y | Y | Y | Y | Y | Y |
| Repetition of nonsense words/multisyllabic real words impaired | Y | Y | Y | Y | Y | Y | Y | Y | Y | Y | Y | Y | Y |
| Language impairment | - | - | - | Y | - | - | - | Y | - | Y | - | - | Y |
| Early literacy difficulties | Y | - | Y | Y | Y | - | - | Y | - | Y | Y | - | - |
aIndividuals underwent MRI scanning.
F = female; M = male; Y = feature present.
Abbreviations
Acknowledgements
The authors thank the members of the family and control participants for taking part in the study.
Funding
This work was supported by Victorian State Government Operational Infrastructure Support, the Australian Research Council Discovery Project grant (DP120100285), the March of Dimes research grant (12-FY15–3388), and the National Health and Medical Research Council of Australia (Centre for Research Excellence 1116976 and Project grant 1127144) awarded to A.T.M., F.J.L., I.E.S., A.C., M.S.H. and M.B. The work is also supported by the Australian Research Council Discovery Project scheme (DP120100285) awarded to A.T.M., I.E.S., A.C., F.J.L., M.B., and M.H., and by IRIISS funding to the Walter and Eliza Hall Institute of Medical Research (M.B. and T.S.). The National Health and Medical Research Council of Australia provided further support to A.M. (Career Development Fellowship 607315 and Practitioner Fellowship 1105008), S.J.T. (Postgraduate Scholarship 1017773), M.B. (Senior Research Fellowship 1002098 and Program Grant 1054618) and I.E.S. (Program grant 1091593 and Practitioner fellowship 1104831). F.L.’s research is supported by the National Institute for Health Research Biomedical Research Centre at Great Ormond Street Hospital for Children NHS Foundation Trust and University College London (London, UK). S.J.T.’s research is also supported by a Speech Pathology Australia Nadia Verrall Memorial Research grant and Australian National University Gowrie Scholarship.
Competing interests
I.S. serves on the editorial boards of Neurology® and Epileptic Disorders; may accrue future revenue on a pending patent re: Therapeutic compound; has received speaker honoraria from Athena Diagnostics, UCB, GSK, Eisai, and Transgenomics; has received scientific advisory board honoraria from Nutricia and GSK, has received funding for travel from Athena Diagnostics, UCB.
References
ASHA.
Author notes
These authors Frédérique J. Liégeois, Samantha J. Turner and Angela T. Morgan contributed equally to this work.

