


Abstract
Floral traits are used as signals to attract pollinators and play an important role in species identification and isolation. Nicotiana is a genus with a diverse range of flower morphologies, colours, and pollination systems related to a natural history of hybridization, a driver of speciation in this genus. Nicotiana alata and Nicotiana forgetiana are pollinated by hawkmoths and hummingbirds, respectively, and a putative hybrid population was recently found. This population presents flowers with intermediate phenotypes providing an opportunity to investigate the impact of hybridization on floral trait variation. Here we investigated the floral shape, floral pigments, and nectar traits in a putative hybrid population, hereafter termed atypical populations (AP) compared to phenotypes of allopatric populations of both species. We found a high variation in floral pigmentation in AP plants and observed phenotype segregation in some genotypes. Nicotiana forgetiana and AP plants showed the same flavanol peaks as Nicotiana alata, suggesting the same UV-absorbent phenotype attractive to hawkmoths. The geometric morphometric results showed that the intermediate-coloured flowers had similar floral shape and size to N. alata. Our results suggest that the putative hybrid population would be able to attract the same parental pollinator—hawkmoths and hummingbirds—making backcrossing events possible and attracting other pollinators, such as bees.
Introduction
Flowering plants use a net of communication cues that mediate the intricate interaction with animal pollinators (Schiestl and Johnson 2013). The evolution of floral diversity may be driven by pollinators which may identify flower rewards in a complex way based on the perception of flower traits like colour, scent, and shape (Schaefer et al. 2004, Raguso 2008, Schiestl 2015). Floral size, shape, and colour are visual cues displayed by flowers that integrate the plant-animal language of communication, yielding an astonishing spectrum of floral diversity. Overall floral morphology is not just an attraction strategy by the plants, but also a way of standing out in nature and becoming recognizable compared to other flowers, establishing constancy and efficiency of visits that may enhance their chances of reproduction (Chittka and Thomson 2001, Fenster et al. 2004, Schaefer et al. 2004, Chittka and Raine 2006).
Because of their role in reproduction, floral traits could be impacted by distinct selection pressure exerted by pollinators, such as speciation by floral specialization (Stebbins 1970, Pellmyr and Thien 1986), for example, by the different visual perception and feeding preferences of moths, birds, and bees (Goyret et al. 2008, Herrera et al. 2008, Armbruster 2014, Rosas-Guerrero et al. 2014, Silva et al. 2020). Moreover, floral traits are impacted by overlapping relatives and hybridization events (Turchetto et al. 2022), especially floral morphology, colour, and phenology (Rezende et al. 2020). Floral morphology is controlled by the developmental regulatory genes that encode the development of flower morphology and rewards (Bowan et al. 2012, Irish 2017). These gene networks are also subjected to random events on the whole genome scale, interfering, or changing the development of floral phenotypes that, as an unexpected consequence, draw a new response in plant-animal communication, as the pollination interaction (Chase et al. 2010, Porturas et al. 2019). These genomic changes that generate phenotypic changes, such as hybridization, can directly impact pollination systems, attracting new animal groups that previously did not perceive the flowers' signals and causing a pollinator shift event (Rezende et al. 2020).
Hybridization could be an important driver of diversification in Neotropical flora (Schley et al. 2022) and pollinators play a central role in this process (Turchetto et al. 2022). Thus, it is crucial to investigate the impact of hybridization on floral traits that could impact floral visitors. Events like these play an important role across the evolutionary history of the Nicotiana L. genus (Solanaceae), which is diverse in terms of floral morphology, including allopolyploids and homoploid hybrids branching all over its phylogeny (Chase et al. 2003, Clarkson et al. 2010, 2017, Kelly et al. 2010, 2013, McCarthy et al. 2015).
Comprising ~90 species, subdivided into 13 sections, originating in South America, and widely distributed in the Americas with dispersion events suggested towards Africa and Australia (Clarkson et al. 2004, Knapp 2020), the Nicotiana genus displays a diverse array of ways to add to the plant-animal communication language. Corollas range from white to red, including green (e.g. Nicotiana paniculata and Nicotiana rustica) and purple (e.g. some accessions of Nicotiana cordifolia). Their form varies from stellate to fully rounded, and short to long tubes are observed (Kaczoroswski et al. 2012, McCarthy et al. 2015). Nicotiana flowers establish interactions with diverse pollination functional groups: hawkmoths, small moths, hummingbirds, bats, and sunbirds (see Kaczoroswski et al. 2005, Marlin et al. 2016, Silva et al. 2020). The floral traits in Nicotiana, such as corolla shape and size, corolla colour, and nectar composition, may be associated with different kinds of pollinators, such nocturnal hawkmoths, and diurnal hummingbirds in the Alatae section (Ippolito et al. 2004, Kaczorowski et al. 2012, Silva et al. 2020). On the other hand, wider and shorter corollas were suggested to have more generalist pollination strategies in allopolyploid species (McCarthy et al. 2016).
This study focuses on two species of diploid Nicotiana lineages, section Alatae (with chromosome numbers n = 9 and n = 10, Knapp 2020). The group naturally occurs in the Southern Cone grasslands of South America (Clarkson et al. 2004, Lim et al. 2006, Knapp 2020). Nicotiana alata Link & Otto and Nicotiana forgetiana Hemsl. have a different distribution and overlap in range, the first from the South Brazilian Grassland to southern Paraguay, and the latter covering a narrower environment, the open areas in the south-eastern Brazilian Atlantic Forest (Fig. 1; Teixeira et al. 2022). These two species present flowers that perform differently in the language of plant-pollinator communication (Fig. 2A). Nicotiana alata has a large corolla with a long and narrow corolla tube, and a white and heavily scented night-opening flower pollinated by hawkmoths, whereas N. forgetiana has a much smaller, pink-red flower with a faint odour pollinated by hummingbirds (Ippolito et al. 2004, Kaczaroswki et al. 2005, 2012, Raguso et al. 2006).
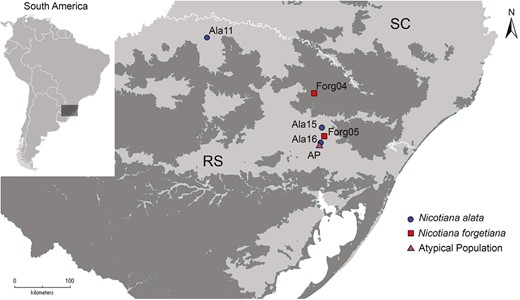
The geographical location of the Nicotiana allopatric and putative hybrid populations where open-pollinated seeds were collected. Nicotiana alata populations are by circles, N. forgetiana by squares, and the putative hybrid population by a triangle. The grassland delimitations are represented by dark shading, and the Brazilian Atlantic Forest by light shading. Delimitation of the grassland area is according to Overbeck et al. (2007). Floral shape from individuals from these populations was analysed.
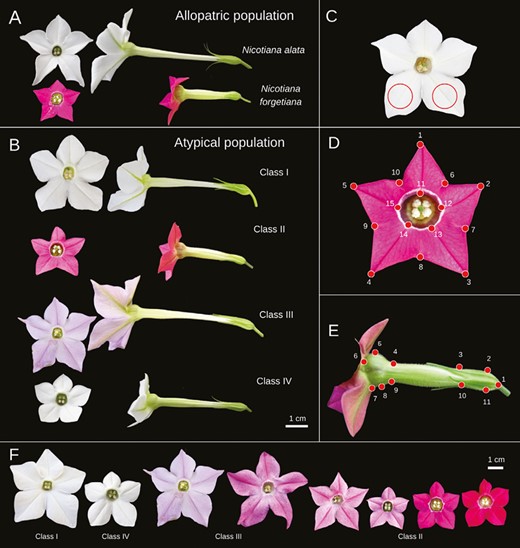
Nicotiana species and AP morphotype of specimens grown in the greenhouse. A, Nicotiana alata and N. forgetiana offspring from the allopatric population. B, Four phenotype classes from AP offspring. C, Area of corolla limb used for pigment characterization. D-E, Landmarks points used in morphometric analysis, AVCL and PV, respectively. (C), (D), and (E) images are not to scale. F, Floral phenotype variation observed in the offspring from the greenhouse.
These two Nicotiana species present some floral trait differences, such as length of the corolla tube (Ippolito et al. 2004, Bissell and Diggle 2008), floral scent composition (Raguso et al. 2003), and nectar composition (Kaczorowski et al. 2005) that were predicted to be relatively efficient mechanisms of isolation between them. However, experimental crossing produced fertile hybrid offspring in a controlled environment (Ippolito et al. 2004, Bissell and Diggle 2008, 2010), and recently, a sympatric natural population of N. alata and N. forgetiana presenting atypical phenotypes was found in the South Brazilian region, with mixed floral traits suggestive of natural hybridization (Teixeira et al. 2022) (Fig. 1).
In this study, we propose to investigate floral trait variation in the atypical population between N. alata and N. forgetiana, to discuss the impact on plant-pollinator interaction. We analysed floral cue variation in the allopatric populations of N. alata and N. forgetiana, and the atypical sympatric population. We addressed the following questions: How do these putative natural hybrid offspring perform the floral cue? How are the well-defined reproductive characteristics of allopatric populations displayed in these sympatric phenotypes?
Materials and methods
Study taxa and sampling
We analysed plants from two allopatric populations of Nicotiana species presenting floral traits related to distinct functional pollinators groups, N. alata (Ala) and N. forgetiana (Forg). We also studied one putative hybrid population, herein termed the atypical population (AP), according to Teixeira et al. (2022) (Fig. 1; Supporting Information, Table S1). We collected one to three fruits from natural open-pollinated plants and stored the seeds at Laboratório de Evolução, Ecologia Química e Quimiotaxonomia (LEEQTAX), Universidade Federal do Rio Grande do Sul, Brazil, for future germination (Supporting Information, Table S1). The seeds were collected from different plants in allopatric populations of both species and from the AP population.
Initially, we randomly selected 10 seeds from each plant for germination. Due to the low success of seed germination of some plants (hereafter known as genotypes), at a later timepoint, six more seeds were germinated. Genotypes with no germination success in the second round of germination were excluded from the experiment (data not shown). For the AP population, the selection of seeds for germination was based on the field phenotype of the mother plant, representing the phenotypic variation observed in the AP population, such as colour and shape (Teixeira et al. 2022). Thus, based on visual assessment of the corolla phenotype, we classified plants from the AP population into four classes (I—IV), ranging from corolla phenotype most similar to N. alata (Class I; long-tubed and white corolla) or N. forgetiana (Class II; short-tubed and pink corolla) (Fig. 2B). The other two classes encompassed plants with intermediate corolla phenotypes (Class III; long-tubed and light pink corolla) and white corolla colour, but their shape was like that of N. forgetiana (Class IV; short-tubed and white corolla) (Fig. 2A, B). This sampling strategy was designed to have the most broad and balanced morphological spectrum possible for future analyses (see below), accounting for 21 field individuals selected and 276 seeds. From these seeds, 108 had successfully germinated, and 55 individuals bloomed (Supporting Information, Table S1).
All seeds were treated with 5 µL of gibberellic acid (2 mg gibberellic acid in 1 mL DMSO) dissolved in 1.5 mL of water for 24 h in the dark at 4°C with 10 seeds/Eppendorf. The seeds were germinated on vasesand vermiculite (1:1) in the grow room under controlled conditions (12 h of light, 25°C) (Rodrigues et al. 2018). Once the seedlings reached the four-leaf stage, they were transferred to a vase; the new growing medium was kept at the same ratio of soil to vermiculite and was enriched with NPK (10:10:10). Developed seedlings were reassigned to the greenhouse during spring and summer, where they were submitted to natural environmental conditions of light, humidity, and temperature.
Once the flowers bloomed, the offspring from the AP population showed segregation of visual floral colour compared to its mother plant from the field. Because of this, we reassigned the plants from the greenhouse into the four classes (Fig. 2B). The class system applied here is arbitrary, based solely on visual cues to facilitate the organization of the study. Comparisons between field maternal and offspring phenotypes are available in Supporting Information, Figure S1.
Corolla pigment concentration, nectar volume and concentration, shape, and size measurements were made on plants from greenhouse-germinated seeds that produced flowers. To improve the sample size for geometric morphometric analyses, we added 56 individuals of N. alata and 51 individuals of N. forgetiana collected in the field from the same populations as the collected seeds, except for one population of N. alata (see Supporting Information, Table S1). We also added the data from AP population collected in the field (47 individuals), including the mother plants of greenhouse offspring. Thus, we analysed two generations of putative hybrids from the AP population (Supporting Information, Table S1).
Quantification of flavonols and anthocyanins
Because corolla colour in Nicotiana is mainly produced by flavonols and anthocyanins (Ng and Smith 2016, McCarthy et al. 2017) and the visual cue is important to pollinators (Schiestl and Johnson 2013), we evaluated and compared the flavonoid concentration in the corolla of AP and allopatric populations of both species. We selected greenhouse cultivated flowers in good condition (1–3 days old, with no nectar spill, scattered pollen, or contamination). We cut two discs (8 mm in diameter) per flower, as shown in Fig. 2C. In total, we analysed the floral pigments of 42 individuals and three flowers per individual separately (Supporting Information, Table S1). All the discs were taken from the same bottom lobes at the same position in an attempt to capture the pigments clustered along the petals’ central venations (Fig. 2C). The discs were put in 1 mL of extraction buffer (2:1:7, methanol: acetic acid: water) and we kept the solution in the dark for 48 h (modified from Rodrigues et al. 2018). We measured the absorbance spectra with a SpectraMax M4 spectrophotometer (Carl Zeiss, AG) using the software SoftMax Pro 6.2.2 (Molecular Devices, LLC). The pigment solution was plated on ELISA plates, each sample having three technical replicates. Flavanols were detected at 290–320 nm (UV-B, shortwave) and 320–400 nm (UV-A, longwave; Tripp et al. 2018), and anthocyanins were absorbed at 400–600 nm (Tsimogiannis et al. 2007, Merzlyak et al. 2008).
To provide insights into how AP plants can optimize their flower coloration for attracting pollinators, we used the absorbance (A) spectra measured from each corolla to estimate the reflectance (R) spectra using the model A = 1 - (R + T) (van der Kooi et al. 2016), where T (transmittance) was provided using the mathematical transformation that represents the relationship between A and T: A = log(%T), and then we calculated the R spectra (Supporting Information, Table S2).
Nectar traits
Nectar collection was performed 24–30 h post-anthesis. The greenhouse cultivated flowers were marked for nectar collection on the anthesis day and placed vertically to avoid nectar spill. The corolla tube was slightly squeezed to push the nectar towards the base, and the anthers were cut off to prevent pollen contamination. The volume was measured with a 50 µL glass microsyringe (Hamilton Company). Sugar concentrations were measured with a portable refractometer (Instrutherm), using 5 µL for each flower. Dilutions in 10 µL of distilled water were made whenever necessary.
We measured three to five flowers for each plant. In total, we collected and measured the nectar volume and concentration of 23 plants and 96 flowers from 14 AP individuals, three Nicotiana alata, and six N. forgetiana (Supporting Information, Table S1). To test whether the allopatric population of both species and the AP plants produced different nectar traits, we performed a one-way ANOVA test and, subsequently, a pairwise comparison using a post hoc Tukey HSD test. The analysis was performed in the statistical software jamovi 2.2 (The Jamovi Project 2021). To estimate the total energy offered per flower, first we converted the g/g concentration acquired (Brix refractometer measurements) into mg/µL values using the equation: y = 0.00226 + (0.00937x) + (0.0000585 × 2), where ‘x’ stands for the concentration given and ‘y’ stands for the mg/µL value required (Araújo et al. 2021).
To have a better understanding of the relationship between volume and concentration in AP morphotypes, we examined the functional relationship by linear regression. The analysis was carried out using the function lm in R (R Core Team, 2021).
Corolla shape and size
Through geometric morphometric analyses, we analysed corolla limb and corolla tube shape and size in offspring from AP and allopatric populations of both species cultivated in the greenhouse (34, 11, and four individuals for AP, N. forgetiana, and N. alata, respectively), and from allopatric and AP collected in the field by Teixeira et al. (2022) (47, 51, and 56 individuals for AP, N. forgetiana, and N. alata, respectively, including the 21 mother plants). We collected standardized photographic images using a Sony DSC-HX400V Digital Camera featuring a 2.8–6.3/4.3–215 Carl Zeiss lens at a resolution of 1920 × 1080 pixels employing the macro function without a flash (Teixeira et al. 2022). We collected one flower per individual.
We analysed 160 flowers for the adaxial view of the corolla limb (AVCL = frontal view; 49 greenhouse-grown flowers and 111 flowers from the field; Teixeira et al. 2022), 203 for the corolla profile view (PV = profile view, 49 greenhouse-grown flowers, and 154 flowers from the field; Teixeira et al. 2022) (Supporting Information, Table S1). The pictures were organized into TPS files using TPSutil v.1.38 software, and the landmarks were manually marked with TPSDig2 software (Rohlf 2015). We used 15 landmarks for AVCL: five on each limb apex (1, 2, 3, 4, and 5), five on each petal junction (6, 7, 8, 9, and 10), and five on the venation pattern of the central tube opening (11, 12, 13, 14, and 15) (Fig. 2D); 11 landmarks for PV: three marking the limits between different kinds of tissues or anatomical tissue limits (1, 6, and 7), curvatures limits on the corolla tube (3 and 10), and minimum and maximum curvature points along the tube and inflated apex of the corolla (2, 4, 5, 8, 9, and 11) (Fig. 2E) (Bissell and Diggle 2010, García et al. 2020, Teixeira et al. 2022). We also analysed the mother plants collected in nature, hereafter termed AP Field. Thus, we analysed two putative hybrid generations from open pollination.
We performed a generalized Procrustes analysis (GPA) on the bi-dimensional coordinates of the landmarks to eliminate the effects of position, scaling, and orientation (Rohlf and Slice 1990). We used the resulting matrices to run a Principal Component Analysis (PCA; Jolliffe 2002) and canonical variate analysis (CVA) in MorphoJ (Klingenberg 2011) to summarize the shape variation in the dataset. We ran a permutation test using Procrustes distances with α = 0.05 and 10 000 permutations to assess the statistical significance of pairwise differences in mean shapes among species and AP plants. Corolla limb and corolla tube size were measured from photographs through the log-transformed centroid size of each image (Zelditch et al. 2012), and the differences among populations or species were tested by analysis of variance (ANOVA). We performed multiple comparisons with a post hoc test (α = 0.05) of Tukey’s honest significant difference (HSD). We ran the ANOVAs in the geomorph R package with the advanced.procD.lm function (Adams et al. 2018).
In attempt to identify morphological clusters without a priori classification, we applied the Gaussian finite mixture analysis to the geometric morphometric data (Baylac et al. 2003). The Gaussian finite mixture analysis was performed on the first two principal components (PCs) of the Procrustes coordinates previously done, and the best model was chosen based on the Bayesian information criterion (BIC) (Fraley and Raferty 2007). The analysis was performed with the mclust package (Scrucca et al 2016) of R statistical software (R Core Team, 2018).
Results
Floral colour variation
The greenhouse AP offspring showed a broad range of visual colour variability (Fig. 2F; Supporting Information, Fig. S1). The usual white coloration expected for N. alata phenotypes was present in Class I and Class IV offspring, whereas the pink and reddish hues of N. forgetiana were present in Class II (Fig. 2A). In contrast, Class III encompassed a wide range of pink shades that extended from pink corollas, through to light pink corollas and predominantly white corollas with concentrated pigments along the venation or on the abaxial surface (Supporting Information, Fig. S2D, E). Even though the greenhouse offspring did not necessarily correspond to the phenotype of mother plants collected in nature, no new phenotype with a strikingly different characteristic was observed (Supporting Information, Fig. S1).
As mentioned earlier, the AP offspring phenotype did not follow the maternal phenotype for all the genotypes analysed. All maternal AP plants from Class I only generated greenhouse AP Class I offspring, accounting for 35.9% of total AP offspring. Class II was the most represented in this study, and most mothers classified as class II also generated class II progeny (Supporting Information, Fig. S1; Table S1). However, the maternal AP17 plant was the only maternal Class II that showed segregation of characteristics, with three offspring included into different classes: AP17.1 = Class I, AP17.4 = Class III, and AP17.3 = Class IV. The lattermost was the only individual classified into Class IV. This offspring phenotype was unexpected since the only maternal AP Class IV—AP13—had no germination success (data not shown). Maternal AP Class III generated the most diverse offspring class phenotypes: all the greenhouse AP Class III, six more greenhouse AP Class I, and one more greenhouse Class II. Class I and Class II (morphotypes closer phenotypically to the N. alata and N. forgetiana respectively) were the most represented of the greenhouse AP phenotypes, at 35.9% and 41.03%, respectively. All images of the plants are presented in Supporting Information, Fig. S1.
In general, as expected, we did not observe unusual phenotypes in offspring from allopatric populations of N. alata or N. forgetiana. However, we observed minor colour polymorphism comparing in specimens of N. forgetiana from the different allopatric populations(Supporting Information, Table S1). For example, offspring from the Forg04 population bloomed into flowers with the inflated apex of the corolla’s inner wall deeply pigmented (Supporting Information, Fig. S2A, top row). In contrast, flowers from the Forg05 population did not exhibit such deep pigmentation on the same structure; the green coloration of the tube extended towards the inflated apex (Supporting Information, Fig. S2A, bottom row). Another visual difference between the flowers from those two populations was the presence or absence of the white ring across the tube opening. The flowers with deeper pigmentation on the inner walls also had a thinner white line across the opening (Forg04 population). At the same time, flowers with lower pigmentation had a thicker white line (Forg05 population). That same pigmentation pattern was also observed in some Class II individuals from the AP population, as shown in Supporting Information, Fig. S2B.
The petal pigmentation pattern (PPP) was shown to be highly characteristic among AP offspring individuals. The colour intensity displayed variation among Class II and III (Supporting Information, Fig. S1). The pigments in Class III flowers were often concentrated along the central venation (Supporting Information, Fig. S2D). The PPP seemed irregular even among the same individual during the same flowering period, with some flowers displaying the central venation pink line in one flower and utterly absent in another. This disparity was responsible for the apparent misclassification of some individuals. Some flowers were clearly white therefore put into Class I, but the pinkish hue began to be more evident in other flower buds along the same blooming period. As for colour variation among the same individual, the concentration and spread of pigment also varied (Supporting Information, Fig. S2D, E). Another unexpected characteristic was the presence of anthocyanins only on the abaxial surface of the petals. At first glance, the flower seemed to be white, but a pinkish hue could be noticed once the flower was handled. This characteristic also varied among the same individual during the flowering period (Supporting Information, Fig. S2E).
Flavonol and anthocyanin quantification
The AP population showed higher flavonol concentrations than the allopatric population of both species, except for Class I (Fig. 3). Nicotiana alata flowers had higher concentrations of flavonols at 290 nm, and N. forgetiana had higher flavonol concentrations at 320 nm, both within the UV-B shortwave range. Notably, N. forgetiana individuals from Population Forg04 had a concentration peak at 290 nm and another at 320 nm. Individual spectrophotometric quantification graphs are available in Supporting Information, Fig. S3. Nicotiana forgetiana presented a higher concentration of anthocyanins at 530 nm, whereas N. alata showed no significant concentration peak in anthocyanin wavelength absorbance space.
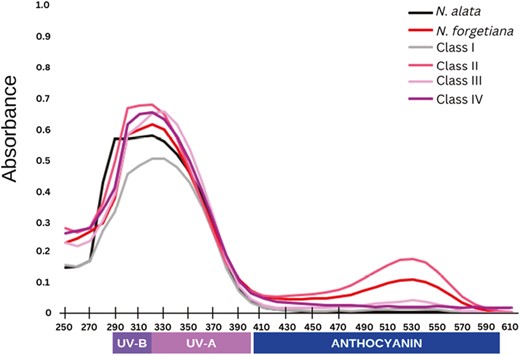
Quantification of pigments of sympatric and allopatric sites of N. alata and N. forgetiana. Nicotiana alata N = 4, N. forgetiana N = 5, Class I N = 13, Class II N = 14, Class III N = 4, Class IV N = 1. Flavonols UV-B shortwave (290–320 nm); flavanols UV-A longwave (320–400 nm), and anthocyanins (400–600 nm).
Class I AP flowers had the lowest concentration of flavonols among all samples, at 320–330 nm, and no concentration peak at longer wavelengths as a group (Fig. 3). However, individuals AP5.4 and AP9.4 showed a significantly higher concentration of anthocyanin for visually white individuals (also at 530 nm) (Supporting Information, Fig. S3). Class II had the highest concentrations among all groups, with flavonols at 320 nm and anthocyanins at 530 nm (Fig. 3). Class III showed higher flavonol peaks at 330 nm, and, as a group, concentration of anthocyanins was not high (Fig. 3), even among specimens separately, the anthocyanin concentrations are lower than other pigmented classes (Supporting Information, Fig. S3) The white coloured Class IV, with only one individual, displayed a high concentration peak at 320 nm and no significant pigment peak at a longer wavelength (Fig. 3).
To assess floral colour as perceived by pollinators, we compared the AP plants with N. alata and N. forgetiana in spectral reflectance through a mathematical transformation of absorbance data (Supporting Information, Table S2). Most Class I and IV AP plants were similar to N. alata in spectral. In addition, most Class II and III AP plants were similar to N. forgetiana in spectral (Supporting Information, Table S2). Because the reflectance and transmittance measurements were not recorded directly from flower, we need to take care in the interpretation of the reflectance spectrum. A more accurate way is to measure the spectral reflectance directly from the flowers.
Floral shape and size
The PCA analysis of landmarks in the AVCL yielded 26 PCs that accounted for the variation in the frontal corolla shape (Supporting Information, Table S3). The first two PC axes shown in Fig. 4A accounted for ~58% of the variation. The morphospace defined in PC1 varied from a stellate morphology (sharper limb angles and smaller tube entrance) for negative scores and a rounded-pentagon morphology (shallow limb angles and broader tube opening) towards positive scores. PC2 encompassed the size of the top petal limb, negative scores represented a thinner limb (sharper angles), and positive scores represented a larger limb (shallow angles).
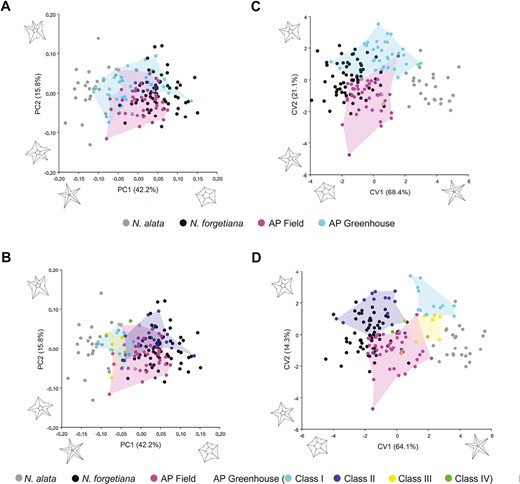
PCA (A-B) and CVA (C-D) of frontal view of allopatric species, N. alata, N. forgetiana, AP greenhouse cultivated, and AP collected in the field from Teixeira et al. (2022). (A) and (C) represent PCA and CVA, respectively, of N. alata, N. forgetiana, AP from the field, and AP from the greenhouse. (B) and (D) represent PCA and CVA, respectively, of phenotypic classes: N. alata, N. forgetiana, AP from the field, AP Class I, AP Class II, AP Class III, AP Class IV. The mother plants are indicated with an asterisk. The axes are the principal components and canonical variates 1 and 2, with their morphological variations represented in shape.
Flowers of N. alata and N. forgetiana were well separated along the PC1, with their corolla frontal shape far apart by negative and positive scores, respectively. However, the two species overlapped in PC2, with low variation along that axis. The two generations of AP plants showed great variation and displayed a superimposition with N. forgetiana and N. alata morphospace, and few overlap between them (Fig. 4A, B). AP offspring Class I and III had negative scores along PC1, being placed closer to the N. alata flowers, but different from them, AP Class I covered a broader morphospace in PC2. Most specimens of Class II had positive scores along PC1, closer to N. forgetiana morphospace. The single AP Class IV plant had negative scores along PC1, and positive scores along PC2 (Fig. 4B).
Corolla limb shape differed significantly among N. alata, N. forgetiana, and the two AP generation plants, from the field and greenhouse cultivated (Table 1). The CVA of two species and two generations of AP plants. CVA of had two main canonical axes accounting for 89.5% of variations in AVCL (Fig. 4C). The CVA considering the phenotype classes from AP greenhouse plants had its two axes accounting for 78.4% of total variation (Fig. 4D). Nicotiana alata and N. forgetiana formed different groups in the morphospace. The two generations of AP flowers showed a minor superimposition and were most close to N. forgetiana (Fig. 4D). Procrustes distances of corolla AVCL showed that all classes were significantly different from each other and from the two species (P < 0.05), except for Class IV, which did not show a significant difference from any. The Class III phenotype does not significantly differ from N. alata (Supporting information, Table S5).
Procrustes distances among species and AP plants. Below diagonal - AVCL view; above diagonal - PV view; bold - significant differences (P < 0.05)
| AP Field | AP Greenhouse | N. alata | N. forgetiana | |
|---|---|---|---|---|
| AP Field | _ | 0.061 | 0.1006 | 0.0278 |
| AP Greenhouse | 0.0528 | _ | 0.0474 | 0.0768 |
| N. alata | 0.1164 | 0.0854 | _ | 0.1195 |
| N. forgetiana | 0.052 | 0.0799 | 0.1533 | _ |
| AP Field | AP Greenhouse | N. alata | N. forgetiana | |
|---|---|---|---|---|
| AP Field | _ | 0.061 | 0.1006 | 0.0278 |
| AP Greenhouse | 0.0528 | _ | 0.0474 | 0.0768 |
| N. alata | 0.1164 | 0.0854 | _ | 0.1195 |
| N. forgetiana | 0.052 | 0.0799 | 0.1533 | _ |
The PCA from PV yielded 18 PCs that accounted for corolla tube shape variation among the morphotypes. The first two PCs represented in Fig. 5A, B axes are responsible for 85.7% of the total variation (Supporting Information, Table S4). Negative scores in PC1 correspond to tubes with a larger width and wider throat opening, whereas positive scores correspond to tubes with a smaller width and straighter throats. The morphological variation in PC2 was related to the inflated apex of the corolla tube orientation and deepening, ranging from shallower up-oriented openings in negative scores to deeper openings and front oriented in positive scores (Fig. 5A, B). Nicotiana alata and N. forgetiana were well separated along the PC1 axis, scoring at positive and negative positions, respectively (Fig. 5A). Both generations of AP plants (AP field and AP greenhouse) had a wider morphological variation presenting overlap with both species, N. alata and N. forgetiana. AP Class I and Class III morphospace were superimposed with each other, and N. alata in PC1 positive scores. The same happened for N. forgetiana and AP Class II with more negative scores. Class IV appeared as intermediate tube shape (Fig. 5B). The two CV axes of PV landmarks grouped by species and two generations of AP plants represented 90.7% of the variation in corolla tube shape, and Procrustes distances showed that all pairwise comparisons had significant differences (P < 0.05, Fig. 5C; Table 1). Nicotiana alata and N. forgetiana were different in corolla tube shape in CV1, while the two AP generation plants were different in CV2 (Fig. 5C). The CV considering the phenotypic classes had axes accounting for 84.8% of shape variation, and Procrustes distances showed that only a Class IV had no significant difference (P < 0.05; Fig. 5D, Supporting Information, Table S5).

PCA (A-B) and CVA (C-D) of PV of the allopatric species N. alata and N. forgetiana, AP plants cultivated in the greenhouse, and AP plants collected in the field from Teixeira et al. (2022). (A) and (C) represent PCA and CVA, respectively, of the following populations: N. alata, N. forgetiana, AP field, and AP greenhouse. (B) and (D) represent PCA and CVA, respectively, of the phenotypic classes: N. alata, N. forgetiana, AP field, AP Class I, AP Class II, AP Class III, AP Class IV. The mother plants are indicated with an asterisk. The axes are the principal components and canonical variates 1 and 2, with their morphological variations represented in shape.
Size variation estimated from (log) centroid size by ANOVA for samples grouped by population showed a significant difference in PV (F = 146.2, P < 0.001) and in AVCL (F = 84.06, P < 0.001). Nicotiana alata had the largest corolla limb size and tube length, followed by AP AP Greenhouse. Pairwise comparisons showed significant differences among all populations (N. alata, N. forgetiana, AP Field, and AP AP Greenhouse) (P < 0.001) (Fig. 6A, B). When the same analysis was performed with the samples grouped by phenotype classes, there was a significant difference in corolla size in PV (F = 92.91, P < 0.001) and AVCL (F = 46.7, P < 0.001). Among the classes, Class I and III had the largest tube length and corolla limb size. Pairwise comparisons showed significant differences between a few classes (P < 0.001) (Fig. 6C, D).
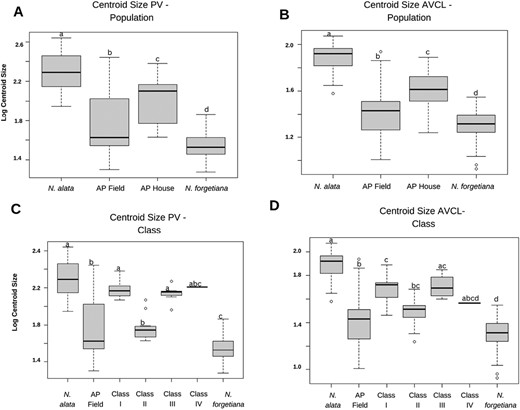
Boxplots of size variation among population groups and phenotype classes. (A) corolla PV—Populations centroid size variation, (B) corolla AVCL—Populations centroid size variation, (C) corolla PV—Class centroid size variation and (D) corolla AVCL—Class centroid size variation. Pairwise comparison is represented by letters. The same letters show pairs with no significant variations (P < 0.01).
Gaussian mixture analysis recovered only one group for AVCL (Supporting Information, Fig. S4). PV analysis recovered three clusters, two of them composed mostly by AP plants (cluster I and III). Cluster I comprised two greenhouse cultivated N. alata, 14 AP greenhouse plants, and five AP field plants. Cluster III comprised three N. alata, eight N. forgetiana, four AP greenhouse, and 23 AP field plants, whilst cluster II comprised the remaining N. forgetiana, N. alata, and AP plants (17 greenhouse and 19 field) (Supporting Information, Fig. S4). Moreover, most mother plants did not cluster together with their offspring.
Nectar volume and concentration
In N. alata and N. forgetiana plants, nectar was secreted at the base of the flower. Nicotiana alata was the species with the highest nectar volume and total energy offered and the highest average nectar concentration was found in the Class II phenotype (Supplementary Information, Fig. S5). Plants from the AP population presented variations in nectar volume, ranging from 7.33 μL to 26.33 μL, and total sugar nectar concentration ranged from 9.50% to 22.88% (Table 2). The total energy offered among all flowers ranged from 0.99 mg of sugar (N. forgetiana) to 5.1 mg (N. alata) (Table 2). The one-way ANOVA test showed a significant difference in nectar volume and total energy (P < 0.001). Pairwise comparisons found significant differences between N. alata and N. forgetiana, but no differences between N. alata and Class I. Further comparisons are shown in Supporting Information, Fig. S5. The linear regression demonstrated that nectar volume was not significantly correlated with the nectar concentration (R² = 0.003611, P = 0.531) (Supporting Information, Fig. S6).
Nectar traits in N. alata, N. forgetiana, and AP individuals (mean ± SEM)
| Genotype | Volume µL (mean ± SEM) | Concentration % (mean ± SEM) | Total energy mg of sugar |
|---|---|---|---|
| Nicotiana alata | |||
| Ala 302_1 | 28.25 ± 2.78 | 19 ± 0.58 | 5.1 |
| Ala 302_2 | 21.75 ± 2.39 | 18.13 ± 0.61 | 3.75 |
| Ala 318_1 | 20.75 ± 5.22 | 18.5 ± 1.32 | 3.65 |
| Nicotiana forgetiana | |||
| Forg 72_7 | 9.17 ± 1.91 | 19.95 ± 0.47 | 1.74 |
| Forg 109_2 | 5.55 ± 1.5 | 19 ± 1.47 | 0.99 |
| Forg 109_3 | 10.17 ± 1.48 | 22 ± 0.0 | 2.12 |
| Forg 121_3 | 7.55 ± 1.43 | 20.47 ± 0.82 | 1.46 |
| Forg 121_4 | 7.83 ± 1.53 | 20.4 ± 1.22 | 1.52 |
| Forg 121_5 | 8.55 ± 2.38 | 20.22 ± 0.78 | 1.63 |
| AP Class I | |||
| AP 9_3 | 17.17 ± 6.43 | 20 ± 0.0 | 3.23 |
| AP 27_2 | 11.85 ± 6.07 | 9.5 ± 5.3 | 1.09 |
| AP Class II | |||
| AP 31_1 | 11.83 ± 4.09 | 17.4 ± 1.14 | 1.96 |
| AP 31_6 | 19.19 ± 1.53 | 20.33 ± 0.67 | 3.67 |
| AP 31_11 | 16.55 ± 3.25 | 22.33 ± 0.88 | 3.49 |
| AP 35_3 | 15.53 ± 1.87 | 22 ± 0.82 | 3.25 |
| AP 43_1 | 20.85 ± 1.78 | 22.88 ± 0.69 | 4.51 |
| AP 51_3 | 23.67 ± 4.94 | 20.67 ± 0.88 | 4.64 |
| AP Class III | |||
| AP 4_1 | 10.33 ± 2.19 | 18.5 ± 1.1 | 1.81 |
| AP 11_3 | 26.33 ± 10.7 | 20 ± 0.0 | 5.0 |
| AP 17_4 | 10.99 ± 1.49 | 21 ± 0.63 | 2.17 |
| AP 18_2 | 8.74 ± 1.5 | 18.81 ± 0.56 | 1.56 |
| AP 27_4 | 18.18 ± 2.52 | 21 ± 0.58 | 3.58 |
| AP Class IV | |||
| AP 17_3 | 7.33 ± 1.72 | 19.6 ± 0.68 | 1.36 |
Discussion
Evolutionary mechanisms in speciation and isolation are plural and constantly being investigated. Corolla colour, shape, and rewards are three intricated traits that participate in specialized pollination systems, thus contributing to species isolation by preventing gene flow between species. For example, floral colour and size are important characteristics for pollinators foraging on flowers (Waser and Price 1981, Chittka and Raine 2006, Kaczorowski et al. 2012), not only for distant floral detection, but these features also have a particular function in pollinator learning, reward connection, and energy cost (Meléndez-Ackerman et al. 1997, Gegear et al. 2017). Thus, a population presenting variability in these traits, especially in pairs of species with floral specialization associated with the primary pollinators, such as hawkmoths and hummingbirds, should intensify visits by secondary or sporadic pollinators and gene exchange between species. In this study, we delved into a case study of the putative hybrid population between N. alata and N. forgetiana in contrast with an allopatric population of these species where typical floral phenotypes are found. We found a significant variation in the putative hybrid population related to floral pigmentation, corolla shape and size, and nectar traits.
Nicotiana alata and N. forgetiana flowers from allopatric populations matched the expected characteristics for sphingophilous and ornithophilous pollination systems, respectively (Kaczorowski et al. 2005, Cronk and Ojeda 2008). However, it is interesting to note that N. forgetiana, as well as AP plants, also present a flavonol concentration which could be in the visual spectrum of hawkmoths and bees. Species-specific pollination is not common for most plants, and most flowers have a range of secondary visitors that may or may not execute a pollination service efficiently (Fenster et al. 2004). In an experimental sympatric population, secondary visits of small moths were observed for N. forgetiana, and hummingbirds visiting N. alata (Ippolito et al. 2004). Furthermore, in these two species, sporadic visits of other animals, especially honeybees and halictid bees, had been observed in nature (Turchetto et al. 2022).
Among all human-detectable visual traits, the colour and shape variation among the AP population raises the question of their origin. Hybridization is a common feature in Nicotiana, a known driver for diversification in the genus with a considerable rate of allopolyploids and homoploid hybrids with different ages (Chase et al. 2003, Clarkson et al. 2010, 2017, Kelly et al. 2010, 2013, McCarthy et al. 2015). Experimental crossing between N. alata and N. forgetiana has proven successful (Ippolito et al. 2004, Bissell and Diggle 2008), and the natural AP population analysed by Teixeira et al. (2022) and our greenhouse Class III offspring studied here exhibit similar colour phenotypes as described for experimental hybrids (Ippolito et al. 2004, Bissell and Diggle 2008).
There was an evident prevalence of Class I and II offspring, which could allude to the sympatry of the species and no natural gene flow between them. However, field seeds collected from flowers in the field classified into the intermediate Class III (long-tubed, large corolla limb, pink colour) originated some ratio of flowers with phenotypic variation. To illustrate this, maternal genotype AP27, belonging to Class III, generated four offspring with apparent segregation of characteristics: three into Class I and one into Class II. Other interesting events of characteristic segregation happened with AP17 offspring. The maternal phenotype had been classified into Class II, and none of the offspring presented the same phenotype, blooming into Class I placing it into the opposite pollinator phenotype, an intermediate Class III and the only Class IV flower among the greenhouse individuals. Nicotiana alata and Class I had the same white colour in the human perception range, but the flowers slightly differed in average flavanol concentration. However, the absorbance peaks for both groups were in the same shortwave length range. These results suggest that UV-reflective flowers of Class I are of a similar appearance to a pollinator so that, in natural conditions of light and background, are shown to be preferred by hawkmoths. (Grant 1983, White et al. 1994, Kuenzinger et al. 2019). The same flavonol peaks were present in coloured flowers (N. forgetiana, Class II, and III) in the same short and long wavelengths as the white ones, suggesting that these flowers also display the UV-absorbent phenotype. The N. forgetiana and Class II presented flower colour configuration on hummingbird view, with peaks within ~530 nm (Cronk and Ojeda 2008). In this case, the Class II phenotype had a higher average concentration of anthocyanins than the allopatric species, with flowers ranging from a fainter hue of pink and corollas presenting corollas with a red colour, deeper than that of the allopatric populations.
The reward systems are, so far, too incipient to draw further conclusions. However, to date, analysis shows that the nectar traits of N. alata (volume, concentration, and total energy) are within the range previously found by Kaczorowski et al. (2005). However, the nectar characteristics of N. forgetiana did not follow those described for the species, being more diluted than the previous descriptions. Class I and II nectar volume and concentration were not similar to species, N. alat and N. forgetiana, respectively. This difference could be due to the lack of experimental numbers, and should be mitigated in later experiments, or may show an unbalanced reward system offered by the phenotype.
The morphological features shown to be relevant for pollinators’ visit decision, corolla limb and tube characteristics (Ippolito et al. 2004), were also similar between species and AP phenotype classes. The narrow long-tubed flowers—in N. alata, Class I, and Class III—all displayed large and stellate limbs that, combined with the UV-absorbent phenotype, put them in accord with the hawkmoth foraging preferences (Kaczorowski et al. 2012). Along the same axes, pink flowers had the pentagonal to rounded shape, with a lesser degree of limb dissection, that comprised the hummingbird-pollinated species of section Alatae (Kaczorowski et al. 2012).
To fully understand and test whether the atypical phenotypes are, in fact, in total synchrony with expected phenotype of the species, we need to investigate their scent and Circadian emission composition further. The floral scent compositions of N. alata and N. forgetiana are widely known and have different chemical compositions (Raguso et al. 2003). Analyses of floral scent bouquets in Class I and II compared to both species would be useful in improving our knowledge of pollinator interactions in the putative hybrid population. To test whether Class I flowers follow N. alata in oxygenated sesquiterpene and nitrogenous compounds patterns, characteristic of hawkmoth pollinated species. For example, investigate whether Class I flowers follow N. forgetiana in phylogenetically-constrained Circadian regulated emissions, as the oxygenated monoterpene 1,8 cineole (Knudsen and Tollsten 1993, Raguso et al. 2003).
Under experimental conditions, hybrids between these two species attract both parental pollinators, promoting backcrossing between species (Ippolito et al. 2004). These previous findings are supported by the intermediate atypical phenotype—Class III—which not only presents flavonol peaks in the same range as N. alata, but also the same stellate format and size decisive morphology for hawkmoth attractiveness (Ippolito et al. 2004, Kaczorowski et al. 2012). The AP maternal plants presenting expected phenotype of species generating offspring with a segregating phenotype raise questions about backcrossing and introgression effects in allopatric populations that need to be addressed in future studies. In the presence of the attractive ‘scent cloud’, hawkmoths, the pollinators of N. alata, also visit non-odorous flowers with the same UV-absorbent patterns, a characteristic displayed by N. forgetiana and atypical phenotypes (Raguso and Willis 2002). Further studies with those flowers under UV light are required to investigate the putative hybrid resemblance with the expected phenotypes of species and how they present their signals to pollinators by visual and olfactory cues. Moreover, AP individuals provide an excellent opportunity to tease apart the genetic basis of flower colour, shape, and size.
Supplementary data
Supplementary data is available at Botanical Journal of the Linnean Society online.
Table S1. Sampled data of Nicotiana species from the greenhouse used in this study. Seeds from open pollination were collected in the field from the allopatric populations of N. alata and N. forgetiana, and the atypical population (AP; Teixeira et al. 2022), where possible hybrid plants grow. Seeds were collected from different plants and germinated in the grow room. N = number of seeds germinated from each mother plant collected in the field. n = sampling size (number of flowers per individual for each analysis); MP = mother plant from sympatric site AP01. # Number of plants with seeds collected from open pollination. * Number of different genotypes growing in the greenhouse and used in the different analyses. For morphometry, images were gathered for the AVCL and PV. In total, we cultivated in the greenhouse and used in morphometric analyses four genotypes of N. alata (from three mother plants), 12 genotypes of N. forgetiana (from five mother plants), and 39 genotypes of putative hybrids of the AP population (from 13 mother plants) were cultivated in the greenhouse and used in morphometric analyses.
Table S2. Spectral reflectance data for N. alata, N. forgetiana, and AP plants cultivated in the greenhouse. The transmittance (T) and reflectance (R) were obtained from mathematical transformation using the absorbance (A) data collected from corolla tissue.
Table S3. PCA of AVCL view from all populations collected in the field and cultivated in the greenhouse.
Table S4. PCA of PV view from all populations collected in the field and cultivated in the greenhouse.
Table S5. Procrustes distances analyses among two species and the AP population plants. AP population was placed in two groups, one belong plant collected in the field and another the offspring cultivated in the greenhouse.
Figure S1. Flower phenotype comparison between AP mother plants collected in the field and their greenhouse offspring from open-pollinated seeds. Maternal flowers are presented apart from the offspring inside a frame. Class phenotypes are assigned for each maternal flower and offspring.
Figure S2. Colour variability among the flowers. A, Inflated apex of the corolla inner wall pigmentation variability of allopatric N. forgetiana. Top row: Population Forg04; bottom row: Population Forg05. B, The inflated apex of the corolla inner wall pigmentation variability of hybrids. C, Petal pigmentation pattern along the central venation. D, Variation of the intensity of pigmentation of the same individual. E, Flowers with pigmentation only on the abaxial surface. All pictures are not to scale and magnified in to facilitate the visualization of the characteristics shown.
Figure S3. Individual pigment analyses of Nicotiana species from the allopatric and putative hybrid population (AP). Peaks between 300–385 nm in wavelength represent flavonols (UV-B = ~290–320 nm, UV-A = ~320–400 nm), and 400–600 nm in wavelength represents anthocyanins.
Figure S4. Flower shape variation in N. alata, N. forgetiana, and the two generations of the putative hybrid (AP greenhouse and AP field) as indicated by the optimal Gaussian mixture models (GMM), using the first two PCs of variation in corolla tube shape (PV; A) and corolla limb shape (AVCL; B).
Figure S5. Nectar trait characteristics analysis in N. alata, N. forgetiana, and AP populations. (A) Nectar volume (µL), (B) Nectar concentration (% g/g), and (C) Total energy (mg of sugar). The total number for all species and AP phenotypes is presented in Supporting Information, Table S1. Kruskal–Wallis test results are represented by letters. The same letters represent samples with no significant differences (P < 0.01).
Figure S6. Relationship between volume and concentration. Ala, N. alata; Forg, N. forgetiana, yellow triangles: Class I, Green squares: Class II, Light Blue Crosses: Class III, and Dark Blue crosses squared: Class IV.
Acknowledgements
We thank Pedro Pezzi and Carolina Schnitzler for their help in data acquisition. We thank the reviewers for their helpful comments on a previous version of the manuscript.
Funding
This work was supported by the Conselho Nacional de Desenvolvimento Científico e Tecnológico (CNPq—427575/2018-4 and 309797/2022-5 grant to CT), the Universidade Federal do Rio Grande do Sul (UFRGS), Coordenação de Aperfeiçoamento de Pessoal de Nível Superior (CAPES), Fundação de Amparo à Pesquisa do Estado do Rio Grande do Sul (ARD/ARC 10/2021 grant to CT), and Programa de Pós-Graduação Botânica da Universidade Federal do Rio Grande do Sul (PPGBOT-UFRGS). This work was a requisite for M.A.M.S.C. to obtain her MSc degree.
DATA AVAILABILITY
The data underlying this article are available in the article and in its online supplementary material. Further information is available from the corresponding author.
CONFLICT OF INTEREST
The authors declare that they have no conflict of interest.
