


Abstract
Limited liver resections (LLRs) for tumours located in the posterosuperior segments of the liver are technically demanding procedures. This study compared outcomes of robotic (R) and laparoscopic (L) LLR for tumours located in the posterosuperior liver segments (IV, VII, and VIII).
This was an international multicentre retrospective analysis of patients who underwent R-LLR or L-LLR at 24 centres between 2010 and 2019. Patient demographics, perioperative parameters, and postoperative outcomes were analysed; 1 : 3 propensity score matching (PSM) and 1 : 1 coarsened exact matching (CEM) were performed.
Of 1566 patients undergoing R-LLR and L-LLR, 983 met the study inclusion criteria. Before matching, 159 R-LLRs and 824 L-LLRs were included. After 1 : 3 PSM of 127 R-LLRs and 381 L-LLRs, comparison of perioperative outcomes showed that median blood loss (100 (i.q.r. 40–200) versus 200 (100–500) ml; P = 0.003), blood loss of at least 500 ml (9 (7.4 per cent) versus 94 (27.6 per cent); P < 0.001), intraoperative blood transfusion rate (4 (3.1 per cent) versus 38 (10.0 per cent); P = 0.025), rate of conversion to open surgery (1 (0.8 per cent) versus 30 (7.9 per cent); P = 0.022), median duration of Pringle manoeuvre when applied (30 (20–46) versus 40 (25–58) min; P = 0.012), and median duration of operation (175 (130–255) versus 224 (155–300); P < 0.001) were lower in the R-LLR group compared with the L-LLR group. After 1 : 1 CEM of 104 R-LLRs with 104 L-LLRs, R-LLR was similarly associated with significantly reduced blood loss and a lower rate of conversion to open surgery.
Based on a matched analysis of well selected patients, both robotic and laparoscopic access could be undertaken safely with good outcomes for tumours in the posterosuperior liver segments.
Introduction
Minimally invasive liver resection (MILR) has undergone a paradigm shift since the first procedure was performed in 19911. After three consensus meetings and successful creation of the International Laparoscopic Liver Society, the adoption of MILR has been rapidly increasing worldwide2–4. MILR in the anterolateral segments has been considered safe and effective ever since the first consensus meeting in 2008. However, it was only after nearly a decade that MILR for tumours in the posterosuperior segments5 and major resections6, including donor hepatectomy, gained approval as safe procedures7.
The posterosuperior segments are considered ‘difficult segments’ (Fig. 1) because their location high up in the abdominal cavity, beneath the ribs and towards the posterior abdominal wall, makes these segments difficult to access, especially via a minimally invasive approach.
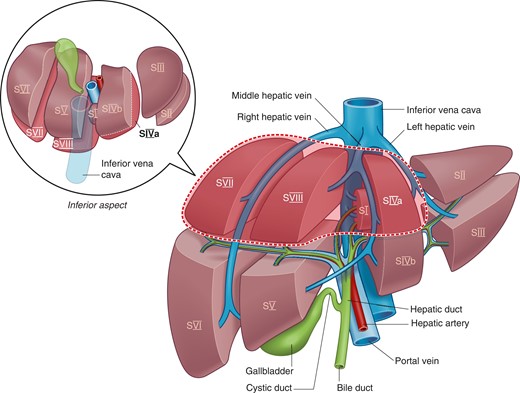
Illustration of posterosuperior liver segments
S, segment.
Hence, when bleeding occurs during MILR, it becomes more challenging to control owing to poor visualization and difficulty in accessing the bleeding site. These limitations also affect the ability of the surgeon to achieve oncological safety by ensuring adequate surgical margins8. There has been an increasing number of studies reporting on MILR for tumours in the posterosuperior segments5,9,10. These studies from expert centres have demonstrated not only the feasibility of MILR for tumours in the posterosuperior segment but also superior perioperative outcomes compared with those of conventional open surgery11–13.
The application of robotic surgery for liver resections is currently gaining traction worldwide14. The added advantages of three-dimensional visualization, better manipulation of instruments, stable movements, and improved dexterity are features that are contributing to increasing adoption of robotic surgery15. These features probably contribute to the reportedly shorter learning curve associated with robotic compared with conventional laparoscopic liver resection14. However, the main barrier to the widespread adoption of robotic surgery is the limited access to the technology resulting from its high cost16. Despite its many theoretical advantages, there is currently limited evidence in the literature demonstrating the clinical advantages of robotic surgery over conventional laparoscopy for liver resection17,18. Furthermore, although it has been postulated that the increased dexterity of the robotic Endowrist® (Intuitive Surgical, Sunnyvale, Ca) would be especially useful for limited resections of tumours located in the posterosuperior segments, there is scant evidence to date supporting this hypothesis19.
Taken the limited available evidence in the literature today, this large multicentre study was conducted with the primary objective of comparing the outcomes of robotic limited liver resections (R-LLRs) versus laparoscopic limited liver resections (L-LLR) for tumours located in the superior segments (VII, VIII, IVa) of the liver. To the best of the authors’ knowledge, this is the largest study to date to compare the outcomes of R-LLR versus L-LLR for tumours in the posterosuperior segments.
Methods
This was an international multicentre retrospective analysis of patients who underwent L-LLR or R-LLR of tumours in the posterosuperior segments (IVa, VII, VIII) (Fig. 1) at 24 centres between 2010 and 2019. The institutions obtained approvals according to their respective local centre’s requirements. This study was approved by the Singapore General Hospital Institution Review Board. As this was a retrospective study of pseudoanonymized data, the need for patient consent was waived. All data were collected centrally and analysed at the Singapore General Hospital.
Only patients who underwent pure laparoscopic or robotic surgery were included. Laparoscopically assisted (hybrid) and hand-assisted laparoscopic resections were excluded. Other study exclusion criteria were patients undergoing multiple concomitant liver resections in different segments, repeat liver resections, or had concomitant other major operations such as colectomy, hepaticojejunostomy, gastrectomy, stoma reversal, or hilar lymphadenectomy.
Patients who had concomitant minor operations such as cholecystectomy or hernia repair were included. The selection of patients is summarized in Fig. S1. All procedures were performed or supervised by specialized liver surgeons of consultant/attending level.
Definitions
The posterosuperior segments included segments VII, VIII and IVa, as defined according to the 2000 Brisbane classification20. Notably, tumours in segment 1 were excluded from this study. LLRs were classified as wedge resection, segmentectomy or bisegmentectomy (segments VII/VIII or IVa/VIII) (Fig. 1). Of note, right posterior sectionectomies, right anterior sectionectomies, and left medial sectionectomies were not considered LLR in this study.
Postoperative complications were graded according to the Clavien–Dindo classification and recorded for up to 30 days or during the same hospital admission21. Difficulty of resections were graded according to the Iwate score22.
Statistical analysis
To ensure the robustness of the conclusions, analyses were carried out using two approaches in the causal inference toolbox for minimizing confounding and selection bias: propensity-score matching (PSM) and coarsened exact matching (CEM).
One-to-one CEM23–26 was used to identify approximately-exact matches between patients who were assigned to R-LLR and L-LLR, and matched for all variables except sex as this factor was not considered to affect outcomes. Continuous variables were coarsened using an automatic binning algorithm based on Sturge’s rule.
Propensity scores27–34 were developed using mixed-effects logistic regression modelling of all variables, with a random-effects term to account for between-centre heterogeneity. This model exhibited good discrimination (area under the curve 0.803, bias-corrected 95 per cent c.i. 0.758 to 0.847) and calibration (P = 0.800 from Hosmer–Lemeshow test with 10 deciles; slope 1.001; calibration in the large −0.000) (Figs S2 and S3). PSM in a 1 : 3 ratio was carried out without replacement within a caliper of 0.25 times the standard deviation of the linear predictor (log odds of the propensity score).
Comparisons of patient characteristics and perioperative outcomes between patients undergoing R-LLR or L-LLR in the unmatched cohort were accomplished using the Mann–Whitney U test and Pearson’s χ2 test for continuous and categorical variables respectively. Comparisons in the PSM and CEM cohorts took into account the paired nature of the data; therefore, mixed-effects regression models (in which a random-intercept was used to denote the matched groups) and conditional logit models were used for continuous and binary variables.
Statistical analyses were done in Stata® version 16.0 (StataCorp, College Station, TX, USA), and two-sided P < 0.050 was considered statistical significant.
Results
Some 983 of 1566 patients who underwent L-LLR or R-LLR of tumours in the posterosuperior segments met the study criteria, of whom 159 underwent R-LLR and 824 underwent L-LLR. There was no significant difference in the distribution of R-LLR and L-LLR over the study interval before and after matching (Fig. 2).
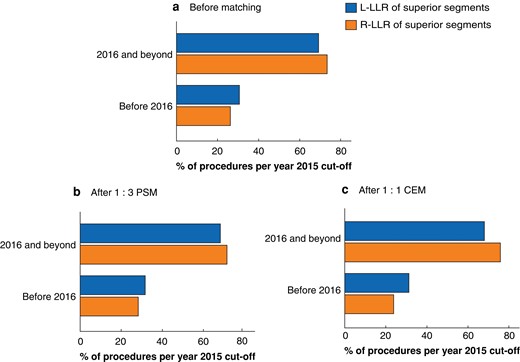
Assessment of bias in historical cohorts
Distribution of procedures over year of surgery in the overall cohort a before matching, b after 1 : 3 propensity score matching (PSM), and c after 1 : 1 coarsened exact matching (CEM). L-LLR, laparoscopic limited liver resection; R-LLR, robotic limited liver resection. a P = 0.280 (Pearson’s test), b P = 0.671 (conditonal logit), c P = 0.358 (McNemar’s test).
Overall clinicopathological features and perioperative outcomes are summarized in Tables 1 and 2. The median duration of operation was 206 (i.q.r. 145–290) min, and there were 57 conversions to open surgery (5.8 per cent). Some 309 patients (31.4 per cent) had cirrhosis and 80 of 981 patients (8.2 per cent) required intraoperative blood transfusion. The overall postoperative morbidity rate was 17.6 per cent (173 patients) and the major morbidity rate was 6.8 per cent (67 patients). The median duration of postoperative hospital stay was 5 (3–7) days.
Comparison of clinicopathological characteristics between robotic and laparoscopic resections in unmatched cohorts
| Total (n = 983) | R-LLR (n = 159) | L-LLR (n = 824) | P* | |
|---|---|---|---|---|
| Age (years), median (i.q.r.) | 62 (52–69) | 61 (50–67) | 62 (53–70) | 0.043† |
| Men | 629 of 983 (64.0) | 105 of 159 (66.0) | 524 of 824 (63.6) | 0.56 |
| ASA fitness grade | <0.001 | |||
| I –II | 686 of 982 (69.9) | 91 of 159 (57.2) | 595 of 823 (72.3) | |
| III–IV | 296 of 982 (30.1) | 68 of 159 (42.8) | 228 of 823 (27.7) | |
| Previous abdominal surgery | 385 of 983 (39.2) | 56 of 159 (35.2) | 329 of 824 (39.9) | 0.266 |
| Previous liver surgery | 3 of 983 (0.3) | 1 of 159 (0.6) | 2 of 824 (0.2) | 0.419 |
| Malignant pathology | 836 of 983 (85.0) | 136 of 159 (85.5) | 700 of 824 (85.0) | 0.850 |
| Pathological type | 0.375 | |||
| HCC | 477 of 983 (48.5) | 85 of 159 (53.5) | 392 of 824 (47.6) | |
| CRM | 264 of 983 (26.9) | 40 of 159 (25.2) | 224 of 824 (27.2) | |
| Others | 242 of 983 (24.6) | 34 of 159 (21.4) | 208 of 824 (25.2) | |
| Cirrhosis | 309 of 983 (31.4) | 52 of 159 (32.7) | 257 of 824 (31.2) | 0.706 |
| Child–Pugh class | 0.047 | |||
| No cirrhosis | 674 of 983 (68.6) | 107 of 159 (67.3) | 567 of 824 (68.8) | |
| A | 290 of 983 (29.5) | 45 of 159 (28.3) | 245 of 824 (29.7) | |
| B | 19 of 983 (1.9) | 7 of 159 (4.4) | 12 of 824 (1.5) | |
| Portal hypertension | 81 of 983 (8.2) | 11 of 159 (6.9) | 70 of 824 (8.5) | 0.508 |
| Tumour size (mm), median (i.q.r.) | 25 (17–36) | 28 (17–40) | 25 (17–35) | 0.113† |
| Multiple tumours | 67 of 983 (6.8) | 11 of 159 (6.9) | 56 of 824 (6.8) | 0.955 |
| Resection type | 0.456 | |||
| Wedge | 651 of 983 (66.2) | 111 of 159 (69.8) | 540 of 824 (65.5) | |
| Segmentectomy | 312 of 983 (31.7) | 44 of 159 (27.7) | 268 of 824 (32.5) | |
| Bisegmentectomy | 20 of 983 (2.0) | 4 of 159 (2.5) | 16 of 824 (1.9) | |
| Iwate grade | 0.003 | |||
| Low | 2 of 983 (0.2) | 1 of 159 (0.6) | 1 of 824 (0.1) | |
| Intermediate | 575 of 983 (58.5) | 75 of 159 (47.2) | 500 of 824 (60.7) | |
| High | 348 of 983 (35.4) | 67 of 159 (42.1) | 281 of 824 (34.1) | |
| Expert | 58 of 983 (5.9) | 16 of 159 (10.1) | 42 of 824 (5.1) |
Values are n (%) unless otherwise indicated. For categorical variables, denominators may differ from total numbers owing to missing data. R-LLR, robotic limited liver resection; L-LLR, laparoscopic limited liver resection; HCC, hepatocellular carcinoma; CRM, colorectal liver metastases. *Pearson’s χ2 test, except †Mann–Whitney U test. Detailed balance diagnostics (Love plots) showing the standardized differences before and after matching can be found in Fig. S6.
Comparison between R-LLR and L-LLR in entire unmatched cohort
Table 1 shows the preoperative characteristics of patients in both groups, and perioperative outcomes are compared between R-LLR and L-LLR in Table 2. There were significant differences in the median operating time, median blood loss, blood loss of at least 500 ml, intraoperative blood transfusion, median duration of Pringle manoeuvre, conversion to open surgery, median duration of postoperative stay, and major morbidity in the unmatched cohort.
Comparison between perioperative outcomes of robotic and laparoscopic approaches in unmatched cohort
| Total (n = 983) | R-LLR (n = 159) | L-LLR (n = 824) | Effect size* | P‡ | |
|---|---|---|---|---|---|
| Duration of operation (min), median (i.q.r.) | 206 (145–290) | 184 (135–277) | 210 (150–293) | MD −26 (−47, −5) | 0.016§ |
| Blood loss (ml), median (i.q.r.) | 150 (50–400) | 100 (50–200) | 200 (50–450) | MD −100 (−159,−41) | 0.001§ |
| Blood loss (ml) | OR 0.41 (0.24, 0.70) | 0.001 | |||
| < 500 | 692 of 879 (78.7) | 136 of 153 (88.9) | 556 of 726 (76.6) | ||
| ≥ 500 | 187 of 879 (21.3) | 17 of 153 (11.1) | 170 of 726 (23.4) | ||
| Intraoperative blood transfusion | 80 of 981 (8.2) | 6 of 159 (3.8) | 74 of 822 (9.0) | OR 0.40 (0.17, 0.93) | 0.033 |
| Pringle manoeuvre applied | 434 of 974 (44.6) | 68 of 159 (42.8) | 366 of 815 (44.9) | OR 0.92 (0.65, 1.29) | 0.619 |
| Duration of Pringle manoeuvre when applied (min), median (i.q.r.) | 35 (22–50) | 25 (20–40) | 35 (25–50) | MD −11 (−18, −4) | 0.003§ |
| Conversion to open operation | 57 of 983 (5.8) | 1 of 159 (0.6) | 56 of 824 (6.8) | OR 0.09 (0.01, 0.63) | 0.016 |
| Duration of postoperative hospital stay (days)† | IRR 0.86 (0.77, 0.95) | 0.005 | |||
| Median (i.q.r.) | 5 (3–7) | 5 (3–6) | 5 (3–7) | ||
| Mean(s.d.) | 5.9(4.6) | 5.1(3.5) | 6.0(4.8) | ||
| 30-day readmission | 21 of 983 (2.1) | 1 of 159 (0.6) | 20 of 824 (2.4) | OR 0.25 (0.03, 1.91) | 0.183 |
| Postoperative morbidity | 173 of 983 (17.6) | 28 of 159 (17.6) | 145 of 824 (17.6) | OR 1.00 (0.64, 1.56) | 0.997 |
| Major morbidity (Clavien–Dindo grade > II) | 67 of 983 (6.8) | 5 of 159 (3.1) | 62 of 824 (7.5) | OR 0.40 (0.16, 0.98) | 0.045 |
| Reoperation | 8 of 983 (0.8) | 2 of 159 (1.3) | 6 of 824 (0.7) | OR 1.74 (0.35, 8.68) | 0.501 |
| 30-day mortality | 5 of 983 (0.5) | 1 of 159 (0.6) | 4 of 824 (0.5) | OR 1.30 (1.14, 11.69) | 0.816 |
| In-hospital mortality | 6 of 983 (0.6) | 1 of 159 (0.6) | 5 of 824 (0.6) | OR 1.04 (0.12, 8.93) | 0.974 |
| 90-day mortality | 7 of 983 (0.7) | 1 of 159 (0.6) | 6 of 824 (0.7) | OR 0.86 (0.10, 7.22) | 0.892 |
| Close/involved margins (≤ 1 mm) for malignancies | 154 of 833 (18.5) | 23 of 136 (16.9) | 131 of 697 (18.8) | OR 0.88 (0.54, 1.43) | 0.605 |
Values are n (%) unless otherwise indicated; *values in parentheses are 95 per cent confidence intervals. For categorical variables, denominators may differ from total numbers owing to missing data. R-LLR, robotic limited liver resection; L-LLR, laparoscopic limited liver resection; OR, conditional OR; MD, median difference; IRR, incidence rate ratio. †Duration of postoperative hospital stay (days) was regarded as count data and analysed using negative binomial models. ‡Pearson’s χ2 test, except §Mann–Whitney U test.
Comparison between R-LLR and L-LLR in matched cohorts
To ensure unbiased analysis, 1 : 3 PSM and further 1 : 1 CEM were performed. After matching, both groups were well balanced for all variables (Table 3 and Figs S4–S6). Standardized differences of less than 0.1 (or 10 per cent) may be interpreted to indicate a negligible difference in the mean or proportion of a continuous or categorical variable respectively (Fig. S6)35. After PSM, 127 patients remained in the R-LLR group and 381 in the L-LLR group. The number in each group reduced further to 104 after CEM (Table 3).
Comparison of clinicopathological characteristics between robotic and laparoscopic approaches after propensity score matching and coarsened exact matching
| 1 : 3 propensity-matched cohort | 1 : 1 coarsened exact-matched cohort | |||||
|---|---|---|---|---|---|---|
| R-LLR (n = 127) | L-LLR (n = 381) | P | R-LLR (n = 104) | L-LLR (n = 104) | P* | |
| Age (years), median (i.q.r.) | 62 (51–68) | 60 (50–69) | 0.878 | 62 (53–68) | 63 (50–70) | 0.813 |
| Men | 82 of 127 (65.6) | 251 of 381 (65.9) | 0.789 | 70 of 104 (67.3) | 68 of 104 (65.4) | 0.769 |
| ASA fitness grade | 0.954 | 1 | ||||
| I–II | 73 (127 (57.5) | 220 of 293 (57.7) | 64 of 104 (58.7) | 64 of 104 (58.7) | ||
| III–IV | 54 of 127 (42.5) | 161 of 381 (42.3) | 45 of 104 (41.3) | 45 of 104 (41.3) | ||
| Previous abdominal surgery | 45 of 127 (35.4) | 128 of 381 (33.6) | 0.701 | 42 of 104 (40.4) | 42 of 104 (40.4) | 1 |
| Previous liver surgery | 1 of 127 (0.8) | 2 of 381 (0.5) | 0.741 | 0 of 104 (0.0) | 0 of 104 (0.0) | 1 |
| Malignant pathology | 105 of 127 (82.7) | 322 of 381 (84.5) | 0.625 | 91 of 104 (87.5) | 91 of 104 (87.5) | 1 |
| Pathological type | 0.795 | 1 | ||||
| HCC | 62 of 127 (48.8) | 199 of 381 (52.2) | 54 of 104 (51.9) | 54 of 104 (51.9) | ||
| CRM | 33 of 127 (26.0) | 94 of 381 (24.7) | 30 of 104 (28.8) | 30 of 104 (28.8) | ||
| Others | 32 of 127 (25.2) | 88 of 381 (23.1) | 20 of 104 (19.2) | 20 of 104 (19.2) | ||
| Cirrhosis | 43 of 127 (33.9) | 131 of 381 (34.4) | 0.914 | 32 of 104 (30.8) | 32 of 104 (30.8) | 1 |
| Child–Pugh class | 0.718 | 1 | ||||
| No cirrhosis | 84 of 127 (66.1) | 250 of 381 (65.6) | 72 of 104 (69.2) | 72 of 104 (69.2) | ||
| A | 38 of 127 (29.9) | 121 of 381 (31.8) | 30 of 104 (28.8) | 30 of 104 (28.8) | ||
| B | 5 of 127 (3.9) | 10 of 381 (2.6) | 2 of 104 (1.9) | 2 of 104 (1.9) | ||
| Portal hypertension | 9 of 127 (7.1) | 33 of 381 (8.7) | 0.571 | 7 of 104 (6.7) | 7 of 104 (6.7) | 1 |
| Tumour size (mm), median (i.q.r.) | 25 (16–35) | 25 (17–35) | 0.793 | 25 (16–35) | 25 (18–35) | 0.880 |
| Multiple tumours | 9 of 127 (7.1) | 30 of 381 (7.9) | 0.778 | 3 of 104 (2.9) | 3 of 104 (2.9) | 1 |
| Resection type | 0.868 | 1 | ||||
| Wedge | 84 of 127 (66.1) | 245 of 381 (64.3) | 72 of 104 (69.2) | 72 of 104 (69.2) | ||
| Segmentectomy | 40 of 127 (31.5) | 124 of 381 (32.5) | 31 of 104 (29.8) | 31 of 104 (29.8) | ||
| Bisegmentectomy | 3 of 127 (2.4) | 12 of 381 (3.1) | 1 of 104 (1.0) | 1 of 104 (1.0) | ||
| Iwate grade | 0.927 | 1 | ||||
| Low | 0 of 127 (0.0) | 1 of 381 (0.3) | 0 of 104 (0.0) | 0 of 104 (0.0) | ||
| Intermediate | 72 of 127 (56.7) | 211 of 381 (55.4) | 64 of 104 (61.5) | 64 of 104 (61.5) | ||
| High | 44 of 127 (34.6) | 138 of 381 (36.2) | 32 of 104 (30.8) | 32 of 104 (30.8) | ||
| Expert | 11 of 127 (8.7) | 31 of 381 (8.1) | 8 of 104 (7.7) | 8 of 104 (7.7) | ||
Values are n (%) unless otherwise indicated. For categorical variables, denominators may differ from total numbers owing to missing data. R-LLR, robotic limited liver resection; L-LLR, laparoscopic limited liver resection; HCC, hepatocellular carcinoma; CRM, colorectal liver metastases. Detailed balance diagnostics (Love plots) showing the standardized differences before and after matching can be found in Fig. S6. *Mixed-effects regression models (in which a random-intercept was used to denote the matched groups) and conditional logit models were used for continuous and binary variables respectively.
After PSM, patients were matched adequately for preoperative characteristics including cirrhosis, Child–Pugh class, median tumour size, and Iwate grade (Table 3 and Fig. S6). Comparison of perioperative outcomes demonstrated that median blood loss (100 (i.q.r. 40–200) versus 200 (100–500) ml; P = 0.003), blood loss of at least 500 ml (9 (7.4 per cent) versus 94 (27.6 per cent); P < 0.001), intraoperative blood transfusion rate (4 (3.1 per cent) versus 38 (10.0 per cent); P = 0.025), open conversion rate (1 (0.8 per cent) versus 30 (7.9 per cent); P = 0.022), median duration of Pringle manoeuvre when applied (30 (20–46) versus 40 (25–58) min; P = 0.012), and median operating time (175 (130–255) versus 224 (155–300) min; P < 0.001) were lower for R-LLR than L-LLR. There was, however, no significant difference in other outcomes between the groups (Table 4).
Comparison between perioperative outcomes of robotic and laparoscopic approach after after propensity score matching and coarsened exact matching
| 1 : 3 propensity-matched cohort | 1 : 1 coarsened exact-matched cohort | |||||||
|---|---|---|---|---|---|---|---|---|
| R-LLR (n = 127) | L-LLR (n = 381) | Effect size* | P | R-LLR (n = 104) | L-LLR (n = 104) | Effect size* | P | |
| Duration of operation (min), median (i.q.r.) | 175 (130–255) | 224 (155–300) | MD −50 (−75, 25) | < 0.001 | 175 (130–245) | 210 (145–272) | MD −35 (−68, −2) | 0.035 |
| Blood loss (ml), median (i.q.r.) | 100 (40–200) | 200 (100–500) | MD −100 (−166,−34) | 0.003 | 100 (30–200) | 200 (100–400) | MD −100 (−127, −73) | <0.001 |
| Blood loss (ml) | OR 0.19 (0.09, 0.40) | 0.001 | OR 0.24 (0.10, 0.57) | 0.001 | ||||
| < 500 | 112 of 121 (92.6) | 247 of 341 (72.4) | 91 of 98 (92.9) | 67 of 91 (73.6) | ||||
| ≥ 500 | 9 of 121 (7.4) | 94 of 341 (27.6) | 7 of 98 (7.1) | 24 of 91 (26.4) | ||||
| Intraoperative blood transfusion | 4 of 127 (3.1) | 38 of 380 (10.0) | OR 0.30 (0.11, 0.86) | 0.025 | 4 of 104 (3.8) | 6 of 104 (5.8) | OR 0.66 (0.18, 2.38) | 0.521 |
| Pringle manoeuvre applied | 57 of 127 (44.9) | 172 of 376 (45.7) | OR 0.97 (0.65, 1.44) | 0.880 | 48 of 104 (46.2) | 40 of 103 (38.8) | OR: 1.44 (0.79, 2.63) | 0.234 |
| Duration of Pringle manoeuvre when applied (min), median (i.q.r.) | 30 (20–46) | 40 (25–58) | MD −10 (−18, −2) | 0.012 | 30 (20–40) | 31 (20–45) | MD 0 (−11 to 11) | 1.000 |
| Conversion to open operation | 1 of 127 (0.8) | 30 of 381 (7.9) | OR 0.10 (0.01, 0.72) | 0.022 | 1 of 104 (1.0) | 9 of 104 (8.7) | OR 0.11 (0.01, 0.85) | 0.034 |
| Duration of postoperative hospital stay (days)† | IRR 0.89 (0.77, 1.02) | 0.081 | IRR 1.00 (0.86, 1.17) | 0.931 | ||||
| Median (i.q.r.) | 5 (3–6) | 5 (3–8) | 5 (3–6) | 6 (4–7) | ||||
| Mean(s.d.) | 5.5(3.7) | 6.4(5.7) | 5.6(3.6) | 5.6(3.6) | ||||
| 30-day readmission | 1 of 127 (0.8) | 9 of 381 (2.4) | OR 0.33 (0.04, 2.63) | 0.297 | 1 of 104 (1.0) | 1 of 104 (1.0) | OR 1.00 (0.06, 15.99) | 1.000 |
| Postoperative morbidity | 22 of 127 (17.3) | 71 of 381 (18.6) | OR 0.92 (0.54, 1.54) | 0.743 | 17 of 104 (16.3) | 18 of 104 (17.3) | OR 1.00 (0.06, 15.99) | 1.000 |
| Major morbidity (Clavien-Dindo grade > II) | 4 of 127 (3.1) | 31 of 381 (8.1) | OR 0.37 (0.13, 1.07) | 0.066 | 4 of 104 (3.8) | 5 of 104 (4.8) | OR 0.79 (0.21, 3.04) | 0.734 |
| Reoperation | 2 of 127 (1.6) | 3 of 381 (0.8) | OR 2.00 (0.33, 11.97) | 0.448 | 2 of 104 (1.9) | 0 of 104 (0) | 0.157‡ | |
| 30-day mortality | 1 of 127 (0.8) | 0 of 381 (0) | 0.371 | 0 of 104 (0) | 0 of 104 (0) | 1.000‡ | ||
| In-hospital mortality | 1 of 127 (0.8) | 1 of 381 (0.3) | 0.438 | 0 of 104 (0) | 0 of 104 (0) | 1.000‡ | ||
| 90-day mortality | 1 of 127 (0.8) | 1 of 381 (0.3) | 0.438 | 0 of 104 (0.0) | 0 of 104 (0.0) | 1.000‡ | ||
| Close/involved margins (≤ 1 mm) for malignancies | 18 of 105 (17.1) | 61 of 322 (18.9) | OR 0.92 (0.51, 1.65) | 0.768 | 14 of 91 (15.4) | 14 of 91 (15.4) | OR 1.00 (0.44, 2.28) | 1.000 |
Values are n (%) unless otherwise indicated; *values in parentheses are 95 per cent confidence intervals. For categorical variables, denominators may differ from total numbers owing to missing data. R-LLR, robotic limited liver resection; L-LLR, laparoscopic limited liver resection; OR, conditional OR; MD, median difference; IRR, incidence rate ratio.†Duration of postoperative hospital stay (days) was regarded as count data and analysed using negative binomial models. ‡Not estimable using conditional logistic regression because of zero events or non-convergence, so P value from McNemar’s χ2 test is shown.
The results after CEM showed a significant difference in the median duration of operation (P = 0.035), median blood loss (P < 0.001), and blood loss of at least 500 ml (P = 0.001), but no significant difference in intraoperative transfusion rate (P = 0.521) between the two groups. There was no difference in the median duration of Pringle manoeuvre (P = 1.000); however, there still remained a higher rate of conversion to open surgery in the L-LLR group (P = 0.034). Other key perioperative outcomes, including median postoperative stay (P = 0.931), 30-day readmission (P = 1.000), as well as morbidity (P = 1.000) and mortality (P = 1.000) rates, remained similar for the two approaches (Table 4).
Discussion
In this matched study of selected patients, both robotic and laparoscopic access for limited liver resections were associated with safe outcomes for tumours in the posterosuperior segments in well selected patients. Robotic resection was associated with less blood loss, a shorter operating time, and lower rate of conversion to open surgery than laparoscopic access.
Liver resection for tumours in the posterosuperior segments poses a challenge mainly because of its location behind the ribs. These resections present difficulty for surgeons even in open surgery, leading to larger incisions to obtain adequate exposure and greater blood loss. Liver resection by open surgery for small tumours in these difficult locations frequently leads to a large incision, resulting in greater physiological insult from the trauma of the surgical incision than from the liver resection itself. The pain resulting from this long incision is frequently the main determinant of the patient’s postoperative recovery36. Although MILR for tumours in the posterosuperior segments has been proposed to overcome these limitations of open surgery, the difficulty of performing L-LLR for tumours located in the posterosuperior segment has been well established11,37. Numerous studies have demonstrated inferior perioperative outcomes of LLR for posterosuperior segments, such as increased operating time, longer hospital stay, increased open conversion rate, and greater blood loss, compared with those after resections for tumours in the anterolateral segments9.
During the second international consensus meeting in 2015, LLR was considered a relative contraindication to liver resection for tumours in the posterosuperior segment3. However, with increasing experience, laparoscopy has now been shown to be associated with outcomes similar to and even superior to those of open surgery12,13. Nonetheless, it must be acknowledged that numerous challenges exist when L-LLR is performed for tumours in the posterosuperior segments. The two-dimensional vision, along with the limited degree of freedom and difficulty in manipulating rigid instruments in a curvilinear plane of the posterior section, frequently lead to inadequate exposure as well as difficulty in arresting haemorrhage, especially from large blood vessels such as the hepatic veins38. Nonetheless, recent technological advancements have made laparoscopy technically less challenging. These include introduction of the flexible three-dimensional laparoscope, which improves visualization of the surgical field, as well as the adoption of new techniques to approach this difficult-to-access region, such as the use of intercostal ports39–41.
MILR for tumours in the posterosuperior segments is well established in many expert centres42. However, it is important to emphasize that MILR for such tumours should be undertaken only when surgeons have mounted their learning curve for simpler MILR. Surgeons should always adopt a stepwise approach, with proper selection of patients when attempting more complicated MILR, such as resection of tumours located in the posterosuperior segments42. Several retrospective comparative studies11–13 have reported superior perioperative outcomes of LLR over open surgery for tumours in the posterosuperior segment without compromising oncological safety. A recent subset analysis of the OSLO-COMET RCT43 showed comparable perioperative outcomes between laparoscopy and open surgery for tumours in the posterosuperior segments.
Robotic surgery has been applied for liver resections in order to overcome the limitations of conventional laparoscopy, particularly for tumours in the posterosuperior segments44,45. The technical advantages of R-LLR over L-LLR include improved three-dimensional vision, along with elimination of tremor, and improved dexterity from the Endowrist may theoretically be particularly advantageous for tumours located in the posterosuperior segments46,47. However, potential limitations of robotic surgery include lack of availability of instruments such as the Cavitron Ultrasonic Surgical Aspirator (CUSA), which is widely used for parenchymal transection in both open and laparoscopic liver surgery. Hence, results from studies48–52 comparing the outcomes of R-LLR versus L-LLR are mixed, and the superiority of robotic liver resection remains unclear, despite its higher costs. A recent systematic review14 analysing the learning curves of MILR suggested that a potential advantage of robotic surgery was that it was associated with a shorter learning curve than laparoscopy. Furthermore, in a multicentre study by Nota et al.53 comparing 51 robotic with 145 open minor liver resections in the posterosuperior segments, robotic surgery was reported to be safe and feasible, and associated with a shorter hospital stay. This was in contrast to an earlier study19 which reported that laparoscopic resection was associated with a higher complication rate than robotic resections.
There are limited data in the literature comparing the outcomes of patients undergoing R-LLR versus L-LLR specifically for tumours in the posterosuperior segments54,55. In the present study, after matching, R-LLR was associated with a significantly shorter operating time, lower rate of conversion to open surgery, decreased blood loss, and lower blood transfusion rate than L-LLR. There are several possible reasons for these findings. First, the superior perioperative outcomes of R-LLR may be due to the technical advantages of the robotic platform; in particular, the wristed instruments result in superior dexterity and easier access to the posterosuperior segments compared with rigid laparoscopic instruments. This may enable surgeons to quickly control bleeding, particularly from hepatic vein tributaries, by suturing the bleeding site, which is more difficult to perform laparoscopically. Second, a potential major confounding factor is the experience of the surgeon. It is likely that many of the surgeons performing R-LLR would have had previous experience with L-LLR before embarking on R-LLR. Furthermore, it is important to highlight that, because of the high barrier of entry to robotic surgery owing to its limited accessibility, it is likely that mainly experienced surgeons with a keen interest in MILR would have committed the time to perform R-LLR. This contrasts with the situation for laparoscopic surgery: a larger number of surgeons with a broader range of experience would have performed L-LLR because of its easier accessibility. Finally, because of the higher costs associated with R-LLR and increased patient expectations, surgeons may have adopted more stringent selection criteria when performing R-LLR and this may have accounted for the extremely low open conversion rate of only 0.6 per cent.
Two statistical methods were used in this study to improve the robustness of the analyses. PSM is widely used to reduce selection bias by largely balancing the cohorts, but has the main limitation of overlooking unmeasured confounding variables that may have an influence on outcomes. Therefore, CEM was also performed which, unlike PSM, has been shown to yield estimates of causal effects that are lowest in variance and bias for any given sample size56. With the use of two matching modalities, the robustness of the analysis was strengthened as the results from both methods were consistent.
The main limitation of this study is its retrospective nature which is inevitably associated with information and selection bias. Although, PSM and CEM were undertaken to mitigate these biases, residual biases were likely to remain which could only be completely eliminated by performing a prospective RCT. Data on certain factors that may have affected outcomes, for example the exact location of tumour in the superficial or deep segment of the liver, were not available and could not be matched. Furthermore, as this was a multicentre study, the participating surgeons used various techniques and instruments to perform R-LLR and L-LLR. There was also likely to be variation in the expertise and experience of the surgeons and centres. Another potential confounding factor was that it is conceivable that surgeons performing R-LLR in general had already been trained in laparoscopic surgery and then moved on to robotic surgery. This could mean that surgeons in the robotic group were more experienced than those in the laparoscopic group. As information on the cumulative experience of each participating centre and individual surgeons in MILR was not known, it was not possible to determine and control for biases resulting from surgeon or centre experience. A major strength of this study was the large number of procedures performed over a relatively short interval, allowing robust statistical analysis. The effect of the pioneering phase and learning curve was minimized by limiting the analysis to between 2010 and 2019. Furthermore, there was no significant difference in the proportion of R-LLR and L-LLR over the study interval, suggesting absence of historical bias.
Collaborators
International robotic and laparoscopic liver resection study group investigators: M. Gastaca (Biocruces Bizkaia Health Research Institute, Cruces University Hospital, University of the Basque Country, Bilbao, Spain), H. Schotte, C. De Meyere (Groeninge Hospital, Kortrijk, Belgium), E. C. Lai (Pamela Youde Nethersole Eastern Hospital, Hong Kong SAR, China), F. Krenzien, M. Schmelzle (Campus Charité Mitte and Campus Virchow-Klinikum, Charité-Universitätsmedizin, Corporate Member of Freie Universität Berlin, and Berlin Institute of Health, Berlin, Germany), P. Kadam (University Hospitals Birmingham NHS Foundation Trust, Birmingham, United Kingdom), M. Giglio, R. Montalti (Federico II University Hospital Naples, Naples, Italy), Q. Liu (The First Medical Center of Chinese People’s Liberation Army (PLA) General Hospital, Beijing, China), K. F. Lee (Prince of Wales Hospital, The Chinese University of Hong Kong, New Territories, Hong Kong SAR, China, D. Salimgereeva, R. Alikhanov (Moscow Clinical Scientific Center, Moscow, Russia), L. S. Lee (Changi General Hospital, Singapore), J. Y. Jang (CHA Bundang Medical Center, CHA University School of Medicine, Seongnam, Korea), C. Lim (Hopital Pitie-Salpetriere, APHP, Sorbonne Université, Paris, France), K. P. Labadie (University of Washington Medical Center. Seattle, USA).
Funding
Dr Kingham was partially supported by the US National Cancer Institute MSKCC Core [Grant number P30 CA008747].
Disclosure
The authors declare no conflict of interest. The following authors have disclosures outside of this work. B.K.P.G. has received travel grants and honoraria from Johnson and Johnson and Transmedic, the local distributor for the Da Vinci® robot; M.V.M is a consultant for CAVA Robotics. J.P. reports a research grant from Intuitive Surgical, and personal fees or non-financial support from Johnson & Johnson, Medtronic, AFS Medical, Astellas, CHG Meridian, Chiesi, Falk Foundation, La Fource Group, Merck, Neovii, NOGGO, pharma-consult Peterson, and Promedicis. M. Schmelzle reports personal fees or other support outside of the submitted work from Merck, Bayer, ERBE, Amgen, Johnson & Johnson, Takeda, Olympus, Medtronic, and Intuitive. F. R. reports speaker fees and support outside the submitted work from Integra, Medtronic, Olympus, Corza, Sirtex, and Johnson & Johnson.
Supplementary material
Supplementary material is available at BJS online.
References
Author notes
Members of the international robotic and laparoscopic liver resection study group are co-authors of this study and are listed under the heading Collaborators.
