


T2-FLAIR mismatch sign has been advocated to be 100% specific for IDH-mutant 1p/19q non-codeleted gliomas (diffuse astrocytomas). However, false positives have been reported in recent works. Loose application of the criteria may lead to erroneous classification, especially by non-trained neuroradiologists. In this pictorial essay, we aim to bring attention to the need for strict criteria for the application of T2-FLAIR mismatch sign and to discuss the potential pitfalls in the application of these criteria. For that, a series of adult brain tumour cases are presented to demonstrate how to apply this radiological sign in the clinical practice.
Background
Since the reformulation of World Health Organization (WHO) Classification of Tumours of the central nervous system (CNS) in 2016,1 molecular and genetic features have been integrated in the classification criteria in addition to the histopathological features previously reported. Brain tumours are classified based on their cell lineage of origin, and gliomas are a subset of tumours that originate from the supporting glial cells within the CNS. Based on histopathology, gliomas are further classified in grades: Grade I tumours, Grade II tumours (diffuse astrocytomas or oligodendrogliomas), Grade III tumours (anaplastic astrocytomas or oligodendrogliomas), and Grade IV tumours (high-grade gliomas, referring to glioblastomas). New molecular features as the isocitrate dehydrogenase (IDH) mutation2 and 1p/19q codeletion status3 are now the core for the classification of gliomas,allowing both the diagnosis (with 1p/19q codeletion defining the oligodendrogial lineage) and prognosis stratification.4 The presence of IDH mutation and 1p/19q codeletion are usually associated with better outcomes.4
With the advent of radiogenomics, efforts have combined to acquire non-invasive pre-operative biomarkers that point to a specific diagnosis and thus allowing a tailored therapeutic approach. The 2- fluid attenuated inversion recovery (T2-FLAIR) mismatch sign is one example, as it has been described to be 100% specific for IDH-mutant 1p/19q non-codeleted gliomas,5–8 and thus established as a surrogate marker of tumour molecular status.
Despite the claimed specificity of the mismatch sign, some recent works have brought to light the possibility of false positives.9–11
This work aims to review the application of T2-FLAIR mismatch sign with emphasis on image pearls and potential pitfalls. Through several cases we highlight the need for a strict criteria application while discussing the main imaging features of this radiological sign.
T2-FLAIR mismatch sign
The presence of T2-FLAIR mismatch sign is considered based on the original description of the sign by Patel et al8 with the following criteria: (1) T2 complete or near-complete homogenous hyperintense signal; (2) attenuation of FLAIR signal intensity, with a bright peripheral rim. Although not discriminated as a criterion by Patel et al8, posteriorly published data suggest absence of contrast enhancement as an additional feature to support mismatch sign positivity.12 Homogeneity of FLAIR signal attenuation is not addressed by Patel et al8, but recent works support inclusion of tumours with inhomogeneous FLAIR suppression.12 Nevertheless, caution should be taken when focal low signal FLAIR intensity is observed, as it can correspond to cystic/necrotic areas, which excludes the mismatch sign. Table 1 summarises the core criteria and additional features of the T2-FLAIR mismatch sign.
T2-FLAIR mismatch sign criteria.
| Core inclusion criteria for T2-FLAIR mismatch sign |
|
| Additional features for T2-FLAIR mismatch sign application |
|
| Core inclusion criteria for T2-FLAIR mismatch sign |
|
| Additional features for T2-FLAIR mismatch sign application |
|
FLAIR, fluid attenuated inversion recovery.
In concordance with the previously described criteria for the presence of T2-FLAIR mismatch sign, we herein present three typical cases with positive mismatch sign, two diffuse astrocytomas and one anaplastic astrocytoma (Figure 1).
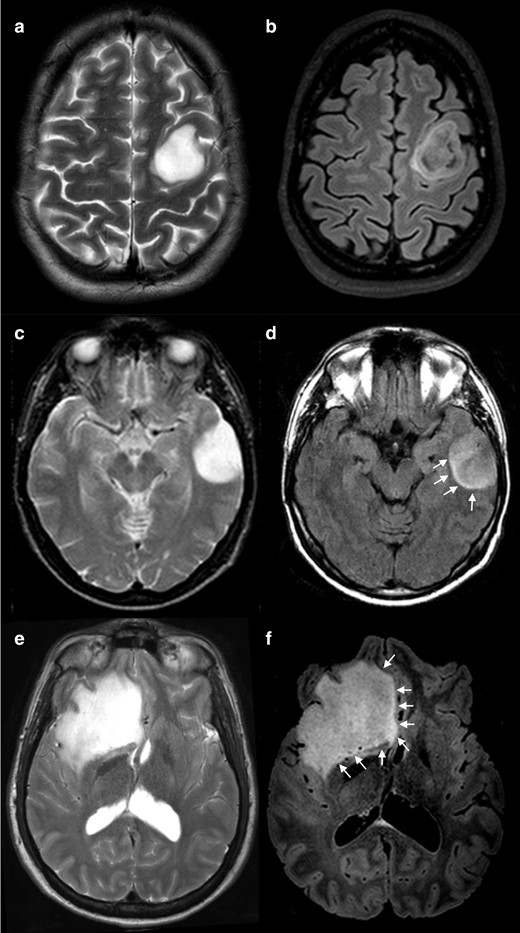
Positive cases for T2-FLAIR mismatch. T2 WI show a complete and homogeneous hyperintense signal (a, c and e) while on FLAIR sequences (b, d and f) the lesions show relatively hypointense signal when compared with T 2WI, except for a peripheral rim of hyperintense signal. Note that the degree of suppression on FLAIR imaging can be uniform (d and f) or inhomogeneous (b). Also, the peripheral high signal rim can be a thin contour circumscribing the whole lesion (b), or it can be an incomplete rim (d and f, arrows). (a, b) and (e, f) were IDH-mutant 1p/19q non-codeleted diffuse astrocytomas (grade II) and C-D was an IDH-mutant 1p/19q non-codeleted anaplastic astrocytoma (grade III). FLAIR, fluid attenuated inversion recovery; IDH, isocitrate dehydrogenase; WI, weighted image.
Equivocal cases are often encountered in clinical practice, therefore we further include several cases to discuss the application of T2-FLAIR mismatch criteria.
Application of T2-FLAIR mismatch sign criteria
Homogeneous T2 hyperintensity
The presence of a homogeneous T2 hyperintensity, either complete or near complete, is a core criterion for the evaluation of mismatch T2/FLAIR sign presence.
Indeed, we herein present four cases that, if ignored this criterion, would be wrongfully characterized as mismatch positive.
In case 1 (Figure 2) it is notorious the central attenuation on FLAIR sequence with a higher signal on the periphery, although not a nicely delineated rim. Likewise, Case 2 (Figure 3) mimics an attenuation on FLAIR image, even with the presence of a high peripheral rim. Nevertheless, these cases present a heterogeneous T2 hyperintensity and are thus considered mismatch T2/FLAIR negative. Both cases were IDH-mutant 1p/19q codeleted oligodendrogliomas. Case 3 and 4 (Figure 4) had heterogeneous T2 sign and patchy FLAIR attenuation and were accordingly not considered to have positive T2-FLAIR mismatch, although they both were IDH-mutant 1p/19q non-codeleted diffuse astrocytomas.
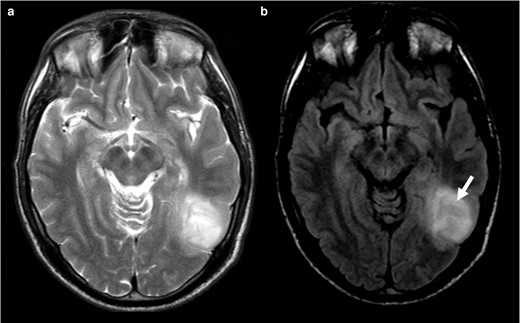
T2WI (a) shows a corticosubcortical lesion on the posterior temporal region on the left, without perfect homogenous high signal. On the FLAIR (b) image, the lesion displays central attenuation (arrow) with higher signal on periphery, however it does not have a nicely delineated rim). This should not be considered a T2-FLAIR mismatch sign. In this case the tumour was an IDH-mutant 1p/19q codeleted oligodendroglioma. FLAIR, fluid attenuated inversion recovery; IDH, isocitrate dehydrogenase.
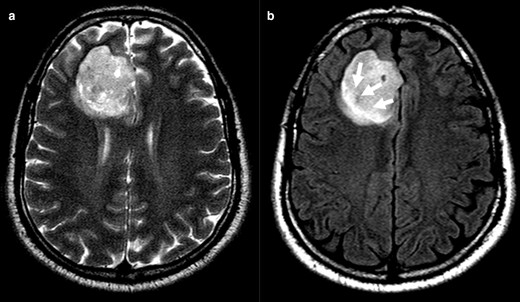
Clearly inhomogeneous T 2WI sign (a). Axial FLAIR images (b) have central lower signal intensity and higher peripheral rim (arrows). Evaluation of FLAIR image alone can be misinterpreted, while the inhomogeneous T2 precludes T2-FLAIR mismatch sign positivity. The tumour was an IDH-mutant 1p/19q codeleted oligodendroglioma. FLAIR, fluid attenuated inversion recovery; IDC, isocitrate dehydrogenase.
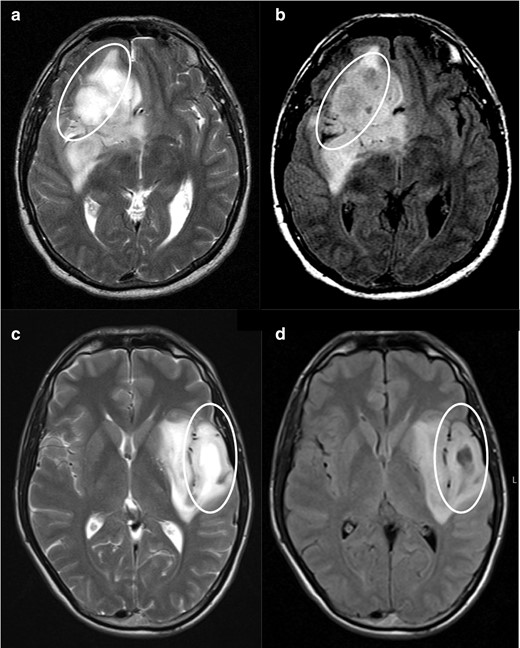
Negative cases for T2-FLAIR mismatch. T 2WI shows a heterogenous hyperintense signal in both lesions (a and c). FLAIR sequences (b and d) show areas of attenuation when compared with T 2WI (circles), but in an irregular fashion. In image d, we identify two distinct regions to this tumour, one of which shows evident attenuation on FLAIR (lateral part of the tumour), and the other that does not attenuate on FLAIR (medial/insular part). While the lateral region could be considered a positive T2-FLAIR mismatch sign, the medial part does not fulfill the criteria, so we classified this tumour as a negative case for T2-FLAIR mismatch. (a, b) was an IDH-mutant 1p/19q non-codeleted anaplastic astrocytoma (Grade III) and (c, d) an IDH-mutant 1p/19q non-codeleted diffuse astrocytoma (Grade II). FLAIR, fluid attenuated inversion recovery; IDC, isocitrate dehydrogenase.
In addition, T2 signal in tumours near the cortex demand a pertinent word of warning. When wrapped underneath the cortex, tumours are interposed with grey matter and may appear as hypointense areas within the tumour. This aspect should not prevent the reader to consider a homogenous T2 bright sign. In Case 5 (Figure 5), high T2 signal attenuates on FLAIR image and exhibits a peripheral high signal rim, although incomplete. We considered T2 signal as homogeneous despite the T2 hypointense cortical areas and consequently the tumour as a positive T2-FLAIR mismatch. It was in fact a diffuse IDH-mutant 1p/19q non-codeleted astrocytoma.
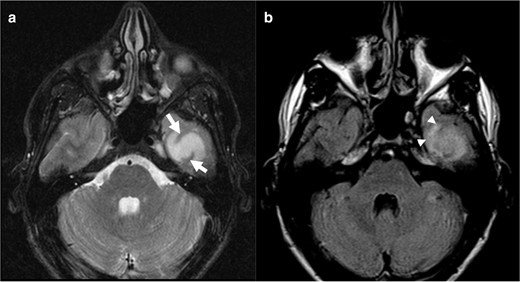
Axial T 2WI (a) reveals a bright signal intensity lesion on the left temporal region with linear areas of hypointense signal corresponding to the cortex (arrows). The lesion shows partially supressed signal on FLAIR image (b), without a complete high intensity peripheral rim, that can be seen on the anterior region (arrowhead). We considered a positive T2-FLAIR mismatch sign. This was an IDH-mutant 1p/19q non-codeleted diffuse astrocytoma (Grade II). FLAIR, fluid attenuated inversion recovery; IDC, isocitrate dehydrogenase.
FLAIR attenuation, with a peripheral rim
According to Patel et al,8 the presence of a complete or near-complete attenuated FLAIR signal (as we could see on Figure 1), and a peripheral FLAIR bright rim is necessary for the classification as T2-FLAIR mismatch sign positive. Several authors have now suggested that the hyperintense rim on FLAIR can be complete or a near-complete,7 as we exemplified in the previous cases (complete rim in Figure 1a and b and incomplete rim in Figure 1c–f).
We highlight the next cases as classic pitfalls in mismatch evaluation.
Cases 6 (Figure 6) and 7 (Figure 7) present perfect homogeneous T2 bright signal intensity and homogeneous dark signal intensity on FLAIR, however without a bright peripheral rim. They hence most likely refer to a cystic formation within the tumour and not a true T2-FLAIR mismatch. Case 6 was an IDH-mutant 1p/19q codeleted oligodendroglioma and case 7 an IDH-wildtype anaplastic astrocytoma.
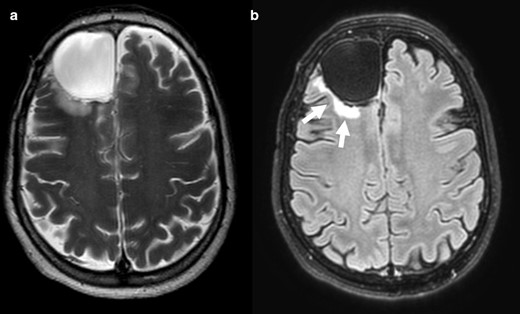
T2-FLAIR mismatch sign negative. Axial T 2WI (a) showing cortico-subcortical lesion with homogeneously bright signal intensity in right frontal region. Axial FLAIR scan (b) reveals strong hypointense signal intensity in the same area, revealing a cystic formation, not a true T2-FLAIR mismatch sign. The peripheral edema (arrows) should not be misinterpreted as a bright sign rim. This was an IDH-mutant 1p/19q codeleted oligodendroglioma. FLAIR, fluid attenuated inversion recovery; IDC, isocitrate dehydrogenase.

T2-FLAIR mismatch sign negative. Axial T 2WI (a) showing cortico-subcortical lesion with heterogeneous bright signal intensity on the temporal region. Axial FLAIR scan (b) displays partial attenuation with drop of signal in the cystic regions. Thus, this is not a T2-FLAIR mismatch sign. This tumour was an IDH-wildtype anaplastic astrocytoma. FLAIR, fluid attenuated inversion recovery; IDC, isocitrate dehydrogenase.
Finally, cases 8 (Figure 8), 9 (Figure 9) and 10 (Figure 10) show homogeneous T2 high signal intensity and FLAIR attenuation, although variable within the tumours. We considered partial FLAIR attenuation and thus classified these tumours as mismatch negative. Case 8 was an IDH-mutant 1p/19q codeleted oligodendroglioma and cases 9 and 10 were both IDH-mutant 1p/19q non-codeleted diffuse astrocytomas. A note of caution should be made regarding the acceptance of inhomogeneous FLAIR attenuation. Case 8 has areas of greater attenuation on FLAIR, lacking perfect homogeneity; likewise, the pattern of patchy FLAIR suppression was seen in the first tumour shown (Figure 1). Both tumours present peripheral areas with higher signal intensity on FLAIR. Nevertheless, in Case 8, the bright periphery is not a clearly delineated rim and the FLAIR attenuation is more heterogenous. These two characteristics combined enabled the classification as negative T2-FLAIR mismatch. These examples show us that we are facing a continuum spectrum of alterations, not clear cut as present or absent, thus making it hard, and sometimes subjective, to define if we have a positive T2-FLAIR mismatch sign or not.
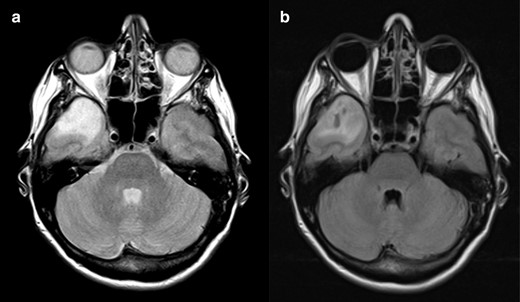
T2-FLAIR mismatch sign negative. On the axial T 2WI (a) there is a cortico-subcortical lesion with homogeneously bright signal intensity on T2 in the right temporal pole. Axial FLAIR scan (b) reveals inhomogeneous attenuation of signal intensity in the central area, with some darker areas in the middle of the lesion. Although these characteristics could point to the presence of the mismatch sign, there is no clear peripheral bright rim and the drop of signal on FLAIR is not as homogeneous as expected for a T2-FLAIR mismatch sign. This was an IDH-mutant 1p/19q codeleted oligodendroglioma. FLAIR, fluid attenuated inversion recovery; IDC, isocitrate dehydrogenase.
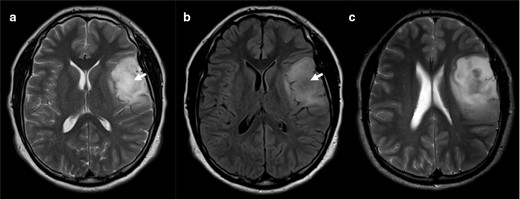
Axial T 2WI scan through the middle region of the lesion (a) shows an almost homogenous T2 bright signal intensity. On the FLAIR (b) there is central suppression of the signal (arrow). However, we should evaluate the whole length of the lesion and an upper slice (c) reveals that the lesion is heterogenous on T 2WI, not fulfilling the criteria for the T2-FLAIR mismatch. This was nevertheless an IDH-mutant 1p/19q non-codeleted diffuse astrocytoma (Grade II). FLAIR, fluid attenuated inversion recovery; IDC, isocitrate dehydrogenase.
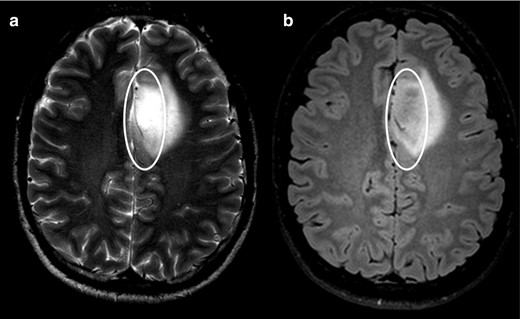
Axial T 2WI (a) shows homogenous high signal intensity (circle) but only part of the lesion supresses on the FLAIR image (circle on b). Following the criteria, this should be considered a negative T2-FLAIR mismatch sign, although this turned out to be an IDH-mutant 1p/19q non-codeleted diffuse astrocytoma (Grade II). FLAIR, fluid attenuated inversion recovery; IDC, isocitrate dehydrogenase.
The glioneuronal case
Case 11 (Figure 11) has a homogeneous T2 bright sign with central attenuation on FLAIR, fulfilling the criteria for positive T2-FLAIR mismatch. This tumour had no peripheral edema nor contrast enhancement. Nevertheless, it was a dysembryoplastic neuroepithelial tumour (DNT).
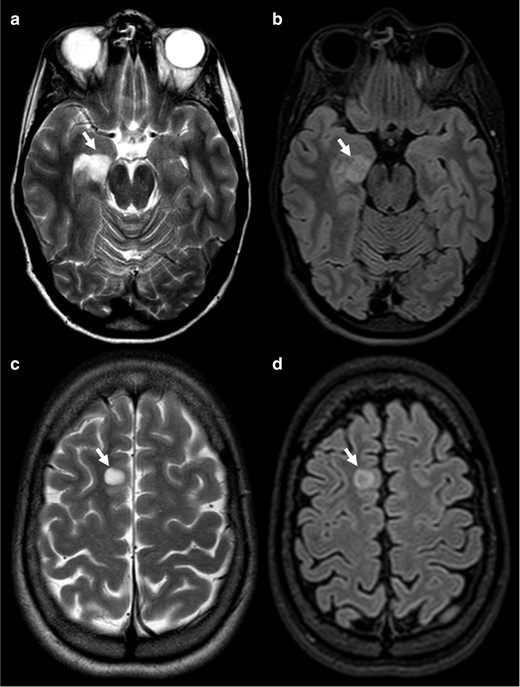
Axial T 2WI (a, c) show homogenous high signal intensity (arrows) with central attenuation on the FLAIR image (b, d), corresponding to what should be a positive T2-FLAIR mismatch sign. Top row tumour was a DNT and bottom row a neuroglial tumour.DNT, dysembryoplastic neuroepithelial tumour; FLAIR, fluid attenuated inversion recovery.
Discussion
Several studies have demonstrated the 100% specificity of the T2-FLAIR mismatch sign for the diagnosis of IDH-mutant 1p/19q non-codeleted gliomas (diffuse astrocytomas), despite its low sensitivity.6–8,12 This sign only requires conventional MRI sequences, a significant advantage for small centres without access to advanced MRI techniques. Also, it is an easily applicable image biomarker, with good interrater agreement.7,8
Nevertheless, as we highlight, the application of the T2-FLAIR mismatch sign may not be straightforward in some cases. It requires neuroradiologic expertise, with both knowledge and critical evaluation of the application criteria.
Difficulties in correctly applying the criteria may account for the lack of specificity encountered in some recent articles like in the work of Juratli et al11, which found false-positive T2-FLAIR mismatch sign in 28.5% of the studied population. In this study, the authors used broader criteria including gliomas with heterogeneous signal on T 2 WI or incomplete suppression on FLAIR. Lee et al13 also described 10 false-positive cases in a study including 110 tumours with histopathologic diagnosis of lower grade gliomas; nevertheless, the authors criticised their own results as some IDH-mutant 1p19q codeleted tumours classified as positive mismatch had cystic-like patterns and some IDH-wildtype tumours were erroneously assumed to have T2-FLAIR mismatch due to background signal decrease on FLAIR. Corell et al14 studied 135 patients with histopathological diagnosis of a supratentorial infiltrating WHO Grade II or III glioma and reported two patients with mismatch sign who had IDH-mutant 1p/19q codeleted glioma, with a final specificity of mismatch sign for diffuse astrocytomas of 97.6%.
The majority of works regarding the T2-FLAIR mismatch have the bias of selecting only glial tumours. Few authors have included glioneuronal tumours, leaving this subtype out of the analysis. A recent work published by Onishi et al9 evaluated the presence of T2- FLAIR mismatch in a subset of 11 DNT, and they found that 73% of DNT presented the mismatch sign, questioning T2-FLAIR mismatch sign specificity for IDH-mutant 1p/19q non-codeleted astrocytomas. Previous works had also brought to attention the presence of a FLAIR rim sign as a marker of DNT.15 Jonhson et al10 also found four cases of paediatric tumours with T2-FLAIR mismacth sign: a pylomixoid astrocytoma, a H3 K27M-mutant midline glioma, a low-grade astrocytoma harbouring MYB rearrangement and an oligodendroglioma.
The MR field strength also influences the interpretation of T2-FLAIR mismatch sign, since stronger magnetic field will produce higher FLAIR attenuation, making the T2-FLAIR mismatch more conspicuous than with lower field strengths. On the other hand, stronger magnetic fields influence the T 2W homogeneity, with gliomas being less homogeneous on 3 T when compared with 1.5 T MR scans.Despite these caveats, we agree with recent literature suggesting that if strict criteria are applied, the mismatch sign would still be highly specific for IDH-mutant 1p/19q non-codeleted gliomas in adult population.12
The clear definition of a T2 homogeneous high intensity seems to be one of the critical steps to the classification. Another important point is the identification of a bright, or at least brighter, peripheral rim on FLAIR sequence and the FLAIR signal suppression should be smooth and diffuse, rather than patchy and heterogenous. Completely suppressed T2 FLAIR tumours should be precluded as they point to a cystic lesion. Similarly, tumours with multifocal areas of attenuation are usually present when a multicystic pattern is seen and should also be excluded.
We emphasize that the strength of the T2-FLAIR mismatch sign is its specificity, rather than sensitivity. The clinical meaning and pathophysiology of this sign remains unclear, but one could hypothesize that T2-FLAIR mismatch may account for a yet undefined subgroup of tumours with similar biological behavior and outcome. Thereby, T2-FLAIR mismatch sign may have prognostic implications and influence treatment approach, which argues for a careful evaluation by a neuro-oncology experienced neuroradiologist. Although, no definitive explanation regarding the biological underpinning of the T2-FLAIR-mismatch sign has been established, several authors hypothesize that it might reflect differences in cellularity with positive mismatch tumours representing less cellular tumours, with higher protein content and/or with microcystic pattern.8,16,17 Further investigations to understand the pathological meaning of the T2-FLAIR mismatch sign should be pursued.
Conclusion
T2-FLAIR mismatch sign is a highly specific image biomarker for IDH-mutant 1p/19q non-codeleted gliomas, using only standard MRI sequences. In order to obtain such specificity, criteria application must be strictly followed. We present a series of cases illustrating the imaging criteria of this sign, as well as potential difficulties found in its application.
Key points
T2-FLAIR mismatch sign is described as a specific imaging marker for IDH-mutant 1p/19q non-codeleted gliomas (diffuse or anaplastic astrocytomas).
The criteria must be strictly applied to ensure T2-FLAIR mismatch sign specificity.
A proper assessment by an experienced neuroradiologist is paramount.
We review several cases to highlight the key image features of the T2-FLAIR mismatch sign and the potential pitfalls.
This study was approved by local Ethics Committee and patient informed consent was waived.
REFERENCES
