


Abstract
Sevoflurane is a fluorinated volatile anaesthetic agent that lowers arterial pressure, in part by vasodilation. We previously showed, in rat lungs, that sevoflurane affected the expression of endothelin-1 (ET-1), a potent vasoconstrictor peptide. Therefore, we hypothesized that the vasodilation induced by sevoflurane involved vasodilatory and vasoconstrictor components.
Rats were anaesthetized with sevoflurane 4% for 0, 2, and 6 h (n=9 each group) before death. In addition, a further group (n=9) were anaesthetized for 6 h then awoken for 2 h before death (n=9). We measured expression of mRNA encoding ET-1, nitric oxide synthase-1, 2, 3 (NOS1, 2, 3), haeme oxygenase-1, 2 (HO-1, 2), adrenomedullin (ADM), calcitonin gene-related peptide, vasoactive intestinal peptide, and prostacyclin synthase in whole lung using real-time reverse transcriptase–polymerase chain reaction.
Expressions of ET-1 and ADM were significantly increased by inhalation of sevoflurane for 2 and 6 h (P<0.05). Expression of NOS3 was significantly increased at 6 h (P<0.05). After awaking from anaesthesia, the expressions of NOS3, ET-1, and ADM returned to baseline levels.
Sevoflurane increased the expressions of ET-1, NOS3, and ADM. Our results suggest that the increased expressions of NOS3 and ADM may counteract that of ET-1 and so regulate pulmonary circulation under sevoflurane anaesthesia.
Vascular resistance in the pulmonary circulation is affected by many endogenous agents that influence vascular smooth muscle, right ventricular myocardium, endothelial function, collagen and elastin deposition, and fluid balance. Endothelin-1 (ET-1) is a peptide with local pulmonary artery pressor effects, although calcitonin gene-related peptide (CGRP), adrenomedullin (ADM), and vasoactive intestinal peptide (VIP) oppose this action.
The expression of ET-1 in rat lungs has been shown to increase after sevoflurane anaesthesia.1 ET-1 attenuates the decrease in arterial pressure during sevoflurane anaesthesia2 and counterbalances the vasodilatory effects of nitric oxide (NO).3 NO is generated by NO synthase,4 for which three types are known: NOS1, NOS2, and NOS3.5,6 In a similar manner to NO, carbon monoxide (CO) gas relaxes isolated blood vessels, in vitro.7,8 CO is produced by haeme oxygenase (HO),9 which exists in three isoforms: HO-1, HO-2, and HO-3.10 Prostacyclin (PGI2) synthase (PGIS) is the final committed enzyme in the metabolic pathway leading to PGI2 production, which also results in pulmonary vasodilatation.11
The vasodilatory mechanisms induced by sevoflurane remain to be fully elucidated. However, voltage-dependent calcium channels may be involved.12 We hypothesized that the above-mentioned vasoactive factors regulate pulmonary circulation in addition to the direct action of sevoflurane on calcium channels. Using quantitative real-time polymerase chain reaction (PCR), we have simultaneously investigated the expression of pulmonary vasodilator and vasoconstrictor agents during sevoflurane anaesthesia.
Methods
Animal preparation
Approval for the study was obtained from the Animal Experimental Ethical Review Committee of Nippon Medical School. Six-week-old male rats (Wistar; Saitama Experimental Animals) were purchased and housed in a plastic box that could be supplied with sevoflurane (4% air gas mixture) at the rate of 6 litre min−1 and allowed to breathe spontaneously. For 0 h samples, rats (n=9) were killed without anaesthesia to provide baseline controls (CON). The lungs of each animal were obtained within 3 min of death. After 2 and 6 h of anaesthesia, rats were taken from the plastic box supplied with sevoflurane, and killed to obtain 2 and 6 h lung samples, respectively (2H and 6H, n=9 each group). In an additional group, rats (n=9) were awoken after 6 h of anaesthesia and then killed 2 h later (A2H). All lung samples were stored at −80°C for determinations of ET-1, NOS1, 2, 3, HO-1, 2, PGIS, CGRP, ADM, and VIP mRNA expression by real-time quantitative PCR analysis. When statistically significant differences between baseline controls and the 2 and 6 h groups were demonstrated, we further measured expression in the 2 h after awakening group.
Real-time reverse transcriptase–polymerase chain reaction
Total RNA was extracted from each lung using the chaotropic Trizol method followed by Isogen–chloroform extraction and isopropanol precipitation.13 Before reverse transcription, potentially contaminating residual genomic DNA was eliminated with DNase (Takara Shuzo, Otsu, Japan). A spectrophotometer was used to determine the amount of mRNA isolated. mRNA obtained was reverse-transcribed using PCR Express (Thermo Fisher Scientific, Waltham, MA, USA). This was carried out in a final volume of 40 µl comprising 8 µg eluted mRNA, 8 µl 5× reverse transcription buffer, 7.5 nmol dNTP mixture, 2 µg random primer, 200 nmol DTT, 200 U M-MLV reverse transcriptase, and 8 U ribonuclease inhibitor. The resulting solution was incubated in a thermal cycler at 42°C for 1 h, then at 99°C for 10 min. The cDNA obtained was aliquoted and stored at −20°C until PCR reactions were performed.
We chose the Gene Expression Assay (Applied Biosystems) for PCR primers and TaqMan fluorogenic probes. Code numbers of primers and probes are presented in Table 1.
Code numbers of primers and probes (Applied Biosystems)
| Endothelin 1(ET‐1) | NM_012580 |
| Nitric oxide synthase 1 (NOS1) | NM_052799 |
| Nitric oxide synthase2 (NOS2) | NM_012611 |
| Nitric oxide synthase3 (NOS3) | Rn02132634_s1 |
| Heme oxygenase 1 (HO‐1) | NM_012580 |
| Heme oxygenase 2 (HO‐2) | NM_024387 |
| Vasoactive intestinal polypeptide (VIP) | Rn01430570_m1 |
| Prosatacyclin synthase (PGIS) | Rn01423510_m1 |
| Adrenomedullin (ADM) | Rn00562327_m1 |
| Calcitonin‐related polypeptide,alpha (CGRP) | Rn01511354_m1 |
One microlitre of cDNA was used for quantitative PCR in 50 μl reaction volumes including 25 µl Taqman Universal Master Mix (Applied Biosystems), 900 nM each of forward and reverse primers, 200 nM Taqman probe, and deionized water. PCR conditions were as follows: 50°C for 2 min and 95°C for 10 min, followed by 40 cycles of amplification for 15 s at 95°C and 1 min at 60°C. The Taqman probe labelled with 6-FAM was cleaved during amplification, generating a fluorescent signal. Experimental samples and calibration curve samples were run in triplicate. Unknown values were automatically interpolated from the standard curve. A similar system using a separate glyceraldehyde-3-phosphate dehydrogenase (GAPDH) probe and primer set (TaqMan GAPDH control reagent kit; Applied Biosystems) was designed, and run for GAPDH along with every unknown sample to correct for total nucleic acid content. The assay used an instrument capable of measuring fluorescence in real time (ABI PRISM 5700 Sequence Detector; Applied Biosystems). Results of the real-time PCR data were represented as the threshold cycle (Ct) values, where Ct represents a unitless value defined as the fractional cycle number at which the sample fluorescence signal passes a fixed threshold above baseline. A markedly different value of a triplicate sample, which was obviously due to inaccurate operation, was omitted. Relative amounts of all mRNAs were calculated by the comparative CT method (Applied Biosystems).
Statistical analysis
All values were expressed as box and whisker plots showing median, inter-quartile and full range. Data were assessed by the Kruskal–Wallis H-test. The Mann–Whitney U-test with Bonferroni correction was used when significant differences were obtained. The significance level was set at P<0.05.
Results
No rat died during anaesthesia and data are used from all animals. Expression ratios of vasoactive factors are presented in Table 2. Expression of ET-1 was greater in anaesthetized than baseline control animals. There was no significant difference in ET-1 expression at 2 and 6 h (Fig. 1). NOS3 expression at 6 h was higher than baseline (Fig. 1). The expression of ADM was greater in anaesthetized than baseline control animals. Expression of ADM at 6 h was greater than at 2 h (Fig. 1). There were no significant differences in ET-1, ADM, and NOS3 expression 2 h after awakening compared with baseline control samples. Expressions of HO-1, HO-2, NOS1, NOS2, PGIS, CGRP, and VIP were not significantly different between anaesthetized and baseline control animals.
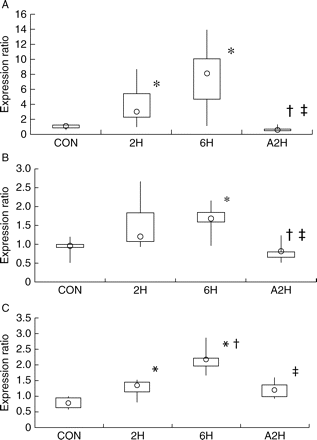
Effects of sevoflurane anaesthesia on expression of vasoactive factors in rat lungs. Rats were anaesthetized with sevoflurane 4% for 0 h (CON), 2 h (2H), and 6 h (6H) (n=9 each group) before death. A2H were anaesthetized for 6 h, and then awoken for 2 h before death (n=9 each group). Expression ratios of ET-1 (a), NOS3 (b), and ADM (c) are plotted. Data are presented as box and whisker plots. The inter-quartile range is a measure of spread or dispersion. The box denotes the first quartile and the third quartile and is the difference between them. The range is a measure of dispersion and represents the difference between the lowest and highest scores in the data set. The whiskers are the two lines outside the box that extend to the highest and lowest data scores. The median is symbolized by a circle. *P<0.05 vs corresponding CON; †P<0.05 vs corresponding 2H; ‡P<0.05 vs corresponding 6H.
Expression ratios of all vasoactive factors. All data are expression ratios of pulmonary vasoactive factors. Data are median(Q1-the first quartile, Q3-the third quartile). Min shows the lowest and Max the highest expression ratios. *Significant differences are detected by Kruskal–Wallis H-test. Mann–Whitney U-test with Bonferroni correction was used in these groups. See also Figure 1
| Expression ratios | 0 h | 2 h | 6 h | A2 h |
|---|---|---|---|---|
| ET-1*(P=0.001669) | ||||
| Median(Q1,Q3) | 1.00(0.80,1.14) | 3.00(2.15,5.38) | 8.09(4.55,10.08) | 0.50(0.44,0.65) |
| Min–Max | 0.46, 1.43 | 0.84, 8.63 | 0.98, 13.90 | 0.33, 1.29 |
| NOS1 | ||||
| Median(Q1,Q3) | 0.57(0.45,0.92) | 0.94(0.88,0.99) | 1.05(0.81,1.64) | |
| Min–Max | 0.32, 1.00 | 0.60, 1.54 | 0.67, 2.74 | |
| NOS2 | ||||
| Median(Q1,Q3) | 1.00(0.47,1.48) | 0.67(0.35,1.70) | 1.14(0.87,1.58) | |
| Min–Max | 0.37, 2.29 | 0.23, 3.03 | 0.19, 17.85 | |
| NOS3* (P=0.000122) | ||||
| Median(Q1,Q3) | 0.94(0.88,1.00) | 1.19(1.03,1.85) | 1.65(1.56,1.83) | 0.78(0.65,0.80) |
| Min–Max | 0.50, 1.19 | 0.93, 2.65 | 0.93, 2.16 | 0.50, 1.24 |
| HO-1 | ||||
| Median(Q1,Q3) | 0.98(0.84,1.20) | 0.84(0.64,0.90) | 1.02(0.85,1.70) | |
| Min–Max | 0.55, 2.12 | 0.49, 0.99 | 0.63, 2.99 | |
| HO-2 | ||||
| Median(Q1,Q3) | 0.91(0.85,1.18) | 0.92(0.85,2.07) | 1.23(1.21,1.44) | |
| Min–Max | 0.76, 1.78 | 0.73, 3.44 | 0.93, 2.06 | |
| ADM* (P=0.000008) | ||||
| Median(Q1,Q3) | 0.77(0.62,0.96) | 1.33(1.10,1.47) | 2.16(1.95,2.22) | 1.17(0.97,1.36) |
| Min–Max | 0.58, 1.00 | 0.80, 1.53 | 1.67, 2.86 | 0.92, 1.58 |
| CGRP | ||||
| Median(Q1,Q3) | 1.00(0.85,1.24) | 0.70(0.63,0.79) | 0.74(0.72,0.80) | |
| Min–Max | 0.52, 1.30 | 0.49, 1.08 | 0.64, 1.20 | |
| VIP | ||||
| Median(Q1,Q3) | 0.83(0.66,1.00) | 1.99(1.16,2.82) | 1.57(0.70,2.43) | |
| Min-Max | 0.39, 1.51 | 0.66, 4.84 | 0.21, 2.88 | |
| PGIS | ||||
| Median(Q1,Q3) | 0.56(0.51,0.66) | 0.69(0.67,0.80) | 0.88(0.65,0.98) | |
| Min–Max | 0.27, 1.00 | 0.64, 1.04 | 0.38, 1.27 |
Discussion
The main finding of this study is that the expression of NOS3, ET-1, and ADM in rat lungs was increased after sevoflurane anaesthesia. In contrast, the expression of NOS1, NOS2, HO-1, HO-2, CGRP, VIP, and PGIS did not change. These results indicated that ET-1 may counterbalance the effects of NO and ADM in the pulmonary circulation under sevoflurane anaesthesia, although additional factors might be implicated. Several reports have suggested that sevoflurane dose-dependently impairs vascular endothelial function, and inhibits endothelium-dependent vasodilatation.14–16 One possible explanation is that endothelial dysfunction occurred not only because of a lack of NO/cGMP-dependent vasodilating systems, but also because of an increased release of vasoconstrictor agents. In this regard, the endothelium is the source of the potent vasoconstrictor ET-1.3,17 In this study, the increase in ET-1 expression was consistent with previous reports. However, sevoflurane reduces the ability of the endothelium to release NO.18 This is inconsistent with the results of our study showing that the NOS3 expression was elevated after sevoflurane anaesthesia. Sevoflurane inhibits the pathway leading from acetylcholine signalling to the transduction of NO from the endothelium to smooth muscle cells.19 Our results indicate that sevoflurane may attenuate the activity of endothelial NO synthase.
The expressions of HO-1, 2 were not elevated after sevoflurane anaesthesia in this study, indicating that CO was not involved in the vasodilatory mechanisms of sevoflurane.
ADM is a potent vasodilating factor that elicits hypotensive effects through at least two mechanisms: by directly acting on vascular smooth muscle cells to increase intracellular cAMP and by acting on endothelial cells to stimulate NO release by activation of NOS3; both mechanisms leading to vascular relaxation.20 Our results (increased ADM expression) suggested that ADM may be involved in the mechanism of vasorelaxation caused by sevoflurane. In addition, ADM may affect the expression of NOS3.
The expressions of VIP, CGRP, and PGIS were not elevated after sevoflurane anaesthesia. These results suggested that VIP, CGRP, and prostacyclin may not be involved in the main mechanisms of vasodilatation induced by sevoflurane.
The present study had some limitations, including the effects of hypoxia during sevoflurane anaesthesia and the use of whole lungs. Here, we used a simple method to avoid the influence of ventilation and other stimulations. However, we cannot rule out the possibility that hypoxia or hypercapnia influences gene expression. Hypoxia increases ADM and ET-1 levels in the lungs, which may also cause secondary elevation in NOS3 expression. The bronchodilatory effects of sevoflurane partially depend on NO.21 The expression of NOS3 in the bronchi may thus have been affected in the present study. Further investigations will be needed to assess the influence of sevoflurane on pulmonary gene expression under the rigid management of respiration.
Our results suggested that the increased expression of NOS3 and ADM counteracting that of ET-1 may play an important role in regulating the pulmonary circulation under sevoflurane anaesthesia. However, quantitative RT–PCR data constitute only a snapshot of information related to the quantity of a given transcript in a tissue. Gene expression of vasoactive factors may not necessarily induce vasodilatation. Additional protein expression studies after sevoflurane anaesthesia will be needed to further elucidate the clinical vasodilating mechanisms of sevoflurane.
Funding
Grant 30196084.


