


Summary
Growing evidence has shown that the brain connectivity network experiences alterations for complex diseases such as Alzheimer’s disease (AD). Network comparison, also known as differential network analysis, is thus particularly powerful to reveal the disease pathologies and identify clinical biomarkers for medical diagnoses (classification). Data from neurophysiological measurements are multidimensional and in matrix-form. Naive vectorization method is not sufficient as it ignores the structural information within the matrix. In the article, we adopt the Kronecker product covariance matrices framework to capture both spatial and temporal correlations of the matrix-variate data while the temporal covariance matrix is treated as a nuisance parameter. By recognizing that the strengths of network connections may vary across subjects, we develop an ensemble-learning procedure, which identifies the differential interaction patterns of brain regions between the case group and the control group and conducts medical diagnosis (classification) of the disease simultaneously. Simulation studies are conducted to assess the performance of the proposed method. We apply the proposed procedure to the functional connectivity analysis of an functional magnetic resonance imaging study on AD. The hub nodes and differential interaction patterns identified are consistent with existing experimental studies, and satisfactory out-of-sample classification performance is achieved for medical diagnosis of AD.
1. Introduction
Alzheimer’s disease (AD) is the most common neurodegenerative disease. For AD diagnosis, neuroscience researchers often resort to brain connectivity analysis (BCA) to reveal the underlying pathogenic mechanism through correlations in the neurophysiological measurement of brain activity. Functional magnetic resonance imaging (fMRI), which records the blood oxygen level dependent time series, has been the mainstream imaging modality to investigate brain functional connectivity. The observed fMRI data have a spatial by temporal matrix structure, where the rows correspond to the brain regions while the columns correspond to the time points, see the fMRI and matrix data in Figure 1(a).
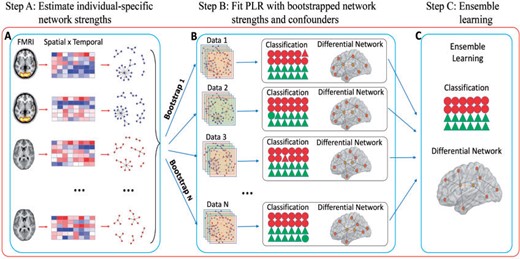
Workflow of the SDNCMV method: (a) estimate individual-specific network strengths with the spatial |$\times$| temporal data; (b) combine individual network information and confounders to fit PLR with bootstrap samples; (c) ensemble learning with the bootstrap results from the PLRs.
Growing evidence has shown that the brain connectivity network experiences alterations with the presence of AD (Ryali and others, 2012; Higgins and others, 2019; Xia and Li, 2019). Differential network analysis or network comparison, which is typically modeled as the difference of the partial correlation matrices of the case and control groups, has provided deep insights into disease pathologies (see, e.g., Yuan and others, 2015; Tian and others, 2016; Ji and others, 2016; Yuan and others, 2016; Ji and others, 2017; Zhang and others, 2017; He and others, 2018; Grimes and others, 2019). Most literature focuses on differential network modeling for vector-form data. For the observed fMRI spatial by temporal matrix data, directly applying the existing differential network analysis methods for vector-form data would ignore the intrinsic matrix structure and may result in unreliable conclusion. Zhu and Li (2018) employed nonconvex penalization to tackle the estimation of multiple graphs from matrix-valued data while Xia and Li (2019) formulated the problem as testing the equality of individual entries of partial correlation matrices, both under a matrix-normal distribution assumption. In addition, most existing literature assume that the individuals in the same group share the same spatial covariance matrix without allowing for individual heterogeneity. In neuroscience, it is in fact more suitable to consider static matrix-variate network comparison for the case and control groups while accommodating heterogeneity of individuals in the same group, which is a major focus of this article.
An ensuing problem is the image-guided medical diagnosis of AD, i.e., to classify a new subject into the AD or control group from the fMRI data. Classification or discriminant analysis is a classical problem in statistics. There have been a variety of standard vector-valued predictor classification methods, such as logistic regression and linear discriminant analysis, with modified versions to cope with the high-dimensionality of predictors (e.g., Bickel and Levina, 2004; Zhu and Hastie, 2004; Zou and Hastie, 2005; Park Mee and Hastie, 2008; Fan and Fan, 2008; Cai and Liu, 2011; Mai and others, 2012; He and others, 2016; Ma and others, 2020; He and others, 2020). For the fMRI matrix data, the naive idea, which first vectorizes the matrix and then adopts the standard vector-valued predictor classification, does not take advantage of the intrinsic matrix structure and thus leads to low classification accuracy. To address this issue, several authors presented logistic regression-based methods and linear discriminant criterion for classification with matrix-valued predictors: Zhou and Li (2014) proposed a nuclear norm penalized likelihood estimator of the regression coefficient matrix in a GLM; Li and Yuan (2005), Zhong and Suslick (2015), and Molstad and Rothman (2019) modified Fisher’s linear discriminant criterion for matrix-valued predictors. The literatures mentioned above all assume that there exists significant difference between the mean vectors/matrices across groups. In the case of fMRI data, the case and control groups tend to have similar mean (both zero after the centralization preprocess step) but different covariance structures. Quadratic discriminant analysis (QDA), which allows for both the mean and the covariance matrix difference for classification, seems to be suitable in the fMRI case. There exists a vast literature in the past decade on QDA for high-dimensional vector-valued data (e.g., Li and Shao, 2015; Jiang and others, 2018; Gaynanova and Wang, 2019; Cai and Zhang, 2020). There also exists literature on QDA for high-dimensional matrix-valued data, see Thompson and others (2020).
In the article, we propose a method which achieves Simultaneous Differential Network analysis and Classification for Matrix-Variate data (SDNCMV). The SDNCMV is indeed an ensemble learning algorithm, which involves three main steps. Firstly, we propose an individual-specific spatial graphical model to construct the between-region network measures (connection strengths), see Figure 1(a). In practice, we measure the between-region network strengths by a specific transformation function of the partial correlations in order to separate their values between the two groups. In the second step, with the constructed individual between-region network strengths and confounding factors, we adopt the bootstrap technique and train the penalized logistic regression (PLR) models with bootstrap samples, see Figure 1(b). Finally, we ensemble the results from the bootstrap PLRs to boost the classification accuracy and network comparison performance, see Figure 1(c).
The advantages of SDNCMV over the existing state-of-the-art methods lie in the following aspects. First, as far as we know, the SDNCMV is the first proposal in the neuroscience literature to achieve network comparison and classification for matrix fMRI data simultaneously. Second, the SDNCMV performs much better than the existing competitors in terms of classification accuracy and network comparison performance, especially when the two populations share the same mean (the preprocessed fMRI data are usually demeaned) while differ in population (partial) correlation structures. Third, the SDNCMV is an ensemble machine learning procedure, which makes a strategic decision based on the different fitted PLRs with bootstrap samples. It is thus more robust and powerful. Fourth, the SDNCMV addresses an important issue in brain network comparison, i.e., it can adjust confounding factors such as age and gender, which has not been taken into full account in the past literature. The results are illustrated both through simulation studies and the real fMRI data of AD. We emphasize that though we focus on disease pathologies and medical diagnosis of AD, our proposal also works for other neurological diseases, such as attention deficit hyperactivity disorder.
The rest of the article is organized as follows. In Section 2, we present the two-stage procedure which achieves classification and network comparison simultaneously. In Section 3, we assess the performances of our method and some state-of-the-art competitors via the Monte Carlo simulation studies. Section 4 illustrates the proposed method through an AD study. We summarize our method and present some future directions in Section 5.
2. Methods
2.1. Notations and model setup
In this section, we introduce the notations and model setup. We adopt the following notations throughout the article. For any vector |$\boldsymbol{a}=(a_1,\ldots,a_d)^\top \in \mathbb{R}^d$|, let |$\|\boldsymbol{a}\|_2=(\sum_{i=1}^d a_i^2)^{1/2}$|, |$\|\boldsymbol{a}\|_1=\sum_{i=1}^d |a_i|$|. Let |$\boldsymbol{\text{A}}=[a_{ij}]$| be a square matrix of dimension |$d$|, define |$\|\boldsymbol{\text{A}}\|_0=\sum_{i=1}^d\sum_{j=1}^d I(a_{ij}\neq 0)$|, |$\|\boldsymbol{\text{A}}\|_1=\sum_{i=1}^d\sum_{j=1}^d |a_{ij}|$|, |$\|\boldsymbol{\text{A}}\|_{\infty}=\max|a_{ij}|$|. We denote the trace of |$\boldsymbol{\text{A}}$| as |$\text{Tr}(\boldsymbol{\text{A}})$| and let |$\text{Vec}({\boldsymbol{\text{A}}})$| be the vector obtained by stacking the columns of |$\boldsymbol{\text{A}}$|. Let |$\text{Vec}(b_{ij})_{j>i}$| be the operator that stacks the columns of the upper triangular elements of matrix |$\boldsymbol{\text{B}}=(b_{ij})$| excluding the diagonal elements to a vector. For instance, |$\boldsymbol{\text{B}}=(b_{ij})_{4\times 4}$|, then |$\text{Vec}(b_{ij})_{j>i}=(b_{12},b_{13},b_{14},b_{23},b_{24},b_{34})^\top$|. The notation |$\otimes$| represents Kronecker product. For a set |$\mathcal{H}$|, denote by |$\#\{\mathcal{H}\}$| the cardinality of |$\mathcal{H}$|. For two real numbers |$p,q$|, define |$p\vee q=\max(p,q)$|.
Let |$\boldsymbol{\text{X}}_{p\times q}$| be the spatial–temporal matrix-variate data from fMRI with |$p$| spatial locations and |$q$| time points. We assume that the spatial–temporal matrix-variate |$\boldsymbol{\text{X}}_{p\times q}$| follows the matrix-normal distribution with the Kronecker product covariance structure defined as follows.
In the current article, we focus on the brain connectivity alteration detection (BCAD) of AD, i.e., to identify the differences in the spatial partial correlation matrices of the AD group and the control group. The most notable feature that differentiates our proposal from the existing BCAD-related literature is that we take both the variations of the strengths of spatial network connections across subjects and adjustment of confounders into account. We focus on the fMRI-guided medical diagnosis of AD. Let |$\boldsymbol{\text{X}}_{\gamma}\in\mathbb{R}^{p\times q},\gamma=1,\ldots,n_1$| be the subjects from the AD group and |$\boldsymbol{\text{Y}}_{\gamma^\prime},\gamma^\prime=1,\ldots,n_2$| from the control group, which are all spatial-temporal matrices. We assume that |$\boldsymbol{\text{X}}_{\gamma}\sim \mathcal{N}_{p,q}(\boldsymbol{\text{M}}_{X}^{(\gamma)},\boldsymbol{\Sigma}_{T_X}^{(\gamma)}\otimes\boldsymbol{\Sigma}_{S_X}^{(\gamma)})$| and |$\boldsymbol{\text{Y}}_{\gamma^\prime}\sim \mathcal{N}_{p,q}(\boldsymbol{\text{M}}_{Y}^{(\gamma^\prime)},\boldsymbol{\Sigma}_{T_Y}^{(\gamma^\prime)}\otimes\boldsymbol{\Sigma}_{S_Y}^{(\gamma^\prime)})$|, which indicates the individual-specific between-region connectivity strengths.
Most existing literature assume that the individuals in the same group share the same spatial matrix while our proposal allows individual heterogeneity. Recent medical studies provide evidence for the presence of substantial heterogeneity of covariance network connections among individuals or subgroups of individuals (e.g., Chen and others, 2011; Alexander-Bloch and others, 2013; Xie and others, 2020). It is also reasonable to assume that the network structures of subjects in the same group are similar while there is a significant difference in the network structures between the case and control groups.
2.2. The SDNCMV procedure
In this section, we present the detailed procedure for SDNCMV. The SDNCM involves the following three main steps: (i) construct the individual-specific between-region network measures; (ii) train the PLR models with bootstrap samples; and (iii) ensemble results from the bootstrap PLRs to boost the classification accuracy and network comparison performance. We give the details in the following subsections.
2.2.1. Individual-specific between-region network measures.
One may also use other individual-graph estimation methods such as Graphical Lasso (Friedman and others, 2008). We adopt CLIME for the sake of computational efficiency, which is very attractive for high-dimensional data as it can be easily implemented by linear programming. We select the tuning parameter |$\lambda$| by the Dens criterion function proposed by Wang and others (2016). We use the R package “DensParcorr” to implement the procedure for inferring the individual partial correlation matrix, which allows the user to specify the desired density level |$\varphi$|. In practice, we set the desired density level at |$\varphi=0.5$| by designating the parameter “dens.level” as 0.5 in the function DensParcorr, which is shown to work well in various scenarios.
For the estimator |$\hat{\boldsymbol{\Sigma}}_{S_X}^{(\gamma)}$| in (2.1), one may consider many alternatives, such as the estimator from the “flip-flop” algorithm in Dutilleul (1999). We may also adopt the common “whitening” technique to remove the effect of temporal correlation and induce independent columns (Manjari and Allen, 2016; Xia and Li, 2017). However, the extra endeavor to take temporal dependence into account when we estimate |$\boldsymbol{\Omega}_{S_X}^{(\gamma)}$| would result in heavy computational burden and both the simulation study and real data example show that the gain in terms of classification accuracy is very limited. The numerical comparisons with and without “whitening” and further discussions are put in Appendix S4 of the Supplementarymaterial available at Biostatistics online.
2.2.2. Penalized logistic regression.
Logistic regression is a classical statistical model for a binary classification problem. In this section, we introduce the PLR model and the bootstrap procedure.
If the coefficient |$\beta_{ij}\neq 0$|, there exists an edge between the brain regions |$i$| and |$j$| in the differential network, which can be used by PLR to discriminant the AD subjects from the control subjects. Thus, with the estimated support set of |$\hat{\boldsymbol{\beta}}$|, we can recover the differential edges and at the same time, the subjects in the test set are classified based on the fitted |$\hat P$|. That is how our proposal achieves SDNCMV. It is worth pointing out that we can modify the model in (2.3) such that it includes the original variables |$\boldsymbol{\text{X}}_\gamma$| as a part of the confounders |$\boldsymbol{Q}$| with a penalty for |$\boldsymbol{Q}$|. In the current article, we mainly focus on the predictive ability of the individual-specific network strengths irrespective of the original variables.
2.2.3. Ensemble learning with bootstrap.
In this section, we introduce a bootstrap-based ensemble learning method which further boosts the classification accuracy and the network comparison performance. With the |$n_1$| subjects from the AD group and |$n_2$| subjects from the control group, we randomly sample |$n_1$| subjects from the AD group and |$n_2$| samples from the control group separately, both with replacement, and then conduct the two steps as introduced in the last two sections. We repeat the re-sampling |$B$| times and then we denote the regression coefficients as |$\{\hat{\boldsymbol{\beta}}^{(b)}=\text{Vec}(\hat{\beta}_{ij}^{(b)})_{j>i},b=1,\ldots,B\}$| and the out-sample classification label |$\hat Z^{(b)}\in\{0,1\}$|. We classify the new test sample as AD if |$\hat P_B=1/B \sum_{b=1}^BI(\hat Z^{(b)}=1)>0.5$|. Similarly, to boost the network comparison performance, we calculate the differential edge weight for each pair of nodes |$(i,j)$|, defined as |$\theta_{ij}=\sum_{b=1}^B I(\hat{\beta}_{ij}^{(b)}\neq 0), 1\leq i<j\leq p$|. For a pre-specified threshold |$\tau$|, there exists an edge |$(i,j)$| in the differential network if |$\theta_{ij}>\tau$|. A simple way to determine |$\tau$| is simply to take the value |$B/2$|. We also recommend to determine |$\tau$| by a scree plot, see the real example in Section 4. The simulation study in the following section shows that the bootstrap-assisted ensemble learning boosts the classification accuracy and the network comparison performance considerably. The entire SDNCMV procedure is summarized in Algorithm 1.
Input:|$\mathcal{D}_{Train}=\Big\{\boldsymbol{\text{X}}_\gamma,\gamma=1,\ldots,n_1,\boldsymbol{\text{Y}}_{\gamma^\prime},\gamma^\prime=1,\ldots, n_2, \boldsymbol{Q}_k, k=1,\ldots,n\Big\}$|, |$\mathcal{D}_{Test}$|
Output: Predicted labels of the test samples in |$\mathcal{D}_{Test}$|, differential edge weights |$\theta_{ij},1\leq i<j\leq p$|.
procedure
Perform the CLIME procedure in (2.2) for each subject in |$\mathcal{D}_{Train}$| and |$\mathcal{D}_{Test}$|.
Calculate the network strengths |$\boldsymbol{W}_k$| for subjects in |$\mathcal{D}_{Train}$| and |$\mathcal{D}_{Test}$|.
for |$b\leftarrow 1$|to|$B$|
Sample |$\{(\boldsymbol{Q}_k,\boldsymbol{W}_k),k=1,\ldots,n\}$| from |$\mathcal{D}_{Train}$| with replacement, and obtain bootstrap samples |$\{(\boldsymbol{Q}_k^{(b)},\boldsymbol{W}_k^{(b)}),k=1,\ldots,n\}$|.
Solve the PLR in (2.4) with |$\{(\boldsymbol{Q}_k^{(b)},\boldsymbol{W}_k^{(b)}),k=1,\ldots,n\}$|, and obtain |$(\boldsymbol{\hat{\eta}}^{(b)},\hat{\boldsymbol{\beta}}^{(b)})$|.
Calculate the predicted labels for each subject in |$\mathcal{D}_{Test}$| with |$(\boldsymbol{\hat{\eta}}^{(b)},\hat{\boldsymbol{\beta}}^{(b)})$|, and obtain |$\hat Z^{(b)}$|.
endfor
Classify the test subject to AD if |$\hat P_B=1/B \sum_{b=1}^BI(\hat Z^{(b)}=1)>0.5$|.
Let |$\theta_{ij}=1/B\sum_{b=1}^B I(\hat{\beta}_{ij}^{(b)}\neq 0)$| and the differential network edges are estimated as |$\{(i,j):\theta_{ij}>\tau, 1\leq i<j\leq p\}$|.
end procedure
3. Simulation study
In this section, we conducted simulation studies to investigate the performance of the proposed method SDNCMV in terms of classification accuracy and network comparison performance. In Section 3.1, we introduce the synthetic data generating settings, and show the classification accuracy and network comparison results in Sections 3.2 and 3.3, respectively.
3.1. Simulation settings
In this section, we introduce the data generating procedure for numerical study. We mainly focus on the predictive ability of the between-region network measures without regard to the confounder factors. To this end, the data were generated from matrix-normal distribution with mean zero, i.e., for AD group, we generated |$n_1$| independent samples |$\boldsymbol{\text{X}}_{\gamma}$||$(\gamma=1,2,\dots,n_1)$| from |$\mathcal{N}_{p,q}\Big(0, \boldsymbol{\Sigma}_X^{(\gamma)}\Big)$| with |$\boldsymbol{\Sigma}_X^{(\gamma)}=\boldsymbol{\Sigma}_{T_X}^{(\gamma)}\otimes\boldsymbol{\Sigma}_{S_X}^{(\gamma)}$|; and for the control group, we generated |$n_2$| independent samples |$\boldsymbol{\text{Y}}_{\gamma^\prime}$||$(\gamma^\prime=1,2,\dots,n_2)$| from |$\mathcal{N}_{p,q}\Big(0, \boldsymbol{\Sigma}_Y^{(\gamma^\prime)}\Big)$| with |$\boldsymbol{\Sigma}_Y^{(\gamma^\prime)}=\boldsymbol{\Sigma}_{T_Y}^{(\gamma^\prime)}\otimes\boldsymbol{\Sigma}_{S_Y}^{(\gamma^\prime)}$| and the scenarios for the covariance matrices |$\boldsymbol{\Sigma}_X^{(\gamma)},\boldsymbol{\Sigma}_Y^{(\gamma^\prime)}$| are introduced in detail below.
For the temporal covariance matrices: |$\boldsymbol{\Sigma}_{T_X}^{(\gamma)}=(\sigma_{{T_X},i,j}^{(\gamma)})_{q \times q}$| and |$\boldsymbol{\Sigma}_{T_Y}^{(\gamma^\prime)}=(\sigma_{{T_Y},i,j}^{(\gamma^\prime)})_{q \times q}$|, the first structural type is the auto-regressive (AR) correlation, where |$\sigma_{{T_X},i,j}^{(\gamma)} =0.4^{|i-j|}$| and |$\sigma_{{T_Y},i,j}^{(\gamma^\prime)} =0.5^{|i-j|}$|. The second structural type is band correlation (BC), where |$\sigma_{{T_X},i,j}^{(\gamma)} =1/{(|i-j|+1)}$| for |$|i-j|\le 4$| and 0 otherwise and |$\sigma_{{T_Y},i,j}^{(\gamma^\prime)} =1/{(|i-j|+1)}$| for |$|i-j| \le 6$| and 0 otherwise. The temporal covariance matrices of the individuals in the same group are exactly the same for simplicity.
For the spatial covariance matrices, we first construct the graph structure |$\text{G}_{S}$|. We consider two types of graph structure: the Hub structure and the Small-World structure. We resort to R package “huge” to generate Hub structure with five equally sized and non-overlapping graph and use R package “rags2ridges” to generate Small-World structure with 10 small-world graph and 5% probability of rewiring. The two graph structures and the corresponding heat maps of the partial correlation matrix are shown in Figure 2. For further details of these two graph structures, one may refer to Zhao and others (2012) and Van Wieringen and Peeters (2016). Then, based on the graph structure |$\text{G}_{S}$|, we generate two base matrices, |$\boldsymbol{\Omega}_{S_X}$| for AD group and |$\boldsymbol{\Omega}_{S_Y}$| for control group. In detail, we determine the positions of nonzero elements of matrices |$\boldsymbol{\Omega}_{S_X}$| and |$\boldsymbol{\Omega}_{S_Y}$| by |$\text{G}_{S}$|. Then, we fill the nonzero positions in matrix |$\boldsymbol{\Omega}_{S_X}$| with random numbers from a uniform distribution with support |$[-0.5,-0.3] \cup [0.3,0.5]$|. We randomly select two blocks of |$\boldsymbol{\Omega}_{S_X}$| and change the sign of the element values to obtain |$\boldsymbol{\Omega}_{S_Y}$|. To ensure that these two matrices are positive definite, we let |$\boldsymbol{\Omega}_{S_X}=\boldsymbol{\Omega}_{S_X}+(|\lambda_{\min}(\boldsymbol{\Omega}_{S_X})|+0.5)\boldsymbol{\text{I}}$| and |$\boldsymbol{\Omega}_{S_Y}=\boldsymbol{\Omega}_{S_Y}+(|\lambda_{\min}(\boldsymbol{\Omega}_{S_Y})|+0.5)\boldsymbol{\text{I}}$|. The differential network is in essence modeled as |$\boldsymbol{\Delta}=\boldsymbol{\Omega}_{S_X}-\boldsymbol{\Omega}_{S_Y}$|. With the base matrices |$\boldsymbol{\Omega}_{S_X},\boldsymbol{\Omega}_{S_Y}$|, we then generate the individual-specific precision matrices. We generate |$n_1$| independent matrices |$\boldsymbol{\Psi}_{X}^{(\gamma)}$| which shares the same support as |$\boldsymbol{\Omega}_{S_X}$| while their non-zero elements are randomly sampled from the normal distribution |$\mathcal{N}(0, 0.02)$|. Finally, we get |$n_1$| individual-specific precision matrices by |$\boldsymbol{\Omega}_{S_X}^{(\gamma)} = \boldsymbol{\Omega}_{S_X} + \boldsymbol{\Psi}_{X}^{(\gamma)}$|, with the same support but different non-zero elements. To guarantee the symmetry and positive definiteness of |$\boldsymbol{\Omega}_{S_X}^{(\gamma)}$|, we first set |$\boldsymbol{\Omega}_{S_X}^{(\gamma)}=\textbf{Upper}_{S_X}^{(\gamma)}+\textbf{Upper}_{S_X}^{(\gamma)\top}$|, then let |$\boldsymbol{\Omega}_{S_X}^{(\gamma)}=\boldsymbol{\Omega}_{S_X}^{(\gamma)}+(|\lambda_{\min}(\boldsymbol{\Omega}_{S_X}^{(\gamma)})|+1)\boldsymbol{\text{I}}$|, where |$\textbf{Upper}_{S_X}^{(\gamma)}$| is the upper diagonal matrix of |$\boldsymbol{\Omega}_{S_X}^{(\gamma)}$|. The covariance matrices |$\boldsymbol{\Sigma}_{S_X}^{(\gamma)}$| are set to be |$(\boldsymbol{\Omega}_{S_X}^{(\gamma)})^{-1}$| for |$\gamma=1,\ldots,n_1$|. By a similar procedure, we get precision matrices |$\boldsymbol{\Omega}_{S_Y}^{(\gamma^\prime)}$| and covariance matrices |$\boldsymbol{\Sigma}_{S_Y}^{(\gamma^\prime)}$| for |$\gamma^\prime=1,\ldots,n_2$|. By this way, |$\{\boldsymbol{\Omega}_{S_X}^{(1)},\ldots,\boldsymbol{\Omega}_{S_X}^{(n_1)}\}$| are similar, |$\{\boldsymbol{\Omega}_{S_Y}^{(1)},\ldots,\boldsymbol{\Omega}_{S_Y}^{(n_2)}\}$| are similar, which is consistent with the assumption in Remark 2.1.
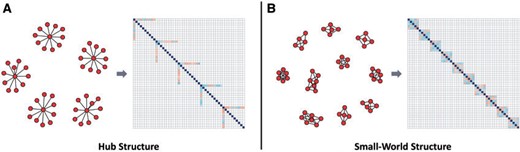
Graph structures and the corresponding heat maps of correlation matrices considered in our simulation studies: (a) Hub structure; (b) Small-World structure.
To sum up, we consider four covariance structure scenarios for |$\boldsymbol{\Sigma}_{X}^{(\gamma)},\gamma=1,\ldots,n_1$| and |$\boldsymbol{\Sigma}_{Y}^{(\gamma^\prime)}, \gamma^\prime=1,\ldots,n_2$|:
Scenario 1:|$\boldsymbol{\Sigma}_{X}^{(\gamma)}=\boldsymbol{\Sigma}_{T_X}^{(\gamma)} \otimes \boldsymbol{\Sigma}_{S_X}^{(\gamma)}$| and |$\boldsymbol{\Sigma}_{Y}^{(\gamma^\prime)}=\boldsymbol{\Sigma}_{T_Y}^{(\gamma^\prime)} \otimes \boldsymbol{\Sigma}_{S_Y}^{(\gamma^\prime)}$|, where |$\boldsymbol{\Sigma}_{T_X}^{(\gamma)}$| and |$\boldsymbol{\Sigma}_{T_Y}^{(\gamma^\prime)}$| are AR covariance structure type and |$\boldsymbol{\Sigma}_{S_X}^{(\gamma)}$| and |$\boldsymbol{\Sigma}_{S_Y}^{(\gamma^\prime)}$| are based on |$\text{G}_{S}$| with Hub structure.
Scenario 2:|$\boldsymbol{\Sigma}_{X}^{(\gamma)}=\boldsymbol{\Sigma}_{T_X}^{(\gamma)} \otimes \boldsymbol{\Sigma}_{S_X}^{(\gamma)}$| and |$\boldsymbol{\Sigma}_{Y}^{(\gamma^\prime)}=\boldsymbol{\Sigma}_{T_Y}^{(\gamma^\prime)} \otimes \boldsymbol{\Sigma}_{S_Y}^{(\gamma^\prime)}$|, where |$\boldsymbol{\Sigma}_{T_X}^{(\gamma)}$| and |$\boldsymbol{\Sigma}_{T_Y}^{(\gamma^\prime)}$| are AR covariance structure type and |$\boldsymbol{\Sigma}_{S_X}^{(\gamma)}$| and |$\boldsymbol{\Sigma}_{S_Y}^{(\gamma^\prime)}$| are based on |$\text{G}_{S}$| with Small-World structure.
Scenario 3:|$\boldsymbol{\Sigma}_{X}^{(\gamma)}=\boldsymbol{\Sigma}_{T_X}^{(\gamma)} \otimes \boldsymbol{\Sigma}_{S_X}^{(\gamma)}$| and |$\boldsymbol{\Sigma}_{Y}^{(\gamma^\prime)}=\boldsymbol{\Sigma}_{T_Y}^{(\gamma^\prime)} \otimes \boldsymbol{\Sigma}_{S_Y}^{(\gamma^\prime)}$|, where |$\boldsymbol{\Sigma}_{T_X}^{(\gamma)}$| and |$\boldsymbol{\Sigma}_{T_Y}^{(\gamma^\prime)}$| are BC covariance structure type and |$\boldsymbol{\Sigma}_{S_X}^{(\gamma)}$| and |$\boldsymbol{\Sigma}_{S_Y}^{(\gamma^\prime)}$| are based on |$\text{G}_{S}$| with Hub structure.
Scenario 4:|$\boldsymbol{\Sigma}_{X}^{(\gamma)}=\boldsymbol{\Sigma}_{T_X}^{(\gamma)} \otimes \boldsymbol{\Sigma}_{S_X}^{(\gamma)}$| and |$\boldsymbol{\Sigma}_{Y}^{(\gamma^\prime)}=\boldsymbol{\Sigma}_{T_Y}^{(\gamma^\prime)} \otimes \boldsymbol{\Sigma}_{S_Y}^{(\gamma^\prime)}$|, where |$\boldsymbol{\Sigma}_{T_X}^{(\gamma)}$| and |$\boldsymbol{\Sigma}_{T_Y}^{(\gamma^\prime)}$| are BC covariance structure type and |$\boldsymbol{\Sigma}_{S_X}^{(\gamma)}$| and |$\boldsymbol{\Sigma}_{S_Y}^{(\gamma^\prime)}$| are based on |$\text{G}_{S}$| with Small-World structure.
We set |$p \in \{100, 150\}$|, |$q \in \{50, 100\}$| and |$n_1=n_2=30$|, and all simulation results are based on 100 replications. Simulation results in Appendix S1 of the Supplementarymaterial available at Biostatistics online show that SDNCMV is not very sensitive to the number of bootstrap replicates |$B,$| and we set |$B=200$| as a balance between better performance and higher computational burden. For the assessment of classification accuracy, we also generate |$n_1^{\rm test}=n_2^{\rm test}=n_1=n_2=30$| test samples independently for each replication, where |$n_1^{\rm test},n_2^{\rm test}$| are the sizes of test samples from the AD group and the control group, respectively. Also note that even |$p=100$|, there are |$p(p-1)/2=4950$| variables in the second-stage PLR.
3.2. Classification accuracy assessment
To evaluate the classification performance of our method, we considered competitors including the matrix-valued linear discriminant analysis (MLDA) by Molstad and Rothman (2019), the matrix quadratic discriminant analysis (MQDA) by Thompson and others (2020) and three classical vector-valued machine learning methods: random forest (vRF), support vector machine (vSVM), and vector-valued penalized logistic regression (vPLR). To implement the vector-valued machine learning methods, we simply vectorize the matrices |$\boldsymbol{\text{X}}_{\gamma}, \boldsymbol{\text{Y}}_{\gamma^\prime}$| of dimension |$p\times q$| and treat them as observations of a random vector of dimension |$pq$|. For fair comparison, we also consider the random forest (RF), support vector machine (SVM) and PLR methods with the same input variables as SDNCMV, i.e., the |$p(p-1)/2$| variables |$W_{S,ij},1\leq i<j\leq p$|. It is worth noting that these methods have not been used for classification with |$W_{S,ij}$| in the neuroscience community. We also consider two more PLR models as competitors, briefly denoted as mPLR and iPLR, respectively. For the first model mPLR, we take the average across columns for each subject such that each subject has predictors |$\bar{\boldsymbol{x}}^{(\gamma)}={1}/{q}\sum_{\nu=1}^q$||$\boldsymbol{x}_{\cdot\nu}^{(\gamma)}$|, then apply PLR with predictors |$\bar{\boldsymbol{x}}^{(\gamma)}$|. For the second model iPLR, we consider PLR with all pairwise interactions, motivated by the connection between QDA and regression with interactions (Zheng and others, 2017). We adopt the existing R packages to implement these competitors, i.e., “MatrixLDA” for MLDA, “MixMatrix” for MQDA, “randomForest” for RF and vRF, “e1071” for SVM and vSVM, and “glmnet” for PLR, vPLR, mPLR and iPLR. For the proposed SDNCMV, we also consider an oracle version in which the true spatial precision (TSP) matrices are used to construct the |$\boldsymbol{W}_k$| in (2.4). We compute the misclassification error rate on the same test set of size |$n_1^{\rm test}+n_2^{\rm test}=60$| for each replication to compare classification accuracy.
Table 1 shows the misclassification rates averaged over 100 replications for Scenarios 1–4 with |$n_1=n_2=30$|, from which we can clearly see that SDNCMV performs slightly better than RF, SVM, PLR, and MQDA while shows overwhelming superiority over the vector-valued competitors (vRF, vSVM, vPLR) and MLDA in various scenarios. The methods MLDA, vSVM, vRF vPLR, iPLR, and mPLR yield results close to a coin toss. The proposed SDNCMV, in contrast, has misclassification rates 0.0% in all simulation settings. RF, SVM, and PLR also perform well, and RF seems better than SVM and PLR. This indicates that the constructed network strength variables are powerful for classification of imaging-type data. From Table 1, we can see that the TSP method is always the best. Also, our method is only slightly worse than the oracle TSP method, which further illustrates the SDNCMV’s efficiency under the ideal case. Furthermore, our method is superior to other competitors.
Misclassification rates (standard errors) averaged of the 100 replications (%) for Scenario 1–4
| |$(p, q)$| | SDNCMV | RF | SVM | PLR | vRF | vSVM | vPLR | MLDA | MQDA | mPLR | iPLR | TSP | |
|---|---|---|---|---|---|---|---|---|---|---|---|---|---|
| Scenario 1: AR for temporal structure and Hub for spatial structure | |||||||||||||
| |$(100, 50)$| | 0.0 (0.2) | 0.8 (1.2) | 8.8 (4.9) | 1.2 (1.5) | 49.8 (6.2) | 49.4 (6.0) | 49.7 (6.4) | 50.6 (6.1) | 0.3 (0.8) | 50.8 (6.3) | 48.4 (6.3) | 0.0 (0.0) | |
| |$(150, 50)$| | 0.0 (0.2) | 1.4 (1.6) | 17.5 (6.8) | 1.3 (1.7) | 50.3 (7.2) | 50.4 (6.5) | 49.8 (6.9) | 49.0 (8.4) | 0.5 (0.9) | 50.9 (6.0) | 48.9 (6.0) | 0.0 (0.0) | |
| |$(100, 100)$| | 0.0 (0.0) | 0.0 (0.2) | 3.3 (2.6) | 0.9 (1.8) | 50.2 (6.2) | 49.0 (6.9) | 50.6 (6.4) | 50.2 (7.8) | 0.0 (0.1) | 49.1 (7.3) | 48.1 (6.6) | 0.0 (0.0) | |
| |$(150, 100)$| | 0.0 (0.0) | 0.1 (0.4) | 4.5 (3.3) | 1.0 (1.6) | 50.2 (5.9) | 48.8 (5.8) | 49.5 (6.7) | 49.5 (7.9) | 0.0 (0.2) | 50.8 (6.6) | 50.1 (5.9) | 0.0 (0.0) | |
| Scenario 2: AR for temporal structure and Small-World for spatial structure | |||||||||||||
| |$(100, 50)$| | 0.0 (0.2) | 0.1 (0.5) | 2.7 (2.5) | 1.6 (2.2) | 49.3 (6.4) | 48.7 (5.8) | 51.0 (5.9) | 50.3 (6.2) | 0.0 (0.0) | 50.0 (7.0) | 48.6 (6.6) | 0.0 (0.0) | |
| |$(150, 50)$| | 0.0 (0.2) | 0.1 (0.4) | 3.3 (3.1) | 1.4 (1.8) | 49.1 (7.4) | 45.9 (5.2) | 49.6 (6.6) | 49.9 (6.9) | 0.0 (0.0) | 49.1 (7.1) | 48.4 (6.7) | 0.0 (0.0) | |
| |$(100, 100)$| | 0.0 (0.0) | 0.0 (0.0) | 0.4 (0.8) | 0.8 (1.5) | 50.5 (5.4) | 49.8 (5.8) | 50.3 (6.8) | 50.7 (7.7) | 0.0 (0.0) | 49.9 (6.9) | 48.2 (6.7) | 0.0 (0.0) | |
| |$(150, 100)$| | 0.0 (0.0) | 0.0 (0.0) | 1.1 (1.4) | 1.2 (1.9) | 49.4 (6.7) | 48.1 (5.1) | 50.2 (6.4) | 49.4 (6.1) | 0.0 (0.0) | 50.6 (6.7) | 48.8 (6.3) | 0.0 (0.0) | |
| Scenario 3: BC for temporal structure and Hub for spatial structure | |||||||||||||
| |$(100, 50)$| | 0.0 (0.0) | 0.7 (1.0) | 14.6 (4.6) | 1.4 (1.8) | 50.2 (6.4) | 50.5 (6.6) | 49.9 (6.2) | 50.4 (5.8) | 0.0 (0.3) | 49.3 (6.4) | 46.9 (7.1) | 0.0 (0.0) | |
| |$(150, 50)$| | 0.0 (0.2) | 1.0 (1.5) | 17.6 (5.9) | 1.3 (1.8) | 50.9 (6.5) | 50.4 (5.9) | 49.9 (6.1) | 49.6 (5.7) | 0.0 (0.3) | 49.8 (6.8) | 48.9 (6.5) | 0.0 (0.0) | |
| |$(100, 100)$| | 0.0 (0.0) | 0.0 (0.3) | 7.6 (3.3) | 0.9 (1.7) | 50.8 (5.7) | 49.8 (6.0) | 50.5 (6.1) | 49.6 (7.6) | 0.0 (0.0) | 49.9 (5.9) | 47.5 (6.0) | 0.0 (0.0) | |
| |$(150, 100)$| | 0.0 (0.0) | 0.0 (0.3) | 10.2 (4.9) | 1.1 (1.7) | 49.0 (5.9) | 50.5 (5.9) | 49.6 (6.5) | 48.4 (9.8) | 0.0 (0.0) | 48.8 (6.9) | 48.9 (6.0) | 0.0 (0.0) | |
| Scenario 4: BC for temporal structure and Small-World for spatial structure | |||||||||||||
| |$(100, 50)$| | 0.0 (0.2) | 0.2 (0.5) | 2.9 (2.5) | 1.6 (2.1) | 50.7 (5.9) | 50.0 (5.4) | 48.9 (6.1) | 50.6 (6.8) | 0.0 (0.0) | 50.5 (6.6) | 48.3 (5.8) | 0.0 (0.0) | |
| |$(150, 50)$| | 0.0 (0.0) | 0.1 (0.3) | 1.4 (1.6) | 1.5 (2.3) | 50.1 (6.2) | 50.0 (6.1) | 49.7 (6.6) | 50.1 (5.7) | 0.0 (0.0) | 50.2 (7.3) | 48.9 (6.0) | 0.0 (0.0) | |
| |$(100, 100)$| | 0.0 (0.0) | 0.0 (0.0) | 0.5 (0.9) | 1.2 (1.8) | 49.6 (7.1) | 49.7 (5.8) | 49.9 (6.9) | 48.3 (9.1) | 0.0 (0.0) | 50.4 (6.5) | 49.1 (6.2) | 0.0 (0.0) | |
| |$(150, 100)$| | 0.0 (0.0) | 0.0 (0.0) | 0.1 (0.3) | 1.1 (1.4) | 49.9 (6.5) | 49.6 (5.5) | 50.2 (5.4) | 49.5 (6.9) | 0.0 (0.0) | 49.2 (6.4) | 48.6 (6.3) | 0.0 (0.0) | |
With fixed |$p$|, increasing |$q$| from 50 to 100 results in much better performance for SDNCMV, RF, SVM, MQDA, and PLR. In contrast, with fixed |$q$|, increasing |$p$| from 100 to 150 results in worse performance. A question naturally aries, why the MLDA, vSVM, vPLR, vRF, mPLR perform so poorly? The reason lies in the fact that MLDA, vSVM, vPLR, vRF rely on the mean difference for classification, while the two groups both have mean zero in the data generating procedure. Our proposal provides an effective solution to classifying the test samples to the correct class, when two matrix-variate populations have the similar mean but different covariance structure. Most existing literature on classification except QDA assume that the two populations have mean difference but a common covariance matrix, which is not the case for the fMRI data. We also consider the scenarios where the mean matrices of individuals/two groups are different in Appendix S3 of the Supplementarymaterial available at Biostatistics online, and the results show that SDNCMV performs very well in these settings as well. Thus our proposal indeed serves as a powerful alternative to the QDA and can also take confounders into account in the matrix-variate setting.
3.3. Network comparison assessment
In order to assess the performance of differential network estimation, we compare our method with two joint multiple matrix Gaussian graphs estimation approaches proposed by Zhu and Li (2018), denoted as “Nonconvex” and “Convex.” Zhu and Li (2018) compared the performance of differential network estimation between their methods and some state-of-the-art vector-valued methods. They concluded that the former is better, so we do not compare our method with any vector-valued approaches in this study.
To evaluate the performance of the differential network estimators by these methods, we present the average values of TPR, TNR, and TDR over 100 replications, as well as the Precision-Recall (PR) curves.
Table 2 shows the TPRs, TNRs, and TDRs by different methods averaged over 100 replications for Scenarios 1–4 with |$n_1=n_2=30$|, with the threshold |$\tau$| selected by maximizing the sum of TPR and TDR. From Table 2, it can be seen that the three methods have comparable TPRs in all scenarios, while SDNCMV has comparable TNRs with the Nonconvex method, which are almost all higher than those of the Convex method. The superiority of SDNCMV is clearly shown from TDRs, which are higher than those of the Nonconvex and Convex methods by a large margin. Figure 3 shows the Precision-Recall curves for Scenarios 1–4 with different combinations of |$(p, q)$|, |$n_1=n_2=30$|, where red, blue, and green lines represent SDNCMV, Nonconvex, and Convex methods, respectively. From the PR curves, we can see the great advantages of SDNCMV over the Nonconvex and Convex methods in terms of differential network structure recovery.
TPR, TNR, and TDR averaged over 100 replications (%) for Scenario 1–4
| |$(p, q)=(100, 50)$| | |$(p, q)=(150, 50)$| | |$(p, q)=(100, 100)$| | |$(p, q)=(150, 100)$| | |||||||||||||
|---|---|---|---|---|---|---|---|---|---|---|---|---|---|---|---|---|
| Methods | TPR | TNR | TDR | TPR | TNR | TDR | TPR | TNR | TDR | TPR | TNR | TDR | ||||
| Scenario 1: AR for temporal structure and Hub for spatial structure | ||||||||||||||||
| SDNCMV | 88.6 | 99.9 | 94.9 | 81.6 | 99.9 | 92.3 | 95.9 | 99.9 | 98.1 | 89.4 | 99.9 | 96.9 | ||||
| Nonconvex | 88.7 | 95.8 | 38.7 | 77.7 | 99.3 | 37.4 | 99.7 | 98.8 | 37.7 | 98.4 | 99.2 | 37.7 | ||||
| Convex | 94.7 | 98.7 | 36.4 | 88.5 | 99.2 | 36.0 | 99.0 | 98.8 | 37.7 | 99.6 | 99.1 | 36.1 | ||||
| Scenario 2: AR for temporal structure and Small-World for spatial structure | ||||||||||||||||
| SDNCMV | 80.2 | 99.9 | 91.7 | 71.0 | 99.9 | 90.1 | 91.3 | 99.9 | 97.5 | 84.0 | 99.9 | 96.4 | ||||
| Nonconvex | 88.7 | 98.6 | 32.2 | 95.4 | 87.3 | 10.9 | 99.3 | 90.7 | 8.3 | 98.5 | 92.3 | 12.0 | ||||
| Convex | 87.3 | 98.4 | 29.9 | 94.7 | 91.5 | 15.4 | 99.5 | 92.0 | 4.2 | 92.7 | 95.0 | 13.1 | ||||
| Scenario 3: BC for temporal structure and Hub for spatial structure | ||||||||||||||||
| SDNCMV | 88.2 | 99.9 | 95.9 | 81.8 | 99.9 | 93.6 | 95.7 | 99.9 | 98.6 | 92.0 | 99.9 | 96.8 | ||||
| Nonconvex | 88.6 | 98.6 | 32.7 | 80.8 | 99.1 | 32.6 | 97.5 | 98.7 | 35.9 | 98.6 | 98.9 | 32.8 | ||||
| Convex | 94.4 | 98.0 | 27.2 | 89.3 | 98.8 | 27.4 | 96.9 | 98.8 | 37.4 | 97.0 | 99.0 | 33.7 | ||||
| Scenario 4: BC for temporal structure and Small-World for spatial structure | ||||||||||||||||
| SDNCMV | 79.5 | 99.8 | 91.6 | 74.9 | 99.9 | 91.3 | 91.9 | 99.9 | 97.0 | 86.2 | 99.9 | 95.0 | ||||
| Nonconvex | 1.00 | 10.3 | 2.0 | 95.4 | 80.9 | 7.6 | 99.7 | 79.2 | 6.7 | 98.3 | 89.6 | 11.7 | ||||
| Convex | 95.3 | 86.9 | 9.2 | 92.7 | 89.5 | 12.7 | 94.0 | 93.8 | 8.8 | 99.1 | 88.5 | 5.2 | ||||
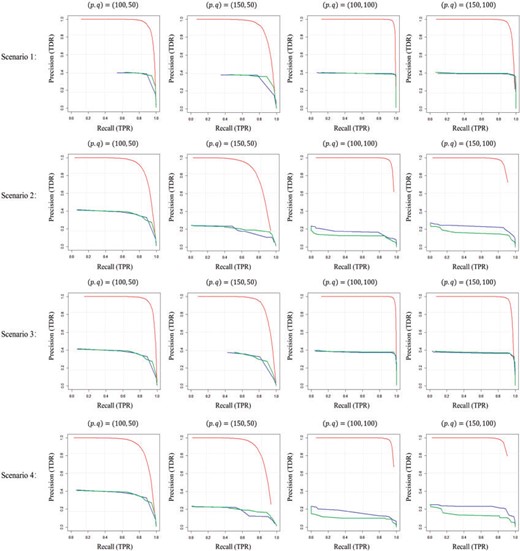
Precision-recall curve for Scenarios 1–4 with different combinations of |$(p, q)$|, |$n_1=n_2=30$|. Red, blue, and green lines represent SDNCMV, Nonconvex, and Convex methods, respectively.
In summary, the simulation results show that our method SDNCMV outperforms its competitors in terms of both classification accuracy and network comparison performance, illustrating its advantage in various scenarios.
4. The fMRI data of AD
4.1. Description of the data set and the preprocessing procedures
We apply the method to the Alzheimer’s Disease Neuroimaging Initiative (ADNI) study, which was launched in 2003 as a public–private partnership (Jack and others, 2008). One of the main purposes of the ADNI project is to examine differences in neuroimaging between AD patients and normal controls (NC). Data used in our analysis were downloaded from the ADNI website (http://www.adni.loni.usc.edu) and included resting state fMRI (rs-fMRI) images collected at screening for AD and CN participants. A T1-weighted high-resolution anatomical image (MPRAGE) and a series of resting state functional images were acquired with 3.0 T MRI scanner (Philips Systems) during longitudinal visits. The rs-fMRI scans were acquired with 140 volumes, TR/TE = 3000/30 ms, flip angle of 80 and effective voxel resolution of 3.3 mm |$\times$| 3.3 mm |$\times$| 3.3 mm. More details can be found at the ADNI website (http://www.adni.loni.usc.edu). Quality control was performed on the fMRI images both by following the Mayo clinic quality control documentation (version February 2, 2015) and by visual examination. After the quality control, 61 subjects are included for the analysis including |$n_1=30$| AD patients and |$n_2=31$| NC subjects. For gender distribution, there are 14 (47%) males for AD, and 14 (45%) males for CN. The mean (SD) of age for each group is 72.88 (7.12) for AD and 74.38 (5.93) for CN.
Standard procedures were taken to preprocess the rs-fMRI data. Skull stripping was conducted on T1 images to remove extra-cranial material. The first four volumes of the fMRI were removed to stabilize the signal, leaving 136 volumes for subsequent prepossessing. Each subject’s anatomical image was registered to the 8th volume of the slice-time-corrected functional image which was then normalized to the MNI (Montreal Neurological Institute) standard brain space. Spatial smoothing with a 6mm FWHM (full width at the half maximum) Gaussian kernel and motion corrections were applied to the function images. A validated confound regression approach (Satterthwaite and others, 2014; Wang and others, 2016; Kemmer and others, 2015) was performed on each subject’s rs-fMRI time series data to remove the potential confounding factors including motion parameters, global effects, white matter, and cerebrospinal fluid signals. Furthermore, motion-related spike regressors were included to bound the observed displacement and the functional time series data were band-pass filtered to retain frequencies between 0.01 Hz and 0.1 Hz—the relevant range for rs-fMRI.
To construct brain networks, we consider the Power’s 264 node system (Power and others, 2011) that provides good coverage of the whole brain. Therefore, the number of brain regions is |$p = 264$|, and the temporal dimension is |$q = 136$|. For each subject, we first use an efficient algorithm implemented by R package “DensParcorr” (Wang and others, 2016) to obtain the partial correlations between each pair of the 264 brain regions.
4.2. Classification results of the fMRI data
We apply the proposed SDNCMV method and other methods to classify AD and CN group based on the rs-fMRI connectivity. Since the number of between-region network measures is very large, i.e., |$p\times(p-1)/2=34,716$|, we first adopt a Sure Independence Screening (SIS) procedure (Fan and Lv, 2008) on the connectivity variables to avoid possible overfitting and improve computational efficiency. We use the R package “SIS” to filter out 85% of the variables, and retain the remaining |$5207$| variables in the active set. For a fair comparison, we adopt the same |$5207$| variables for the methods SDNCMV, RF, SVM, and PLR. For the method iPLR, we also filter out 85% of all the pairwise interaction variables. For the vector-valued methods vRF, vSVM, and vPLR, we apply the screening methods to filter 85% of the total |$p\times q=35,904$|. The MLDA is computationally intractable for this real data set and is thus omitted. For all the methods except MQDA, we take |$4$| confounders into account: age, education level, gender, and APOlipoprotein E. In Appendix S2 of the Supplementarymaterial available at Biostatistics online, we show the necessity of adjusting the confounders in this real example by comparing the results with/without adjusting the four confounders.
To assess the classification accuracy of different methods, we randomly select 20 subjects from the AD group and 21 subjects from the NC group as training subjects, leaving 10 subjects in each group as the test subjects. That is, we have 41 subjects in the training set and 20 in the test set. We repeat this random sampling procedure for 100 times and report the average misclassification errors in Table 3, and further show the boxplots of the errors in Figure 4. From Table 3, we can see that the proposed SDNCMV does not make any mistake in classifying the test subjects, neither does the SVM method. RF method also performs very well, compared with the vector-valued methods. In summary, the proposed SDNCMV has comparable performance with these well accepted machine learning methods.
Averaged misclassification rates % (standard errors) over 100 bootstrap replicates for the ADNI fMRI data
| Method | SDNCMV | RF | SVM | PLR | vRF | vSVM | vPLR | MQDA | mPLR | iPLR |
|---|---|---|---|---|---|---|---|---|---|---|
| Error | 0.0 (0.0) | 1.3 (2.7) | 0.0 (0.0) | 34.8 (9.0) | 8.1 (6.5) | 2.6 (3.5) | 37.4 (10.3) | 49.4 (2.6) | 48.6 (3.8) | 28.2 (7.1) |
| Method | SDNCMV | RF | SVM | PLR | vRF | vSVM | vPLR | MQDA | mPLR | iPLR |
|---|---|---|---|---|---|---|---|---|---|---|
| Error | 0.0 (0.0) | 1.3 (2.7) | 0.0 (0.0) | 34.8 (9.0) | 8.1 (6.5) | 2.6 (3.5) | 37.4 (10.3) | 49.4 (2.6) | 48.6 (3.8) | 28.2 (7.1) |
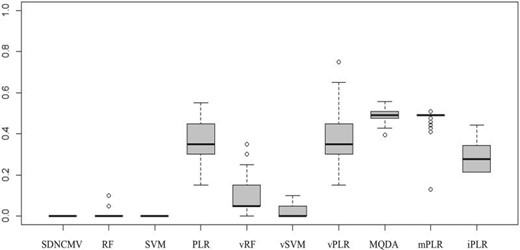
Boxplot of classification errors for the fMRI data of Alzheimer’s disease over 100 bootstrap replicates.
4.3. Network comparison results of the fMRI data
For network comparisons between the AD and NC group, we use all the 30 AD subjects and 31 NC groups. We assign the 264 nodes in the Power’s system to 14 functional modules. Figure 5 visualizes the location and number of nodes for each functional module and nodes with different colors indicate that they belong to different function modules. For more information, see https://github.com/brainspaces/power264. All the brain visualizations in this article were created using BrainNet Viewer proposed by Xia and others (2013). For the SDNCMV method, we adopt the same screening procedure as described in the last section and we determine the threshold |$\tau$| as follows. We draw a scree plot in Figure 6, the horizontal axis is the value of |$\tau$| and the vertical axis is the number of the estimated differential edges by SDNCMV. From Figure 6, we can see that when |$\tau$| is greater than about 100, the change in the number of differential edges begins to be stable. Therefore, we selected 100 as the predetermined value for threshold |$\tau$|. For the Nonconvex and Convex methods, the tuning parameter |$\lambda$| was selected by minimizing a prediction criterion by using 5-fold CV as described in Zhu and Li (2018). Finally, there were totally 105 differential edges identified by SDNCMV, 3316 differential edges identified by Nonconvex and 14,826 differential edges identified by Convex. The Convex and Nonconvex methods select so many differential edges that we only show the top 10% edges with the largest absolute values in Figure 7. Even so, the differential edges identified by the Nonconvex and Convex methods are too dense to be biologically interpretable.
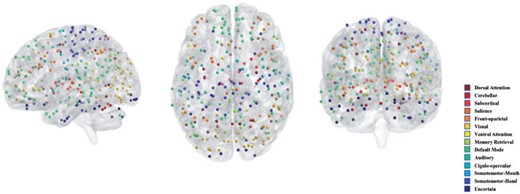
Functional modules for the 264 nodes.
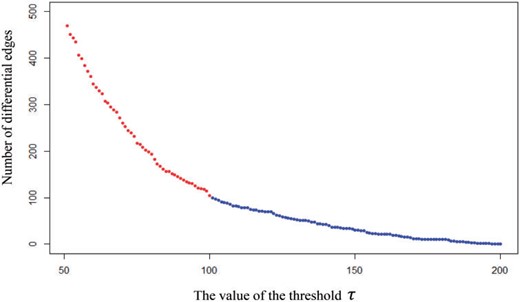
Scree plot for the method SDNCMV.
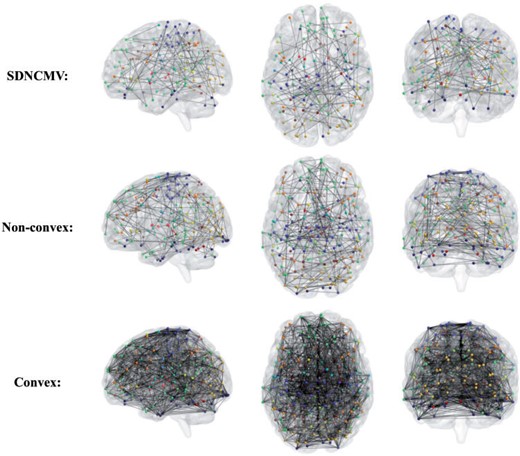
Differential edges identified by various methods for the AD resting-state fMRI data.
When examining the 105 differential edges identified by the proposed SDNCMV, we find that they mainly involve nodes located in the Somatomotor-Hand, Default Mode, and Cingulo-opercular modules. In Table 4, we show the top 15 differential edges identified by SDNCMV and their number of occurrences over 200 bootstrap replicates. The Somatomotor-Hand is the hand movement controlling part of the somatic motor area which occupies most of the central anterior gyrus and executes movements selected and planned by other areas of the brain. Suva and others (1999) indicated that the Somatomotor area significantly affects AD and suggested that motor dysfunction occurs in late and terminal stages of AD. The default mode is a group of brain regions that show lower levels of activity when we are engaged in a particular task like paying attention, but higher levels of activity when we are awake and not involved in any specific mental exercise. Abundance of literature has shown that default mode changes are closely related to AD (Grieder and others, 2018; Banks and others, 2018; Pei and others, 2018). Cingulo-opercular are composed of anterior insula/operculum, dorsal anterior cingulate cortex, and thalamus. The function of Cingulo-opercular has been particularly difficult to characterize due to the network’s pervasive activity and frequent co-activation with other control-related networks. Nevertheless, some scholars have studied its relationship with AD. For example, Tumati and others (2020) found that loss of segregation in Cingulo-opercular network is associated with apathy in AD and suggested that network-level changes in AD patients may underlie specific neuropsychiatric symptoms. In summary, the findings from the proposed SDNCMV are consistent with evidences from a wide range of neuroscience and clinical studies.
The differential edges identified by SDNCMV whose number of occurrences over 200 bootstrap replicates are in top 15
| Differential edges | Occurrences/Percentages |
|---|---|
| Somatomotor-Hand |$\leftrightarrow$| Ventral Attention | 198/99% |
| Cingulo-opercular |$\leftrightarrow$| Uncertain | 197/98.5% |
| Default Mode |$\leftrightarrow$| Dorsal Attention | 192/96% |
| Somatomotor-Mouth |$\leftrightarrow$| Cingulo-opercular | 190/95% |
| Default Mode |$\leftrightarrow$| Default Mode | 188/94% |
| Default Mode |$\leftrightarrow$| Dorsal Attention | 186/93% |
| Somatomotor-Hand |$\leftrightarrow$| Visual | 185/92.5% |
| Somatomotor-Hand |$\leftrightarrow$| Default Mode | 183/91.5% |
| Front-oparietal |$\leftrightarrow$| Subcortical | 183/91.5% |
| Default Mode |$\leftrightarrow$| Dorsal Attention | 182/91% |
| Cingulo-opercular |$\leftrightarrow$| Subcortical | 175/87.5% |
| Default Mode |$\leftrightarrow$| Salience | 173/86.5% |
| Somatomotor-Hand |$\leftrightarrow$| Default Mode | 170/85% |
| Default Mode |$\leftrightarrow$| Visual | 170/85% |
| Uncertain |$\leftrightarrow$| Salience | 169/84.5% |
5. Summary and discussions
In the article, we focus on the network comparison and two-class classification problem for matrix-valued fMRI data. We propose an effective method which fulfills the goals of network comparison and classification simultaneously. Numerical study shows that SDNCMV has advantageous performance over the state-of-the-art methods for classification and network comparison methods. We also illustrate the utility of the SDNCMV method by analyzing the fMRI data of AD. Our method can be widely applied in BCAD and image-guided medical diagnoses of complex diseases.
The matrix-normal assumption of the matrix-valued data can be relaxed so that we only assume a Kronecker product covariance structure. In the presence of outliers or heavy-tailed data, we can propose a similar robust version of SDNCMV. In detail, the sample covariance matrix in (2.1) can be replaced by some robust estimators such as the adaptive Huber estimator and the median of means estimator (Avella-Medina and others, 2018). Another way to relax the matrix-normal assumption is the matrix-non-paranormal distribution in Ning and Liu (2013), which can be viewed as a latent-variable model. That is, the latent variables |$f(\boldsymbol{\text{X}})$| follow a matrix-normal distribution and must be symmetric, while the observed variables |$\boldsymbol{\text{X}}$| need not be symmetric. In this case, we adopt the Kendall’s tau based correlation estimators in (2.1), which has been widely studied in literature such as Liu and others (2012), He and others (2018,2019), Fan and others (2018), Yu and others (2019), etc.
In the second-stage model, we focus on a binary outcome response and adopt the logistic regression for classification. It is straightforward to extend to a general clinical outcome response with a more flexible generalized linear model (GLM). In addition, if some prior information on the network structure is known in advance, we may fully utilize this information by adjusting the corresponding penalty |$P_{\lambda}(\boldsymbol{\beta})$| in (2.4). For instance, if hub nodes are desired in the differential network, a hierarchical group bridge penalty (Zhang and others, 2017) on |$\boldsymbol{\beta}$| may be added. The PLR with hierarchical group bridge penalty and elastic-net penalty may be solved by mainstream algorithm such as “Coordinate Descent.” This is also an interesting and promising research direction and we leave it as our future work. Finally, some future work remains to develop inferential tools on the significance of a selected edge, e.g., in both global testing and multiple testing problems based on the logistic regression model in (2.3).
6. Software
Software in the form of R package, together with a sample input data set and complete documentation is available at https://github.com/heyongstat/SDNCMV.
Supplementary material
Supplementarymaterial is available at http://biostatistics.oxfordjournals.org.
Acknowledgments
The authors would like to thank the Editors, the Associate Editor and three anonymous reviewers for helpful comments.
Conflict of Interest: None declared.
Funding
The National Natural Science Foundation of China (11801316, 81803336, 11871309, 11971116); the National Key R&D Program of China (2018YFA0703900); Natural Science Foundation of Shandong Province (ZR2018BH033, ZR2019QA002); “the Fundamental Research Funds of Shandong University” (2020GN051), and National Center for Advancing Translational Sciences (UL1TR002345 to L.L.). Data collection and sharing for this project was funded by the Alzheimer’s Disease Neuroimaging Initiative (ADNI) (National Institutes of Health Grant U01 AG024904) and DOD ADNI (Department of Defense award number W81XWH-12-2-0012). ADNI is funded by the National Institute on Aging, the National Institute of Biomedical Imaging and Bioengineering, and through generous contributions from the following: AbbVie, Alzheimer’s Association; Alzheimer’s Drug Discovery Foundation; Araclon Biotech; BioClinica, Inc.; Biogen; Bristol-Myers Squibb Company; CereSpir, Inc.; Cogstate; Eisai Inc.; ElanPharmaceuticals, Inc.; Eli Lilly and Company; EuroImmun; F. Hoffmann-La Roche Ltd and its affiliated company Genentech, Inc.; Fujirebio; GE Healthcare; IXICO Ltd.; Janssen Alzheimer Immunotherapy Research & Development, LLC.; Johnson & Johnson Pharmaceutical Research & Development LLC.; Lumosity; Lundbeck; Merck & Co., Inc.; Meso Scale Diagnostics, LLC.; NeuroRx Research; Neurotrack Technologies; Novartis Pharmaceuticals Corporation; Pfizer Inc.; Piramal Imaging; Servier; Takeda Pharmaceutical Company; and Transition Therapeutics. The Canadian Institutes of Health Research is providing funds to support ADNI clinical sites in Canada. Private sector contributions are facilitated by the Foundation for the National Institutes of Health (www.fnih.org). The grantee organization is the Northern California Institute for Research and Education, and the study is coordinated by the Alzheimer’s Therapeutic Research Institute at the University of Southern California. ADNI data are disseminated by the Laboratory for NeuroImaging at the University of Southern California.
Footnotes
Data used in preparation of this article were obtained from the Alzheimers Disease Neuroimaging Initiative (ADNI) database (adni.loni.usc.edu). As such, the investigators within the ADNI contributed to the design and implementation of ADNI and/or provided data but did not participate in analysis or writing of this report. A complete listing of ADNI investigators can be found at: adni.loni.usc.edu/wp-content/uploads/how to apply/ADNI Acknowledgement List.pdf.
References
Author notes
Hao Chen and Jiadong Ji are the co-first authors.
