


SUMMARY
Between-sample normalization is a critical step in genomic data analysis to remove systematic bias and unwanted technical variation in high-throughput data. Global normalization methods are based on the assumption that observed variability in global properties is due to technical reasons and are unrelated to the biology of interest. For example, some methods correct for differences in sequencing read counts by scaling features to have similar median values across samples, but these fail to reduce other forms of unwanted technical variation. Methods such as quantile normalization transform the statistical distributions across samples to be the same and assume global differences in the distribution are induced by only technical variation. However, it remains unclear how to proceed with normalization if these assumptions are violated, for example, if there are global differences in the statistical distributions between biological conditions or groups, and external information, such as negative or control features, is not available. Here, we introduce a generalization of quantile normalization, referred to as smooth quantile normalization (qsmooth), which is based on the assumption that the statistical distribution of each sample should be the same (or have the same distributional shape) within biological groups or conditions, but allowing that they may differ between groups. We illustrate the advantages of our method on several high-throughput datasets with global differences in distributions corresponding to different biological conditions. We also perform a Monte Carlo simulation study to illustrate the bias-variance tradeoff and root mean squared error of qsmooth compared to other global normalization methods. A software implementation is available from https://github.com/stephaniehicks/qsmooth.
1. Introduction
Multi-sample normalization methods are an important part of any data analysis pipeline to remove systematic bias and unwanted technical variation, particularly in high-throughput data, where systematic effects can cause perceived differences between samples irrespective of biological variation. Many global adjustment normalization methods (Gagnon-Bartsch and Speed, 2012; Hicks and Irizarry, 2015) have been developed based on the assumption that observed variability in global properties is due to technical reasons and are unrelated to the biology of the system under study (Bolstad and others, 2003; Reimers, 2010). Examples of global properties include differences in the total, upper quartile (Bullard and others, 2010) or median gene expression, proportion of differentially expressed genes (pDiff) (Anders and Huber, 2010; Robinson and others, 2010; Love and others, 2014), observed variance across expression levels (Durbin and others, 2002) and statistical distribution across samples.
Quantile normalization is a global adjustment normalization method that transforms the statistical distributions across samples to be the same and assumes global differences in the distribution are induced by technical variation (Amaratunga and Cabrera, 2001; Bolstad and others, 2003). The observed distributions are forced to be the same to achieve normalization and the average distribution (average of each quantile across samples) is used as the reference.
Several studies have evaluated quantile normalization and other global adjustment normalization methods (Robinson and others, 2010; Bullard and others, 2010; Aanes and others, 2014; Dillies and others, 2013a). Under the assumptions of global adjustment normalization methods, quantile normalization has been shown to reduce the variance in observed gene expression data with a tradeoff of inducing a small amount of bias (due to the bias-variance tradeoff) (Bolstad and others, 2003; Qiu and others, 2014). However, when the assumptions of global adjustment normalization methods are violated (e.g., if the majority of genes are up-regulated in one biological condition relative to another (Lovén and others, 2012; Aanes and others, 2014; Hu and others, 2014; Evans and others, 2016)), forcing the distributions to be the same can lead to errors in downstream analyses. Graphical and quantitative assessments (Hicks and Irizarry, 2015) have been developed to assess the assumptions of global normalization methods.
If global adjustment methods are found not to be appropriate, another class of normalization methods can be applied (application-specific methods), but these often rely on external information such as positive and negative control features (Lovén and others, 2012) or experimentally measured data (Aanes and others, 2014). However, these methods may also not be appropriate if the latent variables are important sources of biological variability Leek and others, 2012. Furthermore, it is unclear how to proceed with normalization if the assumptions about the observed variability in global properties are violated (Hicks and Irizarry, 2015), such as they may occur when there are global differences in the statistical distributions between tissues (Figure 1), and external information is not available.
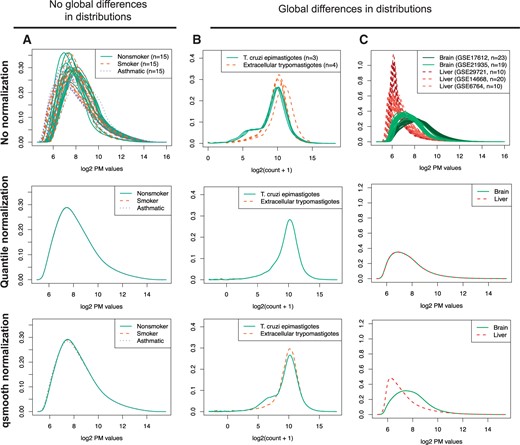
Using biological information to preserve global differences in distributions. Under the conditions of no global differences in distributions (A), qsmooth is similar to standard quantile normalization. Under the conditions of global differences in distributions (B) and (C), quantile normalization removes the global differences by making the distributions the same, but qsmooth preserves global differences in distributions. Examples of gene expression data with (A) PM values from n = 45 arrays comparing the gene expression of alveolar macrophages from nonsmokers, smokers and patients with asthma. (B) Gene counts from n = 7 from RNA-Seq samples comparing the T. cruzi life cycle at the epimastigote (insect vector) stage and extracellular trypomastigotes. Counts have an added pseudocount of 1 and then are log 2 transformed. (C) PM values from n = 82 arrays comparing brain and liver tissue samples.
Here, we introduce a generalization of quantile normalization, referred to as smooth quantile normalization (qsmooth), which is based on the assumption that the statistical distribution of each sample should be the same (or have the same distributional shape) within a biological group (or condition), but that the distribution may differ between groups. At each quantile, a weight is computed comparing the variability between groups relative to the total variability between and within groups (Equation 2.2). In one extreme with a weight of zero, qsmooth corresponds to quantile normalization within each biological group when there are global differences in distributions corresponding to differences in biological groups. As the variability between groups decreases, the weight increases towards one and the quantile is shrunk towards the overall reference quantile (Equation 2.3) and qsmooth is equivalent to standard quantile normalization. In certain domains of the distributions, the quantiles from different biological groups may be more or less similar to each other depending on the biological variability, which is reflected in the weight varying between 0 and 1 across the quantiles.
Using several high-throughput datasets, we demonstrate the advantages of qsmooth, which include (1) preservation of global differences in distributions corresponding to different biological conditions, (2) non-reliance on external information, (3) applicability to many different high-throughput technologies, and (4) the return of normalized data that can be used for many types of downstream analyses including finding differences in features (genes, CpGs, etc), clustering and dimensionality reduction. We also perform a Monte Carlo simulation study to illustrate the bias-variance tradeoff when using qsmooth.
2. Methods
2.1. qsmooth: smooth quantile normalization
The raw feature values are substituted with the |$F_i^{qsmooth}(u)$| values and then the transformed values are placed in the original order similar to quantile normalization.
We compared qsmooth to other normalization methods using simulated data and publicly available gene expression and DNA methylation (DNAm) datasets with global differences in distributions. Specifically, we used Affymetrix gene expression data comparing brain and liver tissues, RNA-Seq gene counts from the T. cruzi life cycle, RNA-Seq gene counts from the genotype-tissue expression (GTEx) consortium, and sorted whole blood cell populations measured on DNAm arrays. For a complete description of the data used, see Section 5.1.
3. Results
3.1. Global differences in distributions in gene expression and DNA methylation data
We assessed how global normalization methods impact control features, namely the External RNA Control consortium (ERCC) spike-ins (Jiang and others, 2011), in samples comparing the gene expression from brain and liver tissue in rats (see bodymapRat data set in Section 2).
We found that global normalization methods remove the global differences in distribution between brain and liver tissues and induce artificial differences in the spike-in controls compared to using the raw data, including quantile normalization (|$p <2.2e^{-16}$|), Relative Log Expression (RLE) normalization (Anders and Huber, 2010) (|$p <2.2e^{-16}$|), and median normalization (|$p <2.2e^{-16}$|) (Figure 2; see Figures 1 and 2 of supplementary material available at Biostatistics online). In contrast, our method, qsmooth, greatly reduces artificial differences induced between the distributions of the spike-in control genes (|$p = 9.2e^{-05}$|).
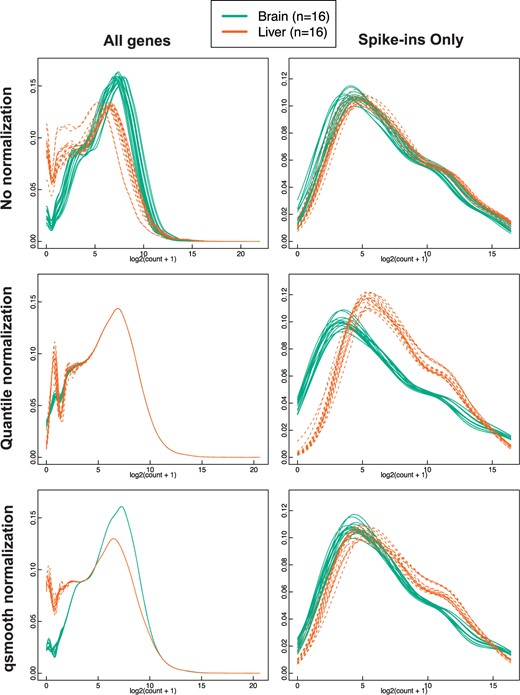
Quantile normalization induces artificial differences in spike-in control genes using data with global differences in distributions. Comparing no normalization (row 1), quantile normalization (row 2) and qsmooth (row 3) applied RNA-Seq gene counts from brain and liver tissues in the bodymapRat dataset. Column 2 contains the density plots for only the spike-in control genes. Counts have an added pseudocount of 1 and then are log 2 transformed.
Using the data from the GTEx (GTEx Consortium, 2015), we compared qsmooth to a number of scaling normalization methods including, RLE, Trimmed Mean of M-Values (TMM) (Robinson and others, 2010), and upper quartile scaling (Bullard and others, 2010). We observed that scaling methods did not sufficiently control for variability between distributions within tissues; in particular, we observed stark differences in global distribution for a number of body regions, most pronounced between testes, whole blood and other tissues such as artery tibial (Figure 3; see Figure 3 of supplementary material available at Biostatistics online). Normalizing tissues with global differences (in distribution) using a tissue-specific reference distribution, such as in qsmooth, can reduce the root mean squared error (RMSE) of the overall variability across distributions compared to quantile normalization (Paulson and others, 2016). This occurs because qsmooth is based on the assumption that the statistical distribution of each sample should be similar within a biological group, but not necessarily across biological groups.
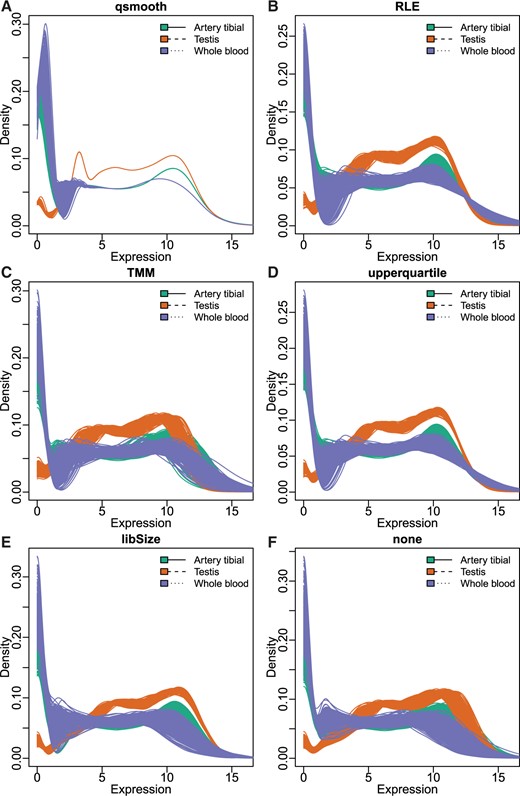
Scaling normalization methods do not adequately control within-group variability. Comparing density plots following either qsmooth (A), Relative Log Expression (RLE) (B), Trimmed Mean of M-Values (TMM) (C), upper quartile scaling (upperquartile) (D), library size (libSize) (E) or no (none) (F) normalization. Plotted are the artery tibial and the testis tissues from the GTEx consortium. All counts have an added pseudocount of 1 and then are log2 transformed.
To demonstrate the importance of preserving tissue-specific differences, we assessed the impact of normalization using quantile normalization and qsmooth using two genes, ENSG00000160882 (CYP11B1) and ENSG00000164532 (TBX20). These two genes are known to be highly expressed in specific tissues (Figure 4; see Table 1 of supplementary material available at Biostatistics online). The CYP11B1 gene has been shown to play a critical role in congenital adrenal hyperplasia (Zachmann and others, 1983; Curnow and others, 1993; Joehrer and others, 1997) and the TBX20 gene plays an important role in cardiac chamber differentiation in adults (Cai and others, 2005; Singh and others, 2005; Stennard and others, 2005; Takeuchi and others, 2005; Qian and others, 2008). In both genes, we found that quantile normalization removes the biologically known tissue-specific expression. In contrast, qsmooth preserves the tissue-specificity, which is also observed just using the raw data. In particular, the CYP11B1 gene is highly expressed in the testis tissue using both qsmooth normalized and raw data, but it is reported as lowly expressed in the testis tissue after applying quantile normalization. Using qsmooth normalized data and raw data, we observe the tissue-specific gene as highly expressed in heart atrial appendage and heart left ventricle tissues, but lowly expressed in the same tissues after applying quantile normalization. Furthermore, expression of this gene is spuriously inflated in other tissues after quantile normalization.
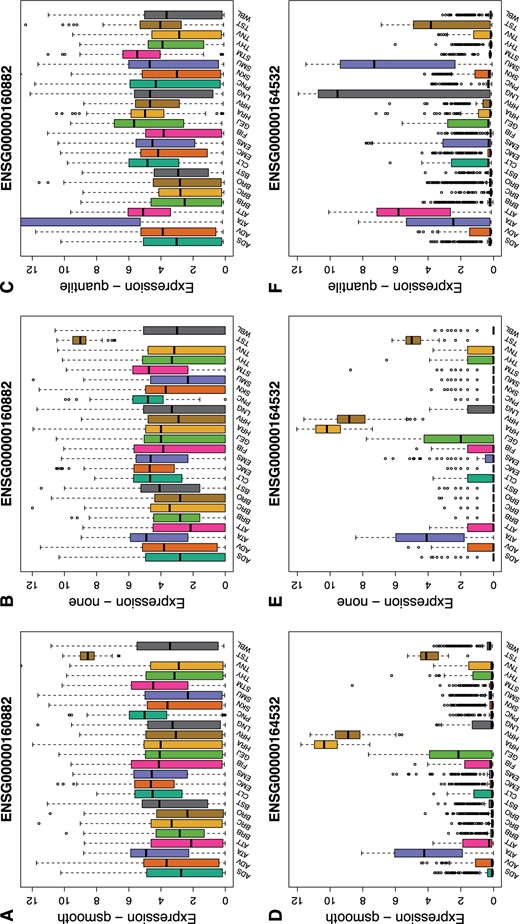
Gene-specific effects induced from quantile normalization. Boxplots of the normalized expression for ENSG00000160882 (CYP11B1) and ENSG00000164532 (TBX20) are shown for 24 tissues profiled by GTEx. Top, we see CYP11B1 is more highly expressed in testis (TST) and more lowly expressed in other tissues in both (A) qsmooth and (B) raw expression profiles. However, following quantile normalization (C) CYP11B1 is relatively lowly expressed in TST but now more variably and highly expressed in the artery aorta (ATA). CYP11B1 produces 11 beta-hydroxylase, a final step necessary to convert 11-deoxycortisol into cortisol. Steroid 11 beta-hydroxylase deficiency is the second most common cause (5-8|$\%$|) of congenital adrenal hyperplasia (Zachmann and others, 1983; Curnow and others, 1993; Joehrer and others, 1997). Bottom (D, E), TBX20 is a member of the T-box family and encodes the TBX20 transcription factor and helps dictate cardiac chamber differentiation and in adults regulates integrity, function and adaptation (Cai and others, 2005; Singh and others, 2005; Stennard and others, 2005; Takeuchi and others, 2005; Qian and others, 2008). We see TBX20 highly expressed in both raw and qsmooth normalized heart atrial appendage and left ventricle tissues (HRA, HRV). However, following (F) quantile normalization, expression of the gene in both heart tissues is almost zero and several other tissues are more highly or variably expressed.
We also tested qsmooth using publicly available DNAm data from six purified cell types in whole blood that are known to exhibit global differences in DNAm (Hicks and Irizarry, 2015). Using qsmooth, the global differences in distributions are preserved across purified cell types (Figure 5). Furthermore, the cell types cluster more closely along the first two principal components compared to using the raw data or quantile normalized data, because qsmooth accounts for cell type-specific differences in DNAm and removes technical variability across samples within each cell-type. We explored using different measures of methylation levels and found consistent results using either beta values with offsets of 10 or 100 (Figure 5) or M values (see Figure 4 of supplementary material available at Biostatistics online). For a description of the different measures of methylation levels considered, see Section 5.1.
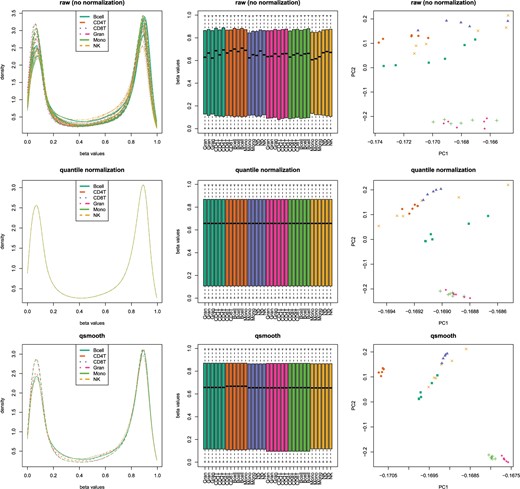
Density plots (column 1) and boxplots (column 2) with global changes in distributions of beta values from n = 35 Illumina 450K DNAm arrays comparing raw data (row 1), quantile normalized data (row 2) and qsmooth data (row 3) on six purified cell types from whole blood: CD14+ Monocytes (Mono), CD19+ B-cells (Bcell), CD4+ T-cells (CD4T), CD56+ NK-cells (NK), CD8+ T-cells (CD8T), and Granulocytes (Gran). Column 3 shows first two principal components using three normalization methods.
3.2. The bias-variance tradeoff of qsmooth
We performed a Monte Carlo simulation study to evaluate the performance of qsmooth when the assumptions related to the observed variability in global properties are violated with the detection of differentially expressed genes as a measure of overall performance. We generated gene-level RNA-Seq counts and varied the pDiff between biological groups.
As others have noted, when testing for differential expression between groups, quantile normalization results in a small increased bias with a tradeoff of a reduction in variance compared to using the raw data (see Figure 5 of supplementary material available at Biostatistics online). Under the assumptions of global normalization methods, qsmooth performs similarly to quantile normalization. This results in a smaller RMSE compared to using the raw data. As the number of differentially expressed genes increases, qsmooth improves upon this tradeoff, resulting in a reduction in the variance compared to using the raw data, but qsmooth also reduces the bias compared to using quantile normalization by accounting for global differences between the biological groups, particularly when the assumptions of global normalization methods are violated.
4. Conclusions
Global normalization methods are useful for removing unwanted technical variation from high-throughput data. However, they are based on the assumption that observed variability in global properties is due only to technical factors and is unrelated to the biology of the system under study. While these assumptions are usually fine when comparing closely related samples, large-scale studies are increasingly generating data where those assumptions do not hold. In cases where these global assumptions are violated, more robust forms of normalization are needed to allow for different distributions in different classes of samples.
Application-specific normalization methods can be applied, but these methods rely on the use of external information such as positive or negative control features or experimentally measured information, which are often not available. Furthermore, these methods are also based on assumptions about the nature of the measured distributions, and these have been shown to be violated in many situations (Dillies and others, 2013b; Risso and others, 2014).
The new method we describe here, smooth quantile normalization (qsmooth), is based on the assumption that the statistical distribution of each sample should be the same (or have the same distributional shape) within a biological group or condition, but it does not require that different groups or conditions have the same distribution. Our method also does not require any external information other than sample group assignment, it is not specific to one type of high-throughput data, and it returns normalized data that can be used for many types of downstream analyses including finding differences in features (genes, CpGs, etc), clustering and dimensionality reduction.
Furthermore, our method can be combined with tools such as ComBat (Johnson and others, 2007) designed to remove known batch effects. For example, using gene expression data from a bladder cancer study (Dyrskjøt and others, 2004) with known batches, qsmooth preserves the global variation between the normal and cancer bladder samples after removing the variation due to the known batches (see Figure 6 of supplementary material available at Biostatistics online). The applicability of adaptive penalties applied here on other normalization approaches is worth exploring as future research as well as the applicability of qsmooth-like methods in settings where experimental factors that should be normalized against are not known or specified.
We demonstrated the advantages of qsmooth using several high-throughput datasets that exhibit global differences in distributions between biological conditions, such as the global changes in gene expression profiles in brain and liver. We illustrated the bias-variance tradeoff when using qsmooth, which preserves global differences in distributions corresponding to different biological conditions. We have implemented our normalization method into the qsmooth R-package, which is available on GitHub (https://github.com/stephaniehicks/qsmooth).
5. Datasets
5.1. Datasets with global differences in distributions
We downloaded Affymetrix GeneChip gene expression data for alveolar macrophages (GSE2125), brain (GSE17612, GSE21935), and liver (GSE29721, GSE14668, GSE6764) samples in human as reported by a number of studies archived in the gene expression omnibus (GEO) (Edgar and others, 2002). We extracted the raw perfect match (PM) values from the CEL files using the affy (Gautier and others, 2004) R/Bioconductor package for gene expression. We also used 57 cancer and normal bladder samples measuring gene expression from five batches in the bladderbatch R/Bioconductor experimental data package (Dyrskjøt and others, 2004; Leek, 2016).
We downloaded raw RNA-Seq gene counts from the T. cruzi life cycle (Li and others, 2016). We also downloaded and mapped raw sequencing reads to obtain raw RNA-Seq gene counts for multiple tissues from the Rat BodyMap project (Yu and others, 2014) (GSE53960). These data are also available as an R data package on GitHub (https://github.com/stephaniehicks/bodymapRat) (see supplementary material available at Biostatistics online for more details). Counts have an added pseudocount of 1 and then are log2 transformed. We used the Kolmogorov–Smirnov test for global differences in distributions in spike-ins from the bodymapRat gene expression data.
Gene expression data from the GTEx consortium was downloaded from the GTEx portal (http://www.gtexportal.org/) and processed using YARN (Paulson and others, 2016) (http://bioconductor.org/packages/yarn) (see supplementary material available at Biostatistics online for more details).
The sorted whole blood cell populations measured on Illumina 450K DNAm arrays were obtained from FlowSorted.Blood.450k R/Bioconductor data package (Jaffe, 2015) and the raw beta values (|$\beta = \frac{M}{M + U + \text{offset}}$|), where |$M$| and |$U$| denote the methylated and unmethylated signals and offset = 100 is a default parameter in the minfi R/Bioconductor package (Aryee and others, 2014). We explored using location and scale transformations by using different offsets in the beta values and using M values (|$M = \log(\frac{M}{U}) = logit(\beta)$|). We found consistent results regardless of the location or scale transformation used.
5.2. Monte Carlo simulation study
We used the polyester R/Bioconductor package (Frazee and others, 2015) to simulate gene-level RNA-Seq counts while varying the proportion of differentially expressed genes (pDiff) to obtain samples with global differences in the distributions between biological conditions. Each simulation study considered ten samples from two groups (total of 20 samples). We added additional sample-specific noise by scaling the samples with a scalar drawn from a uniform distribution ranging from 0.5 to 1.5.
As our measure of performance in the detection of differentially expressed genes, we compared the output of qsmooth to both quantile normalized data and raw (unnormalized) gene counts. We assessed the bias-variance tradeoff and RMSE of the log 2 fold change using these three methods while varying the proportion of differentially expressed genes between two groups. The plots were created with the ggplot2 R package (Wickham 2009).
6. Software
The R-package qsmooth implementing our method is available on GitHub (https://github.com/stephaniehicks/qsmooth).
Supplementary Material
Supplementary material is available at http://biostatistics.oxfordjournals.org.
Acknowledgments
Conflict of Interest: None declared.
Funding
NIH R01 grants from the National Institute of General Medical Sciences (GM083084 and RR021967/GM103552 to S.C.H and R.A.I.). National Heart, Lung and Blood Institute supported partially (5P01HL105339, 5R01HL111759, 5P01HL114501 to J.N.P and J.Q.), the National Cancer Institute (5P50CA127003, 1R35CA197449, 1U01CA190234, 5P30CA006516), and the National Institute of Allergy and Infections Disease (5R01AI099204). NIH R01 grants from the National Human Genome Research Institute (HG005220 to H.C.B and K.O.), and the National Institute of General Medical Sciences (GM114267 to H.C.B.).
