


Abstract
Seagrasses, corals, marsh plants, kelps, and mangroves support valuable coastal ecosystems but are threatened by environmental stressors. The need to manage these foundation taxa has spurred more than a decade of study on the relationship between genetic diversity and function or stability. We synthesized this literature base (129 relevant publications) and found more reported instances of neutral to positive relationships between genetic diversity and function than negative. However, much of the scientific understanding is based on the response of three genera and from unreplicated observational studies that correlate genetic diversity to measured response variables. When a disturbance was present, the studies often lacked controls or baseline data. Only 5.5% of the studies robustly tested for stability. These shortcomings preclude a rigorous evaluation of whether more genetically diverse foundation populations increase stability and hinder the use of genetics-based conservation strategies. Future studies should be focused on diverse species and ecosystem-level impacts using manipulative designs.
Seagrasses, corals, marsh plants, kelps, and mangroves are all major contributors to primary production and form the foundation of shallow water ecosystems. They are critical habitat for a large diversity of invertebrates and fish (Zimmerman et al. 2002, Nagelkerken et al. 2008, Christie et al. 2009, Coker et al. 2014, Cullen-Unsworth et al. 2014) and provide structure that buffers wave energy and prevents shoreline erosion (Walters et al. 2008, Nelson and Zavaleta 2012, Christianen et al. 2013, Ferrario et al. 2014, Teagle et al. 2017). Despite their value, these foundational taxa are vulnerable to disturbances, and the coastal ecosystems they support have been heavily degraded and threatened (Gardner et al. 2003, Waycott et al. 2009, 2015, Krumhansl et al. 2016, Goldberg et al. 2022). The proximity of coastal ecosystems to terrestrial ecosystems makes them vulnerable to disturbances such as oil spills, eutrophication, coastal development, and hurricanes (Crain et al. 2009). Furthermore, they face increasing pressures brought about by climate change, such as sea level rise, and altered rainfall and freshwater delivery patterns (Wong et al. 2014). The conservation and restoration of foundational species is needed to maintain ecosystem services and function, but this has become an increasingly difficult task, given these multiple threats. Management efforts of coastal ecosystems have proven unsuccessful in many instances because of the vulnerability of organisms to environmental stressors (Boström and Mattila 2005, Cunha et al. 2012, Lovelock et al. 2022). To provide long-term protection and restoration of ecosystem services, managers need to focus on mechanisms that promote ecosystem function and stability (Unsworth et al. 2015).
One potential way to ensure ecosystem function and the stability of coastal ecosystems is for managers to consider the genetic variation of foundational species. Genetic diversity plays a role in shaping ecological responses, defined as any measurable effect at the species, population, community, or ecosystem level, such as population dynamics and species interactions, as well as the stability of these responses (Hoban et al. 2022). These concepts are referred to in ecological theory under two different but related hypotheses, referred to as the diversity–function and diversity–stability hypotheses, respectively. The diversity–function hypothesis states that ecosystems that harbor communities with higher species diversity maintain greater ecosystem productivity and function (Steudel et al. 2012). Under diversity–stability, Elton hypothesized that simpler ecosystems or those with fewer species interactions are more easily perturbed than complex ones with greater diversity (Elton 1958). Communities with higher diversity are believed to have species that occupy overlapping niches (Rosenfeld 2002). This redundancy within niches then prevents the community from entering an alternative stable state after a disturbance, because the species that do survive will maintain the functions of those that did not. Under the diversity–stability hypothesis is the concept of resilience. Resilience refers to both resistance and recovery (Hodgson et al. 2015). Resistance is the ability of an ecosystem to buffer the initial adverse effects of a disturbance. Recovery is the ability to return to its original state after a disturbance has passed.
Although researchers often focus on the role of species diversity in contributing to function response variables and stability, these two hypotheses apply to diversity on the genetic level as well (Vellend and Geber 2005). The ecological effects of genetic variation have been well studied in agricultural settings where increasing genetic varieties of a crop has increased overall crop yield or resistance to disease outbreaks (Smithson and Lenné 1996, Jump et al. 2009). It is also widely accepted that genetic rescue, adding genetic variation into a population through deliberate introductions, prevents populations from experiencing inbreeding depression (Hedrick and Garcia-Dorado 2016). However, increasing genetic diversity does not necessarily result in greater function and stability, because the relationship between the ecological response and diversity can be nonlinear. The ecological response can initially increase as diversity increases and can then plateau at a certain level because of complex interactions in time and space (Qiu and Cardinale 2020). The relationship between genetic diversity and function or stability can also depend on interspecific interactions and the ecological mechanisms involved in shaping these relationships (Des Roches et al. 2017).
The mechanisms that contribute to the relationship between diversity and ecological responses can be categorized as additive or nonadditive. In additive mechanisms, the relative initial abundance of each genotype and the ecological response of individual genotypes in a monoculture predict the overall outcome when grown in a polyculture. In nonadditive mechanisms, which are the most common, the response for a genetically diverse population is not predictable from the measurements of genotypes in isolation (Hughes et al. 2008, Whitlock 2014). Within the two categories of additive and nonadditive, there are four main processes that contribute to the relationship between diversity and function or stability: niche complementarity, facilitation, and sampling and selection effects. In some cases, the general term complementarity is used to refer to both niche complementarity and facilitation, which are both nonadditive mechanisms (Hughes et al. 2008, Vanelslander et al. 2009). Niche complementarity occurs when individuals or species use resources differently, limiting competition (Tilman 1999). Facilitation occurs when a species modifies the environment to benefit other species (Vandermeer 1989). Sampling effects, which is a common additive mechanism, arise because the probability of sampling a higher functioning genotype is greater in more diverse populations (Hector et al. 2002, Kettenring et al. 2014). Selection effects can occur in populations in which a high-functioning genotype dominates the population over time (Huston 1997, Kettenring et al. 2014). A more detailed discussion of the mechanisms can be found in Hughes and colleagues’ (2008) review.
Biotic and abiotic factors play a role in shaping genetic diversity and its relationship to function and stability, potentially affecting the relative strength of the previously mentioned processes (Procaccini et al. 2001, Sinclair et al. 2014, Foust et al. 2016). Regional environmental conditions and large-scale disturbances can affect genetic diversity by leading to the dominance of a single resistant genotype that can withstand some changes in water quality (Diaz-Almela et al. 2007). The frequency and duration of abiotic stressors can also, in turn, affect diversity and stability. For example, intense pulsed or chronic disturbances can lead to a loss of genetic diversity and local extinction (Banks et al. 2013). Furthermore, the ability of a community or population to withstand a disturbance will depend on the baseline standing stock of genetic diversity.
It has been over a decade since some of the early investigations of the relationship between genetic diversity and ecological responses in marine foundational species. Some research has shown that high genetic variation in marine primary producers increases productivity and stability (Hughes and Stachowicz 2004, Zogg and Travis 2022), which also translates into benefits for higher-order consumers (Reusch 2005, Reynolds et al. 2012). But there have been some examples from the literature where greater genotypic variation did not enhance stability (Robertson et al. 2017, Connolly et al. 2018). Recently, a meta-analysis of 16 publications for marsh plants and seagrasses indicated an overall positive correlation between genetic diversity and function and stability for these habitat forming species (Salo and Gustafsson 2016). Our objective was to expand on this former review by focusing more broadly on coastal foundational taxa including corals, kelps, and mangroves along with marsh plants and seagrasses. These five taxa exhibit different life histories and dispersal patterns and have different requirements for survival that may influence the impact of genetic diversity on function and stability.
Our objectives were to quantitatively summarize metadata in the existing literature to assess what is known about the genetic diversity–function and genetic diversity–stability relationships, to identify limitations in the current scientific understanding, and to suggest future avenues of research to inform conservation management action. Rather than conducting a meta-analysis on the data from past studies, we performed an analysis of the metadata because we felt this approach was best suited for the objectives of the study. We wanted to include the plethora of observational and correlative studies on the topic, which would not be advisable in a meta-analysis, where the combination of approaches can bias the resulting effect sizes such as the log response ratio or Hedge's g (Gates 2002). We focused our efforts on publications that could test a prediction of the diversity–function hypothesis (prediction 1) and two predictions of the diversity–stability hypothesis (predictions 2 and 3). Following the idealized diversity–function relationship, high genetic diversity is positively correlated with the measured response variables (prediction 1). Prediction 2, following the diversity–stability hypothesis, is that high genetic diversity helps maintain ecological responses under a disturbance, and in prediction 3, high genetic diversity confers greater resilience to a disturbance.
Survey of the literature
To survey for literature applicable to the diversity–function and diversity–stability hypotheses for five coastal foundation taxa, we performed a Web of Science search in December 2021 using the following search string:
The initial search returned 1533 publications from peer-reviewed journals, which were each screened for relevance and inclusion by a team of researchers (figure 1). To be included in the extraction process, the publications could not be a review or a meta-analysis and had to focus on one of the focal foundation species, to contain a metric of genetic diversity (e.g., genotypic richness, allelic diversity), and to include a measured response variable (e.g., survival, metabolism, production, or whole-ecosystem function) or the environment (e.g., temperature, salinity, irradiance). When a publication met these three requirements, we noted whether the study design included replication at all levels (within and among diversity and disturbance treatments or observations). Furthermore, if these studies included any kind of disturbance, we noted whether the authors reported baseline information on a response variable before the disturbance began and whether they included proper controls (i.e., plots or treatments that did not experience a disturbance). A publication was categorized as having a disturbance if the authors described it as such; it could be either a one-time event or chronic stressor.
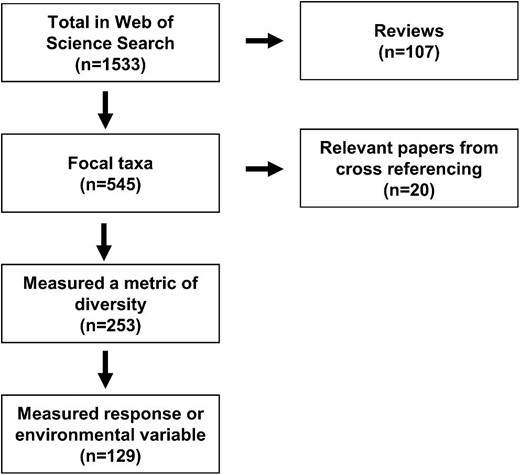
A literature search was conducted using search terms in the Web of Science on 1 December 2021. The publications returned were screened for inclusion. The publications in which one of the five focal taxa was not studied or in which a metric of genetic diversity was not measured were excluded. All of the reviews and meta-analyses were excluded, and the literature cited was screened for relevant publications. Metadata and outcomes were extracted from the remaining publications if they were able to test prediction 1, 2, or 3.
We noted which hypothesis (diversity–function or diversity–stability) each publication would be able to test and determined which specific predictions of those hypotheses each publication assessed. In order to test the prediction that high genetic diversity is positively correlated with a measured response variable (prediction 1), a publication was required to report measurements of both genetic variation and at least one response variable. To evaluate whether high genetic diversity helps maintain a response variable under a disturbance (prediction 2), a publication must have measurements of genetic diversity and response variables, as well as a recorded stressor. A before–after–control–impact (BACI) design is required to test whether genetic diversity confers greater resilience to a disturbance (prediction 3). In this instance, a publication must measure a response variable and genetic diversity metric both before and after a disturbance regime, in comparison to a control that does not experience the disturbance.
To minimize personal bias between researchers in the selection process, the team held a workshop where we evaluated the relevancy, inclusion, and categorization of five publications on the basis of the criteria described above. Once we all agreed on these aspects, the 1533 publications returned by the search were split into three sets of 511 publications. A pair of researchers were assigned to each set. Both researchers in each pair independently evaluated at least 140 publications in their assigned set for the inclusion criteria and hypothesis prediction the publication could test. The two researchers then compared their evaluations and resolved any discrepancies. On reaching full agreement, one or both researchers would move on to finish the remainder in the set. When an agreement could not be reached between the two researchers, the publication was reviewed by a larger committee and was included or not on the basis of majority consensus. Reviews and meta-analyses (107 of the 1533) were not included in our data set, but the literature cited was cross-referenced to find 20 additional relevant publications (figure 1).
We extracted metadata from 129 publications that met our inclusion criteria. Metadata on the study design and results of each publication were extracted by one of four reviewers. Information on the focal organism (taxon and species), the study type (observational or manipulative), location (field or laboratory), region (including GPS coordinates when provided), and study duration were extracted from each publication. When the researchers collected data from or conducted experiments at multiple sites, the GPS coordinates for all sites were recorded in order to assess where the studies had been conducted and to identify gaps in geographical location. Publications that included metrics of coral Symbiodinium diversity were included into the coral category. A single coral species can be functionally different because of the type of symbionts, so the nine Symbiodinium types were, for this purpose, considered genetically different entities of coral.
We recorded the type of diversity metric used and the observed range of these values reported by each study. If the study manipulated levels of genetic diversity, we also noted the total number of levels in the study and the number of replicates used at each level. A list of all metrics used in each publication was compiled for each taxon (supplemental table S1). When a paper reported multiple metrics, each metric was tallied separately. The values are reported as the percentage of the total number of metrics tallied rather than the total number of publications.
Measured diversity metrics were divided into eight different categories (table S1). Genotypic information consisted of measurements such as a calculated genotypic richness, the number of genotypes, and evenness. The allelic information category included measurements such as number of alleles and calculations of allelic richness and allelic diversity. The haplotype or clade metrics category included the number of clades, the number of ITS-2 (ribosomal internal transcribed spacer 2) types, and the haplotype diversity. Other categories included observed heterozygosity, expected heterozygosity, inbreeding coefficients (FIS and FST), nucleotide specific metrics, and diversity indices (Simpson's index, the Shannon Wiener index, etc.).
We recorded any environmental variables reported in the study and observed ranges because abiotic environmental variables can alter genetic variation itself and affect the strength of the relationship between genetic variation and response variables (supplemental table S2). Based on the results, we tallied publications that showed a correlation between genetic diversity and one or more environmental metric. The type and duration (in days) of any manipulated or natural disturbances that occurred during the study were recorded. In studies in which a disturbance was manipulated, the number of levels of each stress treatment was recorded. In studies involving a natural or accidental disturbance, it was noted whether the stressor was ongoing after the study ended.
We recorded the response variables used in each study and noted how many times throughout the experiment it was measured. The extracted response variables were categorized into six categories: abundance, physiology, morphometric, reproduction, community, and ecosystem (tables 1a–1c). Abundance metrics consisted of measurements such as density and biomass. Physiology included metrics related to metabolism, pigment content, and growth rates. Morphometric measurements included height, length, width, and surface area. Reproduction consisted of measurements such as flower and fruit production and seed count. Community metrics were those that related to any other organism beyond the focal species. For example, macrofauna abundance, levels of herbivory, and grazer and epiphyte biomass or diversity were all counted as community metrics. Ecosystem-level metrics were those that described an ecological process and would affect all organisms such as nutrient cycling or decomposition. The number of metrics in each category was tallied for each taxon in both hypotheses (diversity–function and diversity–stability). The results are reported as a percentage of instances in each category out of the total number reported for each taxon. We noted whether the study showed a positive, neutral, or negative correlation between each response variable and a genetic diversity metric. The outcome was listed solely on the basis of its correlative relationship with genetic diversity and not on the basis of the nature of the response variable. For example, a paper that reports a positive correlation between herbivory rates and genetic diversity in a focal species would still be counted as positive even though increased herbivory might have a detrimental effect on the focal species. In many cases, researchers measured a suite of response variables and genetic diversity metrics, which can lead to a combination of positive, negative, and neutral results. These cases are noted accordingly in tables 1a–1c.
Summary of the measured response variables and respective outcomes for each relevant publication organized by taxa for prediction 1 and the listed metrics of function as they were reported in the publication as a function of taxa.
| Response variable | Response | |||
|---|---|---|---|---|
| Taxa | Source | category | variable | Outcome |
| Seagrasses | Evans et al. 2016 | Abundance | Biomass | Positive or neutral |
| Shoot density | Neutral | |||
| Morphometric | Leaf surface area | Positive or neutral | ||
| Physiology | Nitrogen content | Neutral | ||
| Productivity | Positive or neutral | |||
| Total phenolics | Neutral | |||
| Community | Epiphyte biomass | Positive | ||
| Fish counts | Untested or not reported | |||
| Herbivory | Positive or neutral | |||
| Salo and Gustafsson 2016 | Abundance | Shoot density | Neutral | |
| Survival | Positive | |||
| Abbott et al. 2017 | Abundance | Biomass | Positive or negative | |
| Survivorship | Neutral | |||
| Physiology | Leaf elongation | Positive or neutral | ||
| Community | Invertebrate abundance | Positive | ||
| Reusch et al. 2005 | Abundance | Biomass | Positive | |
| Shoot density | Positive | |||
| Sinclair et al. 2020 | Reproduction | Flower production | Neutral | |
| Fruit production | Neutral | |||
| Seed to ovule ratio | Neutral | |||
| Williams et al. 2018 | Ecosystem | Ammonification | Neutral | |
| Detritus degradation rates | Neutral | |||
| Detritus standing stock | Neutral | |||
| Hughes and Stachowicz 2009 | Abundance | Shoot density | Positive | |
| Community | Epiphyte algal biomass | Negative or neutral | ||
| Máñez-Crespo et al. 2020 | Abundance | Aboveground biomass | Positive | |
| Belowground biomass | Positive | |||
| Root weight ratio | Neutral | |||
| Shoot density | Untested or not reported | |||
| Morphometric | Leaf length | Untested or not reported | ||
| Leaf width | Untested or not reported | |||
| Total leaf area | Negative | |||
| Physiology | Number of leaves per shoot | Untested or not reported | ||
| Reproduction | Seed count | Positive | ||
| Community | Epiphyte load | Positive | ||
| Hays et al. 2021 | Abundance | Coverage | Untested or not reported | |
| Number of vegetative shoots | Neutral | |||
| Morphometric | Length | Untested or not reported | ||
| Reproduction | Number of flowering shoots | Positive or negative | ||
| Number of seeds per spadix | Untested or not reported | |||
| Number of spathes per flowering shoot | Untested or not reported | |||
| Jahnke et al. 2015 | Abundance | Initial number of leaves | Untested or not reported | |
| Shoot density | Positive | |||
| Morphometric | Initial leaf length | Untested or not reported | ||
| Physiology | Leaf carbon content | Untested or not reported | ||
| Leaf growth | Untested or not reported | |||
| Leaf nitrogen content | Positive | |||
| State of the apical part of each leaf | Untested or not reported | |||
| Reproduction | Flower abundance | Positive or negative | ||
| Community | Direct herbivory rates | Untested or not reported | ||
| Hughes et al. 2016 | Abundance | Aboveground biomass | Positive | |
| Belowground biomass | Positive | |||
| Morphometric | Maximum root length | Positive | ||
| Maximum shoot length | Positive | |||
| Rhizome length | Neutral | |||
| Shoot width | Positive | |||
| Physiology | Number of leaves per shoot | Positive | ||
| Reproduction | Number of seedlings per plot | Neutral | ||
| Martínez-García et al. 2021 | Morphometric | Leaf length | Untested or not reported | |
| Leaf width | Untested or not reported | |||
| Williams and Davis 1996 | Abundance | Bed area | Neutral | |
| Reynolds et al. 2012 | Abundance | Shoot density | Positive | |
| Morphometric | Maximum shoot height | Positive | ||
| Physiology | Leaf nitrogen content | Neutral | ||
| Seagrass productivity (leaf elongation) | Positive | |||
| Community | Invertebrate density | Neutral | ||
| Novak et al. 2017 | Abundance | Aboveground wet weight | Untested or not reported | |
| Belowground wet weight | Untested or not reported | |||
| Number of shoots | Positive or neutral | |||
| Morphometric | Internode length | Untested or not reported | ||
| Leaf length | Untested or not reported | |||
| Lead weight | Untested or not reported | |||
| Leaf width | Untested or not reported | |||
| Sheath length | Untested or not reported | |||
| Physiology | Number of leaves per shoot | Untested or not reported | ||
| Evans et al. 2018 | Abundance | Biomass | Untested or not reported | |
| Survival | Positive | |||
| Morphometric | Leaf surface area | Negative | ||
| Physiology | Leaf elongation | Negative | ||
| Nitrogen content | Positive | |||
| Nonstructural carbohydrates | Positive | |||
| Root growth | Negative | |||
| Total phenolics | Neutral | |||
| Community | Herbivory | Neutral | ||
| Micheli et al. 2015 | Abundance | Shoot biomass | Neutral | |
| Shoot density | Neutral | |||
| Morphometric | Leaf length | Neutral | ||
| Leaf width | Neutral | |||
| Physiology | Numbe of leaves per shoot | Neutral | ||
| Abbott and Stachowicz 2016 | Abundance | Aboveground biomass | Neutral | |
| Belowground biomass | Neutral | |||
| Zhang et al. 2020 | Abundance | Biomass | Negative | |
| Number of vegetative shoots | Untested or not reported | |||
| Shoot density | Negative | |||
| Morphometric | Shoot height | Negative | ||
| Reproduction | Flowering shoot density | Neutral | ||
| Number of flowering shoots | Neutral | |||
| Seedbanks | Positive | |||
| Zhang et al. 2019 | Abundance | Biomass | Not reported or untested | |
| Meadow area | Not reported or untested | |||
| Number of vegetative shoots | Not reported or untested | |||
| Shoot density | Not reported or untested | |||
| Morphometric | Shoot height | Not reported or untested | ||
| Reproduction | Number of flowering shoots | Not reported or untested | ||
| Number of spathes per shoot | Not reported or untested | |||
| Pollinated spathes per shoot | Not reported or untested | |||
| Seed density | Not reported or untested | |||
| Reusch 2003 | Reproduction | Seed set | Positive | |
| Corals | Qin et al. 2019 | Physiology | Zooxanthellae density | Untested or not reported |
| Forcioli et al. 2011 | Physiology | Chlorophyll a | Not reported or untested | |
| Zooxanthellae density | Not reported or untested | |||
| Wilkinson et al. 2018 | Physiology | Chlorophyll content | Positive | |
| Host protein biomass | Positive | |||
| Symbiont density cell or size | Negative | |||
| Manzello et al. 2019 | Abundance | Percentage cover | Untested or not reported | |
| Physiology | Coral condition, bleaching | Untested or not reported | ||
| Richards et al. 2013 | Other | Extinction risk | Neutral | |
| Bay, LK; Doyle, J; Logan, M; Berkelmans, R | Abundance | Percentage mortality | Neutral | |
| Physiology | Prevalence of bleaching | Neutral | ||
| Sawall et al. 2015 | Abundance | Tissue biomass | Untested or not reported | |
| Physiology | Calcification rates | Untested or not reported | ||
| Metabolic rates | Untested or not reported | |||
| Mucus release rates | Untested or not reported | |||
| Respiration | Untested or not reported | |||
| Tissue protein concentration | Untested or not reported | |||
| Prada et al. 2008 | Abundance | Number of terminal branches | Untested or not reported | |
| Polyp density | Untested or not reported | |||
| Morphometric | Average length of terminal branches | Untested or not reported | ||
| Branch thickness | Untested or not reported | |||
| Calice diameter | Untested or not reported | |||
| Capstan length | Untested or not reported | |||
| Capstan width | Untested or not reported | |||
| Club length | Untested or not reported | |||
| Club width | Untested or not reported | |||
| Colony height | Untested or not reported | |||
| Intercalice distance | Untested or not reported | |||
| Spindle length | Untested or not reported | |||
| Spindle width | Untested or not reported | |||
| Surface area | Untested or not reported | |||
| Marsh Plants | Sommerville et al. 2013 | Reproduction | Seed production | Positive |
| Noto and Hughes 2020a | Abundance | Biomass | Positive | |
| Mortality | Untested or not reported | |||
| Number of live stems | Positive | |||
| Morphometric | Maximum stem height | Positive | ||
| Reproduction | Number of flowering plants | Untested or not reported | ||
| Hughes 2014 | Abundance | Percentage cover | Neutral | |
| Plant spatial spread | Positive | |||
| Stem density | Positive or neutral | |||
| Morphometric | Stem height | Positive | ||
| Community | Abundance of associated macrofauna | Neutral | ||
| Bernik et al. 2021 | Abundance | Aboveground biomass | Untested or not reported | |
| Belowground biomass | Untested or not reported | |||
| Shoot density | Untested or not reported | |||
| Morphometric | Inflorescence length | Untested or not reported | ||
| Leaf length | Untested or not reported | |||
| Shoot diameter | Untested or not reported | |||
| Shoot height | Untested or not reported | |||
| Physiology | Number of leaves per shoot | Untested or not reported | ||
| Reproduction | Inflorescence count | Untested or not reported | ||
| Seed weight | Untested or not reported | |||
| Kettenring et al. 2010 | Abundance | Patch area | Positive | |
| Physiology | Foliar nutrients | Untested or not reported | ||
| Reproduction | Seed viability | Positive | ||
| Travis and Proffitt 2016 | Abundance | Stem density | Neutral | |
| Kelps | Choi et al. 2015 | Abundance | Thallus dry weight | Neutral |
| Morphometric | Lamina length | Neutral | ||
| Lamina width | Neutral | |||
| Lateral length | Neutral | |||
| Lateral width | Neutral | |||
| Number of laterals | Neutral | |||
| Stipe diameter | Neutral | |||
| Stupe length | Neutral | |||
| Total length | Neutral | |||
| Oppliger et al. 2014 | Reproduction | Spore production | Untested or not reported | |
| Mangroves | Craig et al. 2020 | Community | Bacterial communities | Neutral |
| Guo et al. 2018 | Abundance | Health | Positive | |
| Schaeffer-Novelli et al. 2018 | Abundance | Aboveground biomass | Untested | |
| Belowground biomass | Untested |
Note: Response variable category refers to one of the six categories used to describe the type of function that was reported: abundance, morphometric, physiological, reproduction, community, and ecosystem. The response variable column lists the specific metric each publication used. The outcomes are reported solely on the basis of the correlative nature of the relationship.
Summary of the measured response variables and respective outcomes for each relevant publication organized by taxa for prediction 2 and the listed metrics of function as they were reported in the publication as a function of taxa.
| Response variable | Response | |||
|---|---|---|---|---|
| Taxa | Source | category | variable | Outcome |
| Seagrasses | Evans et al. 2017 | Physiology | Leaf elongation | Neutral |
| Maximum quantum yield | Neutral | |||
| Hughes et al. 2010 | Abundance | Biomass | Positive | |
| Shoot density | Untested or not reported | |||
| Community | Grazer biomass | Positive | ||
| Grazer reproductive effort | Neutral | |||
| Plaisted et al. 2020 | Abundance | Ramet survival | Untested or not reported | |
| Total number of shoots | Untested or not reported | |||
| Morphometric | Internode length | Untested or not reported | ||
| Length of second youngest leaf | Untested or not reported | |||
| Number of nodes | Untested or not reported | |||
| Number of roots per node | Untested or not reported | |||
| Rhizome diameter | Untested or not reported | |||
| Root length | Untested or not reported | |||
| Terminal shoot sheath length | Untested or not reported | |||
| Total rhizome length | Untested or not reported | |||
| Width of second youngest leaf | Untested or not reported | |||
| Physiology | Number of leaves per terminal shoot | Untested or not reported | ||
| Other | Resilience, combined percentage ramet survival, number of shoots produced per rhizome, and rhizome elongation rate | Positive | ||
| Connolly et al. 2018 | Abundance | Biomass | Negative | |
| Physiology | Chlorophyll a concentration | Negative | ||
| Micheli et al. 2012 | Abundance | Shoot density | Positive | |
| Morphometric | Leaf length | Untested or not reported | ||
| Leaf width | Untested or not reported | |||
| Tuya et al. 2019 | Abundance | Aboveground biomass | Untested or not reported | |
| Belowground biomass | Untested or not reported | |||
| New leaf biomass | Untested or not reported | |||
| Number of shoots | Positive | |||
| Morphometric | Leaf length | Untested or not reported | ||
| Leaf surface area | Untested or not reported | |||
| Leaf width | Untested or not reported | |||
| Sheath length | Untested or not reported | |||
| Physiology | Leaf elongation | Untested or not reported | ||
| Number of leaves per shoot | Untested or not reported | |||
| Community | Epifaunal abundance | Untested or not reported | ||
| Arnaud-Haond et al. 2010 | Abundance | Number of new shoots | Negative | |
| Number of surviving shoots | Positive | |||
| Massa et al. 2013 | Abundance | Remaining shoots in each subplot | Positive or neutral | |
| Reynolds et al. 2018 | Morphometric | Leaf toughness | Untested or not reported | |
| Tensile strength | Untested or not reported | |||
| Physiology | Carbon content | Untested or not reported | ||
| Nitrogen content | Untested or not reported | |||
| Phenolic content | Untested or not reported | |||
| Community | Consumer survival | Positive or negative | ||
| Consumption of grass by grazers | Positive or neutral | |||
| Reusch 2005 | Abundance | Vegetation cover | Untested or not reported | |
| Vegetative shoot densities | Untested or not reported | |||
| Reproduction | Reproductive shoot densities | Untested or not reported | ||
| Hughes and Stachowicz 2004 | Abundance | Number of shoots per plot | Positive | |
| Community | Epiphyte biomass | Neutral | ||
| Invertebrate abundance | Neutral | |||
| Ecosystem | Sediment porewater ammonium concentration | Negative | ||
| Tuya et al. 2021 | Abundance | Meadow area | Untested or not reported | |
| Number of shoots in each plot | Positive | |||
| Physiology | Leaf elongation | Neutral | ||
| Reproduction | Seed density | Positive | ||
| Alberte et al. 1994 | Morphometric | Leaf width | Untested or not reported | |
| Shoot height | Untested or not reported | |||
| Ruiz et al. 2018 | Physiology | Plant growth | Untested or not reported | |
| Reproduction | Flowering intensity, number of shoots with inflorescences | Positive | ||
| Macreadie et al. 2014 | Abundance | Percentage cover | Neutral | |
| Shoot density | Neutral | |||
| Morphometric | Canopy height | Neutral | ||
| Community | Epiphytes | Neutral | ||
| Presence of flora and fauna | Positive | |||
| Marín-Guirao et al. 2018 | Abundance | Mortality | Untested or not reported | |
| Ratio above to belowground biomass | Untested or not reported | |||
| Physiology | Chlorophyll a | Untested or not reported | ||
| Leaf elongation | Untested or not reported | |||
| Diaz-Almela et al. 2007 | Abundance | Shoot mortality | Neutral | |
| Reproduction | Recruitment | Neutral | ||
| Paulo et al. 2019 | Abundance | Shoot density | Untested or not reported | |
| Morphometric | Leaf length | Untested or not reported | ||
| Reproduction | Seedling density | Untested or not reported | ||
| Corals | Baums et al. 2006 | Abundance | Colony density | Neutral |
| Physiology | Active disease occurrence | Untested or not reported | ||
| Drury et al. 2019 | Abundance | Coral cover | Positive | |
| Physiology | Coral condition, bleaching | Untested or not reported | ||
| Coral growth | Neutral | |||
| Williams et al. 2014 | Abundance | Percentage live tissue cover | Negative | |
| Morphometric | Height | Untested or not reported | ||
| Length | Untested or not reported | |||
| Width | Untested or not reported | |||
| Underwood et al. 2006 | Abundance | Percentage cover | Untested or not reported | |
| Cárdenas‐Alvarado et al. 2021 | Abundance | Coral cover | Positive | |
| Ladd et al. 2017 | Abundance | Percentage live tissue cover | Neutral | |
| Morphometric | Colony height | Neutral | ||
| Colony length | Neutral | |||
| Colony width | Neutral | |||
| Physiology | Prevalence of bleaching | Neutral | ||
| Prevalence of disease | Neutral | |||
| Jaziri et al. 2017 | Morphometric | Basal diameter | Untested or not reported | |
| Branching pattern | Untested or not reported | |||
| Colony height | Untested or not reported | |||
| Marsh Plants | Noto and Hughes 2020b | Abundance | Aboveground biomass | Positive |
| Belowground biomass | Neutral | |||
| Stem density | Neutral | |||
| Morphometric | Stem height | Positive | ||
| Zogg and Travis 2022 | Morphometric | Stem height | Positive | |
| Kettenring et al. 2011 | Reproduction | Seed viability | Positive | |
| Edwards et al. 2005 | Abundance | Biomass | Untested or not reported | |
| Stem density | Untested or not reported | |||
| Kelps | Wernberg et al. 2018 | Physiology | Canopy regrowth | Positive |
| Variation in photosynthetic performance | Positive | |||
| Liesner et al. 2020 | Physiology | Carbon content | Neutral | |
| Chlorophyll content | Neutral | |||
| Growth rate | Neutral | |||
| Nitrogen content | Neutral | |||
| PAM | Neutral | |||
| Xanthophyll content | Neutral |
Note: Response variable category refers to one of the six categories used to describe the type of function that was reported: abundance, morphometric, physiological, reproduction, community, and ecosystem. The response variable column lists the specific metric each publication used. The outcomes are reported solely on the basis of the correlative nature of the relationship.
Summary of the measured response variables and respective outcomes for each relevant publication organized by taxa for prediction 3 and the listed metrics of function as they were reported in the publication as a function of taxa.
| Taxa | Source | Response variable category | Response variable | Outcome |
|---|---|---|---|---|
| Seagrasses | Ehlers et al. 2008 | Abundance | Aboveground biomass | Neutral |
| Belowground biomass | Neutral | |||
| Number of shoots | Positive | |||
| Hughes and Stachowicz 2011 | Abundance | Biomass | Positive | |
| Shoot density | Positive | |||
| Williams 2001 | Abundance | Average number of leaf shoots per clone | Positive | |
| Shoot counts | Untested or not reported | |||
| Morphometric | Direction of growth | Untested or not reported | ||
| Physiology | Average rate of leaf shoot production | Positive | ||
| Leaf counts | Untested or not reported | |||
| Reproduction | Seed germination | Positive | ||
| Marsh Plants | Hughes et al. 2018 | Abundance | Biomass | Neutral |
| Stem density | Neutral | |||
| Morphometric | Stem height | Neutral | ||
| Physiology | Leaf growth | Neutral | ||
| Reproduction | Flower production | Neutral | ||
| Seed production | Neutral |
Note: Response variable category refers to one of the six categories used to describe the type of function that was reported: abundance, morphometric, physiological, reproduction, community, and ecosystem. The response variable column lists the specific metric each publication used. The outcomes are reported solely on the basis of the correlative nature of the relationship.
Overview of the literature
The number of publications reporting the relationship between genetic diversity with a response variable or environmental metric for the five focal taxa has increased steadily through time (figure 2a). The majority (79%) of the 129 relevant studies included in the final data set occurred in the last decade.
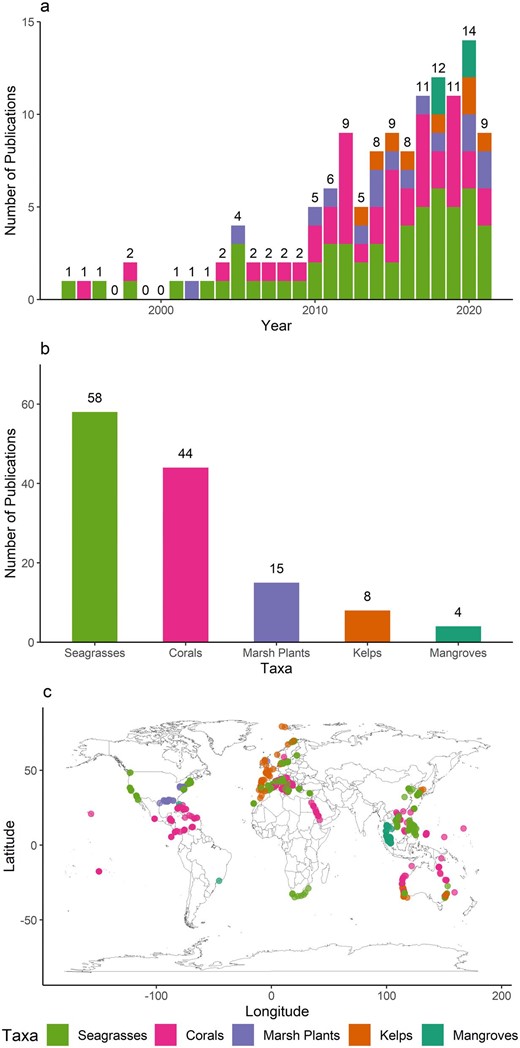
Research focus on genetic diversity with environment and response variable. Publications (N = 129) has greatly increased through time for focal taxa (a). The topic focus has centered largely on seagrasses and corals. The number of relevant papers in which each of the five focal taxa were studied: seagrasses, corals, marsh plants, kelps, and mangroves (b). The study locations reflect the distribution of focal taxa. The locations of each of the study sites within these publications as a function of taxa. The points are as reported or estimated on the basis of detailed information provided in the publications. If the studies provided more than one set of GPS coordinates, they were all included (c).
Most of the publications that met our extraction requirements were focused on seagrasses (45% of 129 total), followed by corals (34%), marsh plants (12%), kelps (6%), and mangroves (3%; figure 2b). Within the seagrass-focused publications, most studied Zostera spp. or Posidonia spp.; these two genera alone accounted for 84% of the seagrass publications (39% of total; supplemental figure S1a). Within the marsh-plant-focused publications, 73% (9% out of the total) studied Spartina alterniflora (supplemental figure S1c). Of the studies in which corals were studied, 36% were focused on the diversity of the Symbiodinium rather than the coral host. There were 10 different species of corals represented within studies that measured the diversity of the coral host (supplemental figure S1b). A greater number (72) of different coral species were studied in publications that measured the diversity of the Symbiodinium (supplemental table S3). The list of coral species studied was varied, and no one species encompassed the majority of studies. There were nine species studied within four mangrove-focused publications (supplemental figure S1e). Within the eight kelp-focused publications, three studied Ecklonia radiata, and two studied Laminaria digitata (supplemental figure S1d).
The studies occurred globally on every continent except Antarctica (figure 2c). The location of the study was largely dependent on the distribution of the five focal foundational taxa. The studies reporting on seagrass diversity with a response or environmental variable (58 publications) occurred in the Mediterranean (21%) and in other European water bodies (21%) and, to a lesser extent, occurred in the North Pacific (18%). Most of the coral studies occurred in the Indo-Pacific region and Australia (21% each of 44 coral publications). Of the coral studies, 18% occurred in the Mediterranean, where soft corals are predominant. Over half of the marsh plant studies occurred in the Gulf of Mexico (53% of 15 total marsh publications), with the North Atlantic (20%) being the next most popular place for study. Four out of the eight publications on kelps occurred in Europe, whereas two out of the four mangrove publications occurred in the Indo-Pacific.
The categories of diversity metrics reported included genotypic information, allelic information, observed heterozygosity, expected heterozygosity, inbreeding coefficients, diversity indices, nucleotide specific metrics, and haplotype or clade metrics (table S1). It was common for the authors to summarize several genetic diversity metrics in one publication. Out of 129 publications, we tallied a total of 409 instances of a reported diversity metric. The most common metric was genotypic information (33%), followed by allelic information (19%) and expected (14%) and observed (13%) heterozygosity (figure 3).
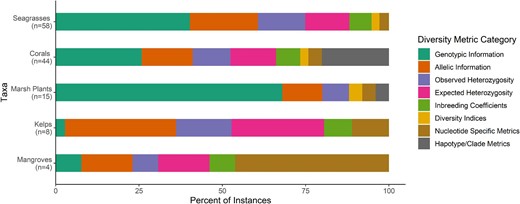
The diversity metric reported for each taxon as a relative percentage of instances (out of 100%) each diversity metric was used. For each taxon, the type of diversity metric used was tallied in each publication (n on the y-axis) and reported as the number of instances within the 129 total publications. The values are reported as the percentage of combined instances.
Genotypic information (e.g., genotypic richness, number of genotypes) accounted for 40% (of 211 reported instances) of the metrics reported for seagrasses (figure 3). Allelic information and observed and expected heterozygosity accounted for 20%, 14%, and 13%, respectively. For corals, the two most commonly reported categories were genotypic information (26% of 124 total instances) and haplotype or clade metrics (20%). Only corals and marsh plants had studies that employed haplotype metrics to measure diversity. Rather than using microsatellites to genotype individuals, the researchers amplified the ITS2 region or the chloroplast ribosomal large subunit 23S. The marsh plant publications most often used metrics included in the genotypic information category to measure diversity (68% of 25 total instances). For kelps, the allelic information and expected heterozygosity categories accounted for 33 and 28% of 36 total instances. Insufficient data (four publications) precluded summarizing the trends for mangroves.
There were 54 papers that only measured genetic diversity and an environment metric without a response variable. There were 75 publications that included both measures of genetic diversity and response variables and will be discussed further.
Diversity–function (prediction 1)
Forty publications contained a diversity metric and a response variable and therefore could be used to test prediction 1 (figure 4). Most of the publications that fit these criteria were focused on seagrasses (21 out of 40), followed by corals (8), marsh plants (6), mangroves (3), and kelps (2). Sixty-five percent of (or 26) the publications were observational or correlative studies; 33% (13) were manipulative. One publication had elements of both study types. Only 27.5% (11) of these publications included replication of diversity levels in their study design. Long-term studies of this type ranged in duration from 9 to 1825 days.
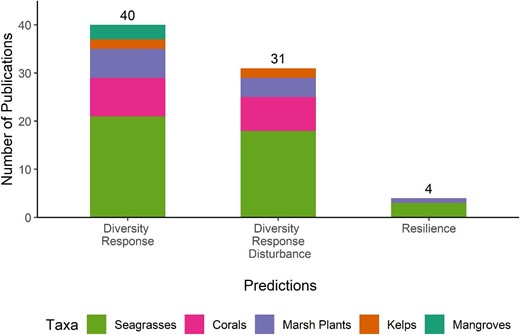
The number of publications for each taxon that can be used to test each of the three predictions: higher genetic diversity is related to greater function, areas with higher genetic diversity have greater function under a disturbance, and higher genetic diversity confers greater resilience to a disturbance.
Twenty-eight out of 40 publications (70%) also measured at least one environmental metric in addition to diversity metrics and response variables. There were no common trends in types of environmental metric reported across all taxa. Temperature was the most commonly reported metric in publications focused on seagrasses and corals (eight and five instances, respectively), followed closely by depth (five and four instances), and irradiance (four instances for both taxa). Because of the small number of publications that were focused on marsh plants, kelps, or mangroves, there were no such trends in environmental metrics studied.
When testing the relationship between genetic diversity and a response variable, most of the publications (75% of 40 total) measured more than one response variable (table 1a). This allows the researchers to account for the different growth strategies each taxa exhibits, as well as to measure higher-order benefits of diversity. Out of 40 publications, we tallied a total of 178 measured response variables. The most common metrics were in the abundance category (32%), followed by morphometric (28%) and physiology (19%).
For seagrasses, the abundance category (e.g., biomass, shoot density, percentage cover) accounted for 34% of 108 total instances (table 1a). Morphometric (21%), physiology (18%), and reproduction (16%) metrics were also commonly measured for seagrasses. Seagrasses were the only taxa that had an ecosystem response variable measured (3%). The morphometric and physiology categories accounted for 39% and 42% of 31 total instances in coral publications. For marsh plants, 44% of instances were abundance related (out of 25 total). It is also worth noting that the reproduction category accounted for 20% of the instances in marsh plants. No mangrove or coral publication included metrics of reproduction. For kelps, the morphometric category accounted for 80% of 10 total instances. In the small number (3) of mangrove publications in which function was measured, there were three instances of an abundance metric and one instance of a community metric. Across taxa, the researchers very rarely measured a community or an ecosystem-level metric in their study.
There was a large portion (44%) of response variables that were left untested or unreported in terms of their relationship to genetic diversity. Most of the response variables were reported to have a positive (21%) or neutral (25%) relationship with genetic diversity (see table 1a). Five percent of the metrics (all within the abundance, morphometric, or physiology categories) were found to have a negative relationship with genetic diversity. There were three reported metrics (one abundance and two reproduction) that were found to have both positive and negative relationships, depending on the genetic diversity metric specifically being tested. There were six instances in which the metrics had both a positive and a neutral relationship with diversity. This was due to differences in the specific diversity metrics tested (four instances) or differences in the relationship over the course of the experiment (two instances).
Diversity–stability (predictions 2 and 3)
There were 35 total publications that were able to test predictions 2 or 3 of the diversity–stability hypothesis (figure 4). These publications measured at least one diversity metric and response variable under a disturbance. Only four publications of the 35 included a BACI design to test whether high genetic diversity confers greater resilience to a disturbance (prediction 3). However, two of those studies did not report the data stating that there were no significant results for that experiment. A third study out of the four only measured function once after the disturbance had passed. In this case, only initial resistance, the ability to withstand a disturbance, can be measured accurately because of the lack of replicated measurements post disturbance. Since there was a small number of publications that used a BACI design and could test prediction 3, we are going to discuss all 35 publications that tested the diversity–stability hypothesis together.
Overall, for both prediction 2 and prediction 3, most were focused on seagrasses (21 out of 40), followed by corals (7), marsh plants (5), kelps (2), and mangroves (0). Seventeen publications (49%) were observational or correlative studies, 16 (46%) were manipulative, and 2 publications had elements of both study types. Eleven publications (31%) replicated diversity level treatments. Nineteen publications (54%) contained a control treatment or a site that did not experience the disturbance, and 15 studies (43%) reported baseline measurements of a response variable before the disturbance occurred. Often, the lack of control treatments or baseline data was due to an accidental or natural disturbance occurring in either the field or the laboratory. The studies under the diversity–stability hypothesis ranged in duration from 20 to 2190 days.
Although all of these studies included a disturbance of some kind, seven publications measured additional environmental metrics that were not characterized as a disturbance or stressor by the authors of the publication. However, because of the small number of studies, there were no common trends.
In total, for both predictions of the diversity–stability hypothesis, 21 publications included a manipulated disturbance, and 19 publications included an accidental or natural disturbance over the course of the study. Two studies included both natural and manipulative stressors. There were no coral or mangrove publications that included a manipulated disturbance (figure 5a). Four seagrass publications (two each on Zostera marina and Posidonia oceanica) manipulated temperature (three warming and one cooling). One kelp publication on Laminaria digitata also applied heat stress. The only publications that manipulated light levels (shading) were those that studied seagrasses, two on Cymodocea nodosa, and one each on Zostera marina and Posidonia australis. In addition to altered temperature and light levels, other manipulated disturbances included high nutrient loads, grazing, and tidal inundation.
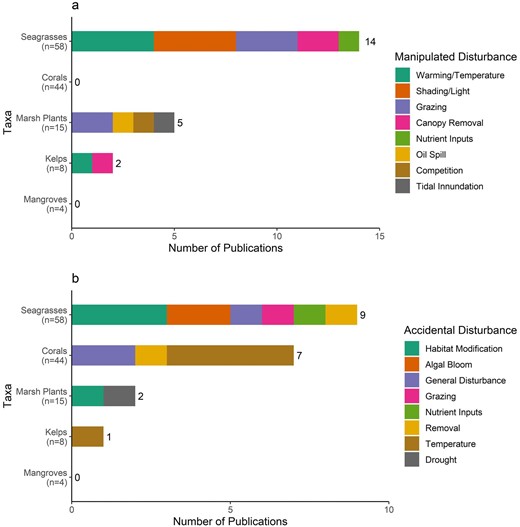
The number of publications in which a disturbance was manipulated (a) and the number of studies that included accidental or natural disturbances (b).
There were no trends in accidental disturbances, meaning those that are unplanned or naturally occurring in the field or laboratory, across taxa (figure 5b). An accidental algal bloom occurred in two Zostera marina publications, one that occurred accidentally in the laboratory and another that was naturally occurring in the field. Four publications (three seagrass and one marsh plant) studied the relationship between diversity and a response variable under relative levels of habitat modification. These studies included disturbances such as beach nourishment, coastal development, dredging, and fish farming. There were four coral publications in which an unplanned warming event occurred. Other accidental disturbances included removal by grazing, algal blooms, storms, and nutrient inputs.
Eighty-six percent of the publications in which diversity–stability was studied measured more than one response variable (tables 1b and 1c). Out of 35 total publications, we tallied a total of 127 response variables measured. Similarly to those publications falling under research prediction 1, the most common metrics were in the abundance category (35%) followed by morphometric (27%) and physiology (23%).
For seagrasses, the abundance category accounted for 36% of 85 total instances. Morphometric (26%) and physiology (18%) metrics were also commonly measured for seagrasses. Although it was only a small percentage, seagrasses were the only taxa that had ecosystem and community level response variables measured (1 and 10% respectively). Coral publications only included metrics that fit into the morphometric (45%), abundance (30%), and physiology (25%) categories. A high percentage of instances reported were abundance metrics (50% of 14 total) in marsh plants. They again had the highest percentage of reproduction metrics included in their studies (21%), but this amounted to only three instances in total. No coral, kelp, or mangrove publications included any reproduction metrics.
Similar to those publications falling under prediction 1, a large portion (46%) of metrics went untested or unreported in terms of their relationship to genetic diversity. Positive and neutral relationships accounted for 19% and 28% of the total. Five percent of the metrics were found to have a negative relationship with genetic diversity. Two metrics (within the abundance and community categories) were found to have both positive and neutral relationships with diversity. In one instance, the relationship was only positive after the period of disturbance, and in the other, only in certain disturbance treatments was the relationship positive. In another publication, primary consumer survival was found to have both positive and negative relationships with diversity.
Current state of knowledge and way forward
In our review of 129 publications, we found both observational and manipulative studies that provide support for the neutral to positive relationship between genetic diversity and a suite of response variables across five coastal foundation taxa. However, we also found several limitations to our understanding that will be discussed further along with recommendations for future studies.
We found that only a fraction of marine foundation species have been studied. Of the 72 species of seagrass that occur globally (Short et al. 2011), only 11 (15%) are represented in the data set. An even smaller fraction of all coral species was studied. There are over 800 species of corals (Carpenter et al. 2008), but only 82 (10%) were represented in the data set. There are fewer total species of kelps (30), but only 16% of those were represented. Life history strategies are different between taxa, and there may be differences in the relationship between diversity and function. For example, the rates and timing of asexual versus sexual reproduction are different between seagrasses and kelps. Kelps may have a higher standing stock of diversity, because they sexually propagate more often than seagrasses and may therefore have greater stability when faced with disturbances.
Even within taxa there were strong species biases in which most of the work was done. Within seagrasses, the work was focused on two genera (Posidonia and Zostera spp.). This could be problematic as species of seagrasses have different tolerances to disturbances and may respond differently. A handful of studies describe the genetic diversity of subtropical to tropical seagrasses such as Thalassia testudinum and Halodule wrightii (Bricker et al. 2011, Larkin et al. 2017), but those did not appear in our analyses because they do not relate genetic variation to any response variables. The rates of sexual versus asexual reproduction in seagrasses will vary because of differences in reproductive morphology, environmental conditions, and even geographic location (Ackerman 2006).
Although studies did occur globally, there are large regional gaps in studies where these foundation species occur. For example, seagrasses are known to occur along the eastern coasts of South America and Africa and along the eastern and northern coasts of Australia (Short et al. 2011). However, in the data set we found few to no studies on seagrasses within these regions. In addition, only 20% of coral studies occurred in the Indo-Pacific region, which was less than expected given their diversity and abundance in the region. Most of the marsh plant publications occurred in the Gulf of Mexico. There are also marsh plants occurring in Africa, South America, and southern Europe (Mcowen et al. 2017), where there are no relevant studies to date. There was an overall lack of kelp and mangrove publications within our data set. However, within the few kelp publications, none of them occurred in the United States, specifically on the western coast, where large kelp forests are known to be found. There may be differences in the relationship between diversity and function that occur between geographic regions because of differences in environmental conditions that are not accounted for in the current data set. We recommend conducting studies globally to ensure that a greater portion of species is studied for each taxon and to encompass species with different life histories.
A majority of the relevant studies (111 out of 129) measured some metric of the environment or manipulated a disturbance. However, because our search terms were focused on functional response variables and stability, there may be publications that measured genetic diversity and the environment that did not appear in our search. Environmental conditions, especially those that fluctuate rapidly in marine environments, can have strong effects on genetic diversity (Jump et al. 2009). Many environmental variables that were included in the data set were only measured in a few publications. Although water temperature and depth are two important factors in determining species distributions, other metrics such as salinity, oxygen, or nutrient levels, can fluctuate rapidly in the marine environment and can have an impact on diversity and the adaptation potential of organisms (Procaccini et al. 2007). Irradiance was also an understudied environmental metric. In many regions, light is a limiting factor for primary producers (Ralph et al. 2007, Bessell-Browne et al. 2017). It was a common stressor to manipulate in seagrass experiments, but no studies on kelps, marsh plants, or mangroves altered light levels as a stressor. All five coastal foundation species focused on in this review are detrimentally affected by changes in these variables (Kroeker et al. 2010, Noor et al. 2015), which can therefore change the relationship between genetic diversity and function.
The variety of genetic diversity metrics measured was lacking, because a large majority of publications reported genotypic information. The relative ease of manipulating the number of genotypes rather than allelic richness or heterozygosity, for example, drives the trend toward studying a metric within the genotypic information category. It also appears to be largely influenced by taxa; seagrass publications, which were the bulk of our data set, mainly used genotypic data. It is important to measure metrics beyond this category, because there are studies that reported mixed correlations between genetic diversity and the response variables due to the different diversity metrics used (e.g., Hughes and Stachowicz 2009, Evans et al. 2016, Abbott et al. 2017). In addition, measures of genotypic richness are not necessarily appropriate proxies for other measures of genetic diversity and also may not be related to phenotypic trait variation (Hughes et al. 2008). Metrics such as expected heterozygosity and allelic richness provide insight into the evolutionary potential of the population at hand and should be incorporated into more studies, particularly those that manipulate genetic diversity (Caballero and García-Dorado 2013). In addition, in manipulative studies, the number of genotypes used per plot ranged between one and nine genotypes. However, some observational studies reported more than 40 genotypes in a given area. The size of the relative study areas is different, because experimental plots are smaller than whole sites. However, future studies should manipulate the number of genotypes in each plot to mimic what is seen in the field.
What should also be noted is the variety of terms used for metrics of diversity between publications. For example, genotypic richness, genotypic diversity, clonal richness, and clonal diversity were all used to refer to richness as R, calculated as (G –1) ÷ (N – 1), where G represents the number of unique multilocus genotypes and N is the total sample size (Dorken and Eckert 2001). In addition, allelic richness was used in some studies to refer to the average number of alleles per locus and in others the number of alleles at each site throughout our search. It is important to create consistent use of these terms, as well as to adopt a standard protocol for the scoring of genotypes post sequencing for better comparison between publications.
Overall, the type of response variables measured across the data set were limited given the large range of focal taxa used in this review. Abundance (e.g., biomass, density) and morphometric measures (e.g., length, width) were commonly reported across all taxa. This is unsurprising, given the relative ease at which these metrics are collected. Physiological metrics, such as growth rates and chlorophyll content, were reported less often but are important in determining the overall health and function of an organism (Kamble et al. 2015). In addition, metrics of reproduction were lacking across taxa; there were no coral or mangrove publications that included such metrics. Although metrics of adult production are valuable, measures of seed viability, flowering rates, larval survival, and development give valuable information on the ability of those plants or animals to grow into the future. Similarly, community metrics, such as metrics of grazing or epiphyte biomass, were also understudied across taxa. Other flora and fauna species have an impact on the foundational taxa themselves and therefore must be measured to gain accurate assessments of the diversity–function and diversity–stability hypotheses. Ecosystem-level metrics were also understudied, accounting for less than 1% of all reported response variables. Ecosystem processes or services such as nutrient cycling and carbon budgets can identify whether the benefits to the foundation taxa scale to the ecosystem. These community and ecosystem metrics are useful for managers that need to justify conservation efforts to the public.
A large range of study durations was seen across the present study. Many were observational and included only a one-time sampling. The long-term studies ranged from 9 to 1825 days for the diversity–function studies and from 20 to 2190 for the diversity–stability studies. Long-term studies that include repeated sampling are important to understanding the relationship between genetic diversity and stability (Hughes et al. 2008). Short-term studies are valuable, but researchers risk potentially over- or underrepresenting diversity effects (Qiu and Cardinale 2020). Longer-term and multiyear studies allow researchers to understand the natural changes in diversity over time, give the possibility of controlling for more confounding variables than in a shorter-term study, and make the conclusion of the study more generalizable across region and taxa (Dee et al. 2023), which is why we recommend prioritizing longer-term studies and considering what study time frame is most appropriate to test the study questions at hand.
There were a few limitations to our understanding in terms of study design, including a lack of manipulative studies, replication, control treatments, and baselines. A large portion of the studies did not replicate levels of genetic diversity. Most of these studies were observational and compared sites of differing diversity. These studies are valuable and provide baseline genetic information for the study organism and insights into the potential benefits of genetic diversity without the logistics of a manipulative design (Gamfeldt et al. 2015). However, these studies can only assess correlations between genetic diversity and response variables and cannot specifically test the relationship between the two. In addition, not all confounding variables can be controlled for in observational studies, and one-time sampling can be affected by pulse disturbances that could alter the relationship between genetic diversity and measured response variables.
Replication within a study will further validate results and reduce the misinterpretation of data (Filazzola and Cahill 2021). Even in observational studies, efforts should be made to incorporate replication by comparing multiple sites with relatively low genetic diversity with sites with relatively high genetic diversity, for example. In general, incorporating more manipulative studies will also help to identify resilient genotypes that can be used to increase the overall function of the community (Pazzaglia et al. 2021).
There were publications that could not include a control because an unexpected disturbance occurred during the duration of their study. Although these are still important results and should be reported, manipulative studies that can compare control treatments with those that are disturbed should be conducted to build off the in situ results. The true effect of the disturbance cannot be determined without a control treatment that does not experience it. In addition, because of the unexpected nature of disturbances, studies may also not have included information on the diversity or response variable from before the time of the disturbance. This information is extremely important for determining what a natural or background level is for these metrics to accurately assess the impact of the disturbance (Kennedy and Cheong 2013). Future efforts should focus on increasing the number of manipulative studies, so that the number of studies that have replication, control treatments, and baselines should also increase.
We recommend using BACI designs more often in studies to quantify the resilience of coastal foundation taxa to specific disturbances. This is extremely important, especially in determining future plans for coastal restoration and management (Unsworth et al. 2015). We recognize that the lack of BACI designs used in studies is due to the inherent difficulty of this study type, especially when performing these experiments in the field. The authors of only a single study in our search both properly executed and reported their BACI experiment (Ehlers et al. 2008). There were two other studies that used a BACI (Hughes and Stachowicz 2011, Hughes et al. 2018), but after finding nonsignificant results, they did not report the data. Even when no relationship is found, the results should be reported, so that other researchers can build on existing studies (e.g., meta-analyses).
The outcomes reported were overwhelmingly neutral to positive across taxa. Some of these publications could determine what mechanism was behind the positive relationship found between genetic diversity and function. Out of 19 papers, 42% determined that the positive relationship was caused by the increase in trait diversity that is often associated with an increase in genetic diversity. In 16% of 19 publications, the mechanism could not be accurately determined because of the study design.
There were two publications that showed a negative relationship between genetic diversity and the response variable measured. In a study conducted on the coral Acropora palmata, genetic diversity was negatively correlated with live tissue cover (Williams et al. 2014). The authors suggested that this was purely the result of a colony that predominantly reproduces asexually. The role of the environment and population density shaped the results such that tissue loss due to predation and storm breakage would be lower in areas of high population density but other stressors such as disease might be higher.
Nine additional studies (seven under prediction 1 and two under prediction 2) showed both positive and negative relationships, depending on the response variable or diversity metric being tested. For example, one study showed that the observed heterozygosity of the seagrass Cymodocea nodosa was negatively correlated with leaf area but positively correlated with biomass (Máñez-Crespo et al. 2020). In another study on the seagrass Zostera marina, the abundance of flowering shoots increased with clonal richness but decreased with heterozygosity (Hays et al. 2021). Future studies should continue to measure multiple diversity and function metrics to tease apart differences between metrics.
Conclusions and implications for management
Studies linking genetic diversity to response variables in foundation species provide initial insight into the potential relationship between diversity and resilience. However, we only found four papers that used a BACI design to test resilience. A push toward manipulative studies with nonmodel organisms in a variety of environments to truly examine resilience would both move the field forward and aid in management and conservation. Future work should also heavily focus on community and ecosystem-level responses to determine whether the effects scale up to higher-order taxa.
Although we believe that there is enough evidence to support the use of genetic diversity in management practices, there are other potential avenues of research that help specifically with improving management. For example, further developing and using genomic techniques to assess populations will provide more information than identifying individuals through microsatellites and chromosomes. In addition to assessing overall population genetic variation, the use of genomics can also detect genes that are linked to aspects of fitness or other important traits (Garner et al. 2016). Identifying individuals with certain genes that promote fitness may improve conservation and restoration success.
Acknowledgments
We also would like to acknowledge the feedback provided by Pete Key, NOAA, the steering committee of the Gulf of Mexico Seagrass Monitoring Community of Practice, and our collaborators at PPBEP Matt Posner, Whitney Scheffel, and Logan McDonald. We also kindly thank Haley Beaulieu for her assistance with cross-referencing the literature cited in reviews with our compiled data set.
Funding
This forum is a result of research funded by NOAA (the National Oceanic and Atmospheric Administration) RESTORE Science Program under award no. NA21NOS4510172 to the University of New Orleans, Mississippi State University, and the Pensacola and Perdido Bays Estuary Program (PPBEP).
Author contributions
A. Konefal (Conceptualization, Data curation, Formal analysis, Funding acquisition, Investigation, Methodology, Supervision, Visualization, Writing – original draft, Writing – review & editing), A. Kirkland (Conceptualization, Data curation, Investigation, Methodology, Writing – review & editing), R. Gilpin (Data curation, Investigation, Writing – review & editing), K. Wyssmann (Data curation, Investigation, Writing – review & editing), N.M. Anthony (Conceptualization, Data curation, Funding acquisition, Investigation, Methodology, Supervision, Writing – review & editing), J. Cebrian (Conceptualization, Data curation, Funding acquisition, Methodology, Supervision, Writing – review & editing), and T.E. Cox (Conceptualization, Data curation, Funding acquisition, Investigation, Methodology, Project administration, Supervision, Writing – review & editing)
Author Biography
Anastasia Konefal ([email protected]), Amanda Kirkland, and Kathryn Wyssmann are graduate students; T. Erin Cox is an assistant professor; and Nicola Anthony is a full professor at the University of New Orleans, in New Orleans, Louisiana, in the United States. Rebecca Gilpin is a recent graduate of the Mississippi State University, in Starkville, Mississippi, in the United States. Just Cebrian is the director of ecology at Vesta Public Benefit Corporation, in San Francisco, California, in the United States and also affiliated with Northern Gulf Institute of the Mississippi State University in Stennis Space Center, Balch Boulevard, MS in the United States.
