


Abstract
In the era of targeted therapy, there has been increasing concern about the development of oncology drugs based on the “more is better” paradigm, developed decades ago for chemotherapy. Recently, the US Food and Drug Administration (FDA) initiated Project Optimus to reform the dose optimization and dose selection paradigm in oncology drug development. To accommodate this paradigm shifting, we propose a dose-ranging approach to optimizing dose (DROID) for oncology trials with targeted drugs. DROID leverages the well-established dose-ranging study framework, which has been routinely used to develop non-oncology drugs for decades, and bridges it with established oncology dose-finding designs to optimize the dose of oncology drugs. DROID consists of two seamlessly connected stages. In the first stage, patients are sequentially enrolled and adaptively assigned to investigational doses to establish the therapeutic dose range (TDR), defined as the range of doses with acceptable toxicity and efficacy profiles, and the recommended phase 2 dose set (RP2S). In the second stage, patients are randomized to the doses in RP2S to assess the dose–response relationship and identify the optimal dose. The simulation study shows that DROID substantially outperforms the conventional approach, providing a new paradigm to efficiently optimize the dose of targeted oncology drugs. DROID aligns with the approach of a randomized, parallel dose-response trial design recommended by the FDA in the Guidance on Optimizing the Dosage of Human Prescription Drugs and Biological Products for the Treatment of Oncologic Diseases.
1 Introduction
Conventional oncology dose-finding trials aim to identify the maximum tolerated dose (MTD), defined as the dose with the toxicity probability closest to a prespecified target toxicity rate (e.g., 25%), based on the assumption that both toxicity and efficacy increase with the dose. There has been increasing concern regarding the appropriateness of using this more-is-better paradigm in the era of targeted therapies and immunotherapies (Ratain, 2014; Ratain et al., 2021; Yan et al., 2018; Zang et al., 2014, Shah et al., 2014). Unlike cytotoxic agents, most novel targeted agents have a different mechanism of action and work by inhibiting molecular pathways that stimulate proliferation of cancer cells or inhibit their death. With targeted drugs, increasing doses beyond a certain level may not enhance antitumor activity. In addition, DLT effects may not be observed at clinically active doses. Therefore, for these agents, dosing at the MTD is often inappropriate, leading to off-target effects including toxicity, dose interruptions, and reduced compliance. The objective of early phase trials for targeted drugs should be to establish the optimal dose, defined as the dose that is safe and above which there is no evidence of incremental benefit.
As an example, the US Food and Drug Administration (FDA) recently approved sotorasib for treating metastatic non-small-cell lung cancers harboring the KRAS G12C mutation. It marks the first approved drug to target KRAS, which had been considered “undruggable” for decades. Despite the success, the development of sotorasib was hindered by a lack of robust dose optimization, which led the FDA to require Amgen to conduct a postmarketing trial to compare the approved 960-mg with a 240-mg dose. One cause of the FDA's requirement is that sotorasib was developed based on the conventional more-is-better paradigm. The Phase I dose escalation trial was conducted using the Bayesian logistic regression model (Neuenschwander et al., 2008), a variation of the continuous reassessment method (CRM; O'Quigley et al., 1990), with the goal of finding the MTD that yields a dose limiting toxicity (DLT) probability in the range of 0.20–0.30. As per the design, the highest dose of 960 mg was selected as the MTD, although 58 patients (45%) were classified as having serious complications and nine patients (7%) discontinued treatment because of toxicity. This MTD was subsequently used for the phase II registration trial. The FDA has required that Amgen complete the dose optimization study by October 2022 and submit a final study report by February 2023, also indicating in the multi-discipline review that this postmarketing study will inform possible future labeling updates.
The requirement of a postmarketing study for sotorasib signals the regulatory agency's increasing emphasis on optimizing the risk-benefit for patients and new scrutiny around determining the labeled dose for targeted agents. Recently, FDA Oncology Center of Excellence initiated Project Optimus “to reform the dose optimization and dose selection paradigm in oncology drug development” (FDA, 2022a, 2022b).
To accommodate this paradigm shift, we propose a dose-ranging approach to optimizing dose (DROID) for oncology clinical trials with targeted agents based jointly on three endpoints: a toxicity endpoint, an efficacy endpoint, and an efficacy surrogate endpoint such as a PD biomarker. A main innovation of DROID is that it bridges the dose-ranging study framework, routinely used in the development of non-oncology drugs for decades, with the established oncology dose-finding methodology to provide a robust and efficient method to optimize the dose for oncology. We extend existing oncology dose-finding methodology from targeting a single dose such as the MTD to targeting a dose range to achieve more efficient dose optimization; and modify the established dose-ranging framework to fit unique characteristics and challenges of oncology trials. DROID well aligns with the approach of a randomized, parallel dose–response trial design recommended by the FDA in the (draft) Guidance on Optimizing the Dosage of Human Prescription Drugs and Biological Products for the Treatment of Oncologic Diseases (FDA, 2022a).
Along a different line, a number of phase I–II designs have been proposed to find the optimal dose that maximizes a certain risk–benefit criterion, see, for example, Braun (2002), Thall and Cook (2004), Yin et al. (2006), Yuan and Yin (2009), Jin et al. (2014), Liu and Johnson (2016), Guo and Yuan (2017), among others. Yuan et al. (2016) provided a comprehensive coverage of phase I–II designs. Some recent efforts have been dedicated to developing model-assisted designs (Yuan, Lin, and Lee, 2022), which derive and optimize their decision rules based on models, but can be implemented in a similar way as algorithm-based designs (e.g., 3+3 design) by simply looking up the decision table (Yuan et al., 2019). Model-assisted phase I–II designs include utility-based Bayesian optimal interval design (U-BOIN) (Zhou, Lee, and Yuan, 2019), BOIN with efficacy and toxicity endpoints (BOIN-ET) (Takeda et al., 2018), and the BOIN12 design (Lin et al., 2020). All aforementioned designs were developed within the oncology dose-escalation framework, despite incorporating the risk–benefit consideration, with limited consideration of identification of TDR/RP2S, pharmacodynamics (PD) endpoint, randomization within RP2S, or assessment of the dose–response relationship.
The remainder of this paper is organized as follows. In Section 2, we propose DROID designs. In Section 3, we present simulation studies to show the operating characteristics of DROID compared with other designs. We conclude with a brief discussion in Section 4.
2 Methods
Consider a trial with J doses under investigation,  . Let
. Let  denote the binary toxicity endpoint (with
  indicating toxicity), and
  denote a binary efficacy endpoint such as tumor response (with
  indicating response). Let
  denote a surrogate endpoint for efficacy that is continuous or semicontinuous. For ease of exposition and without loss of generality, we assume that
  is a PD biomarker, measuring the biological antitumor activity of the drug. Let
  and
and  denote the toxicity and efficacy probabilities, respectively, and
  denote the mean PD measure of
  . We consider a common scenario that
  and
and  are quickly ascertainable (e.g., within the first cycle of treatment), whereas the evaluation of
  may take a substantially longer time (e.g., requiring multiple cycles). Because of this data availability difference, as described later,
  and
and  will play different roles in decision making.
2.1 Dose–Toxicity, Pharmacodynamics, and Efficacy Models
Assuming at an interim decision time,  patients have been treated at
  . We model the dose–toxicity curve using a logistic regression model,
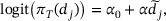
where α0 and α are model parameters, and  denote the effective dose as follows. Let
  be the prior estimate of the toxicity probability at the dose level j (i.e., skeleton), and
  denote the prior estimate of α (e.g., the mean of the prior distribution). The effective dose
  is determined by back-solving the dose–toxicity model
  . The use of
  , rather than the raw dosage
  , facilitates incorporating prior information of
  and improves the numerical stability of estimation. Following O'Qguigley and Chevret (1991) and Chevret (1993), we fix
  . Research shows that the resulting one-parameter logistic model yields more robust and better performance than the two-parameter logistic model that regards α0 as an unknown parameter (Chevret, 1993; Iasonos et al., 2016).
For the PD endpoint  , let
, let  denote the PD readout of the ith patient at
  , where
  and
and  . We employ a Bayesian Emax (also known as Hill) model
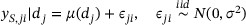
where η is the baseline activity without the drug; τ is the maximum activity that is possibly achieved (i.e., Emax) with the drug above the baseline activity, indicating where the dose–PD curve plateaus; β is the dose that produces half of the Emax (i.e., ED50); and γ is the Hill factor that controls the steepness of the dose–response curve. The Emax model is chosen because it accommodates the important feature that  may plateau after a certain
  and also provides a good fit to real world data based on a large scale empirical study (FDA, 2022a, 2022b). This modeling approach recently received the fit-for-purpose designation from the FDA (FDA, 2022a, 2022b). Other dose–response models (e.g., quadratic model or a parsimonious model without the parameter of the Hill factor) can be entertained when appropriate.
For efficacy endpoint  , let
, let  denote the number of patients achieved response/efficacy at
  . We assume that
  follows a beta-binomial model

where a and b are hyperparameters, which are typically set as small values (e.g.,  ) to obtain a vague prior. The posterior arises as
  .
.
We choose to model the marginal distributions of  ,
,  , and
, and  , rather than their joint distribution, because the decisions of the DROID design only involve the marginal distributions and also it is difficult to reliably estimate the correlation parameters with small-sample sizes (Cunanan & Koopmeiners, 2014). This approach simplifies the model estimation with little impact on the operating characteristic of the design as shown by the simulation study later. We model
  at each dose independently rather than the dose–efficacy curve because in the DROID design
  is mainly used as a gatekeeper at some key decision-making points to ensure that the doses selected have acceptable clinical efficacy, as described below. For that purpose, a simple beta-binomial model is sufficient with advantages of being robust and easy to evaluate. More details of the models, including likelihood, prior, and posterior distributions, are provided in the Supporting information.
2.2 Trial Design
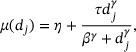
Figure 1 illustrates the DROID design, which consists of two seamlessly connected stages. In Stage I, patients are sequentially enrolled and adaptively assigned to investigational doses to find the therapeutic dose range (TDR), which is defined as

where  denotes the highest acceptable toxicity rate, and
  denotes the lowest acceptable PD threshold. At the end of Stage I, based on the TDR, the recommended phase 2 dose set (RP2S) is identified, as a subset of TDR, based on
  and the totality of the data. In Stage II, patients are randomized to the RP2S to assess the dose–response relationship and identify the optimal dose.
Flowchart of the DROID design. DROID, dose-ranging approach to optimizing dose.
One novelty of the DROID design is that it finds the TDR, rather than a single dose such as the MTD, making it different from the majority of oncology dose finding designs. Such extension suits the goal of dose optimization. To identify the optimal dose, it is necessary to evaluate and compare multiple doses. TDR allows investigators to randomize patients (at Stage II) only to the doses that have the potential to be the optimal dose, thereby saving the sample size and improving the efficiency.
Another feature of the DROID design is that it uses  and
and  differently according to their characteristics.
  is quickly ascertainable and thus used to guide adaptive decisions that require frequent and timely update, for example, patient allocation and dose transition in Stage I. In contrast,
  takes a long time to be observed and is not suitable for that purpose. Compared to
  ,
,  is more relevant clinically and represents the clinical efficacy of interest that the surrogate endpoint
  may not be able to fully reflect. Thus, we use
  as a gatekeeper at some key decision-making points (e.g., when selecting RP2S for Stage II randomization and when selecting the optimal dose at the end of the trial) to ensure that the doses selected have acceptable clinical efficacy. Figure 1 shows the role of
  ,
,  , and
, and  in each step of the design.
2.3 Stage I of Finding the TDR
The objective of stage I is to find TDR and RP2S. Under the generally valid assumption that dose–toxicity and dose–PD curves are non-decreasing (including plateau), identification of the TDR boils down to pinpointing the minimal active dose (MAD), defined as the lowest dose with  (the lower bound of the TDR), and the MTD, defined as the highest dose with
  (the upper bound of the TDR). In other words, the TDR is the range of doses between the MAD and MTD. Here, the MAD is analogous to the minimal effective dose that is routinely used in non-oncology dose-finding studies (Zhou et al., 2017).
We find TDR by employing two parallel dose exploration processes: the MAD-finding process and MTD-finding process. In what follows, we first describe the decision rules of the two processes, followed by the TDR-finding algorithm.
(i) MAD-finding decision rule:
Let  denote the current dose level for the MAD-finding process, and
  denote the dose level whose posterior estimate of
  is closest to
  , that is,
- •
If
 , the candidate dose for the next cohort is
  .
. - •
If
 , the candidate dose for the next cohort is
  .
. - •
If
 , the candidate dose for the next cohort is
  .
.
(ii) MTD-finding decision rule:
Let  denote the current dose for the MTD-finding process, and
  denote the dose level whose posterior estimate of
  is closest to
  , that is,
  .
.
- •
If
 , the candidate dose for the next cohort is
  .
. - •
If
 , the candidate dose for the next cohort is
  .
. - •
If
 , the candidate dose for the next cohort is
  .
.
In (i) and (ii), we do not allow dose skipping. For (i), de-escalating the dose when  is desirable for reliable identification of TDR/RP2S, which will be later used to identify the optimal dose, for the simple reason that we have to concentrate data on the part of the dose–response curve of interest to obtain reasonable power. This efficient use and allocation of data is particularly important here because of the small-sample size of Stage I.
With the above decision rules at hand, the TDR-finding algorithm is described as follows:
- (1)
Treat the first cohort of patients at the lowest dose with
 .
. - (2)
Given the observed data, apply MAD-finding and MTD-finding decision rules to determine the candidate dose levels
 and
and  for the next cohort:
- •
If
 , treat the next cohort of patients at
  .
. - •
Otherwise, recruit two cohorts of patients and equally randomize them to
 and
and  , such that each dose receives one cohort.
- •
- (3)
Repeat Step 2 until reaching a prespecified maximum sample size N1 for Stage I, or early stop the trial if
 (toxicity stopping when the lowest dose is overly toxic) or
  (PD stopping when the highest dose is futile), where
  and
and  are probability cutoffs.
As demonstrated in Step 2, one feature of DROID is that the two dose-finding processes merge or split adaptively according to the observed data, making it different from existing dose-finding designs. If MTD is coincident with MAD, the two processes automatically merge as one, improving the efficiency of the design. For example, when the low doses are safe but subtherapeutic, the two processes will merge as one, leading to fast dose escalation over the low doses and allocating more patients to effective doses. On the other hand, when MTD differs from and is higher than MAD, the design splits the two processes and assigns patients concurrently to each of them. This is sensible because the correct identification of TDR hinges on the correct identification of both MAD and MTD. Concentrating patients around these two target doses renders the design more capable of learning and identifying TDR with greater reliability and efficiency. This is analogous to backfilling patient during the dose escalation, an empirical approach commonly used in practice, but the proposed approach is more principled and rigorous with explicit statistical decision criteria and objectives. The proposed TDR-finding design is a dual-target finding design, whereas most existing designs are single-target finding designs.
When Stage I is complete, we identify MTD as the highest dose whose  , and MAD as the lowest dose whose
  . The TDR are the doses between MAD and MTD, that is, TDR =
  . An alternative approach is to select TDR from the continuous dose range
  as TDR =
  , where
  and
and  denote the inverses of dose–PD and dose–toxicity functions (1) and (2). If dose extrapolation is allowed beyond the investigational dose range, TDR is given by
  . Dose extrapolation below d1 might be acceptable, but extrapolation to doses higher than
  is often problematic due to safety concerns. If TDR is empty, the trial is terminated with all doses considered unacceptable.
TDR forms the basis of determining the RP2S—the doses to be moved forward to Stage II for randomization. We define RP2S as the subset of TDR that satisfies the efficacy requirement  , where
  is the posterior mean estimate of
  . Alternatively, the posterior-probability-based efficacy requirement, for example,
  , can also be used. To satisfy the ordering constraint that the dose–efficacy curve is non-decreasing (i.e.,
  for any dose level j), we apply isotonic transformation (Dunson & Neelon, 2003) to posterior samples of
  when estimating
  or calculating
  . When non-decreasing assumption is not sound for the trial, we can simply skip the isotonic transformation.
The efficacy requirement is used to gatekeep the case that a dose showing sufficient PD effect may not always demonstrate sufficient clinical efficacy. As described previously, we do not directly use  to guide dose escalation/de-escalation because it often takes a long time to be ascertained. In addition to
  , dose tolerability, measured by dose interruption and reduction over multiple cycles, can also be used to guide the choice of RP2S. Dose tolerability by definition typically requires a long time to be observed, thus is more suitable as a gatekeeping endpoint, rather than guiding dose escalation/de-escalation. We assume that there is a follow-up period (e.g., 2–3 months) after Stage I enrollment so that
  and dose tolerability are observed for all or most Stage I patients. To reduce the sample size and cost, in practice, it is often desirable to impose a constraint that the number of doses in RP2S cannot be more than K (e.g., 2 or 3) by choosing the K doses with the highest
  within TDR as RP2S.
2.4 Stage II of Randomization
At Stage II, we randomize more patients to the doses within RP2S to assess the dose–response relationship. Depending on the trial objectives and characteristics, different randomization schemes can be used. The most straightforward approach is to fix the sample size of Stage II and equally randomize patients to the doses in the identified RP2S. As the number of patients treated in Stage I is often different across doses, equal randomization results in different total numbers of patients across the doses in RP2S. Thus, an alternative randomization scheme is to choose a randomization ratio, based on the number of patients at Stage I, such that at the end of Stage II, an equal total number of patients will be treated at each RP2S dose. A more sophisticated randomization scheme is the outcome-dependent adaptive randomization. For example, we randomize patients to the doses within the RP2S with probabilities proportional to their desirability. The desirability can be defined as  or the risk-benefit tradeoff using utility (Liu et al., 2018; Zhou et al., 2019).
Regardless of the randomization scheme employed, throughout Stage II, we apply the following toxicity and futility monitoring rules to drop toxic or ineffective doses as follows:
- •
(Safety rule) Drop
 and higher doses for toxicity if
  , where
  is a probability cutoff that is calibrated using simulation.
 - •
(Futility rule) Drop
 and lower doses for futility if
  , where
  is a probability cutoff that is calibrated using simulation.
The safety and futility monitoring can be conducted in a continuous or group-sequential fashion, depending on the trial setting. The frequency and timing of safety and futility monitoring can be different. For the futility rule, we use  instead of
  because
  takes a long time to evaluate. In addition, in early-phase trials, the goal of the futility rule is to rule out very ineffective doses. For targeted agents, if the biological activity
  is low, it is unlikely that the drug is effective clinically. Thus,
  often serves well to rule out ineffective doses. Nevertheless,
  could be used to define the futility rule when appropriate, for example,
  does not take a long time to evaluate or/and the number of futility monitoring is small. During Stage II, when desirable, at each interim, TDR/RP2S could be updated based on accumulating data, and new doses that become qualified as TDR/RP2S doses in light of new data may be added to Stage II for randomization. As shown later in the simulation study, this may improve the performance in some scenarios, but is more involved logistically and operationally in practice.
Stage II randomization is an analog of dose-ranging studies that are routinely used, and often required by the FDA in the development of non-oncology drugs. In dose ranging studies, patients are randomized to several dose groups, often with a placebo included as a control. The objective of the dose ranging study is to achieve (i) proof of concept (PoC) by establishing the statistical significance of the dose–response relationship, and (ii) identify the minimal effective dose, defined as the lowest dose that achieves a prespecified clinical relevance (in terms of the point estimate) and also statistical significance compared to the control. A variety of designs, for example, multiple comparison procedures with modeling techniques (MCP-Mod), are developed to achieve these two objectives, see Dragalin et al. (2010) for a review on the dose-ranging methods.
Dose-ranging studies, however, are rarely used in oncology for various reasons. First, objective (i) of dose-ranging studies is evaluated based on the classic hypothesis testing framework with multiplicity adjustment to control familywise type I error (e.g., MCP-Mod). This approach demands a large-sample size (e.g., hundreds of patients), which often is not feasible in early phase oncology trials due to the difficulty of accrual and tight development timeline. Second, objective (ii) of dose ranging studies often includes a placebo group, which is often not feasible in oncology either. Third, as the demonstration of efficacy tends to be the biggest hurdle associated with oncology drug approval, sponsors often lean toward selecting the dose with the highest efficacy, rather than the minimal dose that reaches the clinical relevance. Despite the differences and challenges, the general principle and approach of dose-ranging studies are valuable to improve the development of targeted oncology drugs, as described next.
2.5 Assessment of Dose–Response Relationship and Identification of the Optimal Dose
To leverage decades of experience and success of non-oncology dose-ranging studies, we propose a new oncology dose-ranging approach with two objectives that parallel those of dose-ranging studies, while accounting for the unique characteristics and challenges of oncology trials. The estimation and decisions are based on the overall data from Stages I and II.
The first objective is to establish PoC. Rather than using hypothesis testing and the p-value, we propose the Bayesian dose–response index (DRI) as a new metric to assess the strength of evidence on the dose–response relationship. We define DRI as:

where  is the highest tried dose, and δ is the equivalence margin (i.e., PD is regarded as plateau at a dose if its PD level is greater than δ times that of the highest tried dose). If
  , we claim the dose–response relationship established, where
  is a probability cutoff that can be tuned through simulation.
Based on the FDA's guidance for bioequivalence studies (FDA, 2022a), the recommended equivalence range is between 0.8 and 1.25. Since we compare the PD of a dose to the highest tried dose and assume the PD increases or plateaus with dose, we recommend a default value between 0.8 and 0.9 for δ. DRI represents the probability of the existence of a dose–response relationship given the observed data, providing a direct measure on the evidence of the dose–response relationship. For example, DRI = 0.8 means that there is an 80% chance that a dose–response relationship exits, or the odds of existence versus absence of a dose–response relationship is 4:1. This intuitive interpretation facilitates the sponsor and regulatory agent to evaluate and determine whether a specific value of DRI is sufficient to establish PoC based on the characteristics of the drug and targeted patient population, rather than universally applying the 0.05 cutoff for the p-value and ignoring the different characteristics of each drug development. This is particularly appealing to oncology trials, where the sample size is limited and thus unlikely to allow the p-value to reach 0.05. Another advantage of DRI is that it is straightforward for it to account for the uncertainty of the dose–response model using Bayesian model averaging to improve the robustness of the inference along a similar line as MCP-Mod when appropriate (see the Supporting information). The DRI in Equation (4) assumes a non-decreasing dose–PD relationship, which is plausible in most cases. If an umbrella-shaped relationship is perceived, we can replace  with the dose with the highest estimate of
  .
.
The second objective is to select the optimal dose. This differs from that of non-oncology dose ranging trials, which aims to identify the minimal effect dose. This modification is necessary as the demonstration of efficacy tends to be the biggest hurdle for the oncology drug approval. Let  denote the doses in RP2S that are not dropped due to toxicity or futility at the end of Stage II. Given that PoC has been established, we select the optimal dose
  as the lowest dose that reaches the PD plateau and clinical relevance.
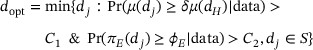
where C1 and C2 are probability cutoffs. Since we restrict the optimal dose selection in the admissible dose set S, the decision rule has taken the toxicity data into account. Other statistical criteria can also be used to define  , for example, based on the point estimates.

In the case that PoC cannot be established (i.e., the dose–response relationship is fairly flat), additional higher or lower doses outside  may be further studied, or the optimal dose may be selected based on the totality of data and clinical considerations. In our simulation, to simplify reporting results, when PoC cannot be established, we do not select the optimal dose. The definition of
  is not unique, and other definitions may also be considered when appropriate, for example, the dose that maximizes a certain benefit–risk criterion such as utility (Guo and Yuan, 2017; Lin et al., 2020).
The optimal dose selection criteria (5) and (6) assume that when PD plateaus, the efficacy also plateaus, which is often reasonable for targeted drugs. Although the plateau identification is largely based on  ,
,  does play a role in determining
  and ensuring that
  is clinically effective. A more straightforward approach of selecting
  directly based on the ORR (objective response rate) as the dose where
  plateaus, unfortunately, does not work well. This is because a binary endpoint provides very limited power to identify the plateau point (see Table S1 for simulation results). To see this, consider two doses with ORR =0.2 and 0.3, respectively. Given 15 patients per dose, the power to detect whether the ORR of these two doses is statistically different is only 18% using frequentist proportion test at the significance level of 5%.
2.6 Model-assisted Dose-ranging Approach to Optimizing Dose Design to Simplify Implementation
From the implementation viewpoint, the most intensive and challenging part of the DROID design is Stage I dose assignment, which requires repeatedly fitting dose–toxicity and dose–PD models in real time after each cohort to determine the dose assignment for the next cohort, analogous to the CRM. Model-assisted designs (Yuan et al., 2022) provide a useful approach to simplifying the implementation of dose-finding designs, while preserving desirable operating characteristics. Specifically, the MTD-finding and the MAD-finding processes can be carried out using BOIN (Liu & Yuan, 2014) and gBOIN methods (Mu et al., 2019), which do not require any model fitting and only involve a simple comparison of the sample means of  and
and  with fixed dose escalation and de-escalation boundaries. The details are provided in the Supporting information. We let DROID-CRM denote the DROID design that determines Stage I dose assignment based on toxicity and PD models (1) and (2), and DROID–BOIN denote the DROID design that uses BOIN/gBOIN to guide the dose assignment. We evaluate the performance of these two designs in the next section. To further facilitate the application of DROID, we provide software and an example to illustrate the step-by-step implementation of DROID in the Supporting information.
3 Simulation Study
We evaluated the operating characteristics of the DROID design using simulation studies. We considered five doses (0.1, 0.3, 0.5, 0.7, 0.9) and assumed the prior estimate of toxicity probabilities (0.05, 0.15, 0.3, 0.4, 0.55) to obtain the effective doses  . The Stage I sample size was 12 cohorts of size 3. In Stage II, the maximum sample size for each dose is M = 20. The toxicity upper bound
  , the PD lower bound
  , and the ORR lower bound
  . For
. For  , and τ, the clinician-elicited prior estimates were 0.1, 0.5, and 0.4, respectively with elicited ranges (0, 0.3), (0, 1), and (0.1, 0.7). This resulted in priors
  ,
,  , and
, and  based on the prior specification procedure described in the Supporting information. For the Hill factor γ, the elicited prior estimate was 2, so we set
  such that the prior standard deviation was three times the prior mean. The equivalence margin was taken as
  . Calibrated by simulation, we took the probability cutoffs
  ,
,  , and
, and  .
.
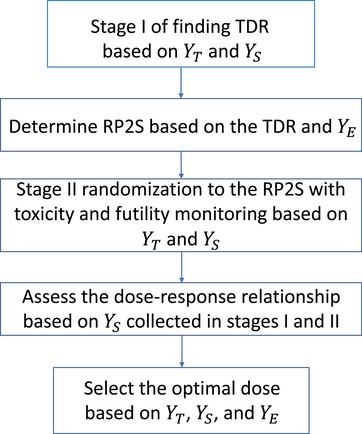
We considered nine scenarios that varied in the location of the optimal dose and the patterns of toxicity, PD, and ORR (see Table 1). Figure 2 shows the true dose–response curves for toxicity, PD, and ORR for these scenarios. This figure appears in color in the electronic version of this paper, and any mention of color refers to that version. Under each scenario, we simulated 1,000 trials. To simulate toxicity, PD, and OR data for patient i, we first generated the PD data  from the Emax model. Then, we generated toxicity and OR conditional on
  by
by  and
and  , where
  ,
,  , is a patient-specific random effect used to induce positive correlation between
  and
and  . We compared the DROID design with the EffTox design (Thall & Cook, 2006), which aims to find the optimal dose based on efficacy-toxicity tradeoff, and CRM. We included CRM mainly to demonstrate the difference between finding the MTD and optimal dose, while noting that such comparison may not be fair given that the two designs have different objectives. For the two designs under comparison, we used a cohort size of 3 and the sample size 66 to match the average sample size of DROID across the 9 scenarios. More details of EffTox and CRM are provided in the Supporting information.
True toxicity, PD, and ORR at each dose for the nine scenarios.
| Dose level | 1 | 2 | 3 | 4 | 5 | 1 | 2 | 3 | 4 | 5 |
|---|---|---|---|---|---|---|---|---|---|---|
| Scenario 1 | Scenario 2 | |||||||||
| Toxicity | 0.05 | 0.10 | 0.15 | 0.18 | 0.45 | 0.05 | 0.08 | 0.10 | 0.13 | 0.22 |
| ORR | 0.40 | 0.50 | 0.52 | 0.53 | 0.53 | 0.35 | 0.40 | 0.50 | 0.52 | 0.52 |
| PD | 0.40 | 0.57 | 0.58 | 0.60 | 0.60 | 0.00 | 0.37 | 0.45 | 0.48 | 0.49 |
| Scenario 3 | Scenario 4 | |||||||||
| Toxicity | 0.05 | 0.08 | 0.10 | 0.13 | 0.15 | 0.02 | 0.04 | 0.06 | 0.08 | 0.10 |
| ORR | 0.35 | 0.45 | 0.58 | 0.59 | 0.60 | 0.15 | 0.30 | 0.35 | 0.45 | 0.48 |
| PD | 0.20 | 0.31 | 0.42 | 0.42 | 0.43 | 0.00 | 0.08 | 0.20 | 0.34 | 0.35 |
| Scenario 5 | Scenario 6 | |||||||||
| Toxicity | 0.05 | 0.08 | 0.10 | 0.12 | 0.20 | 0.05 | 0.12 | 0.45 | 0.60 | 0.75 |
| ORR | 0.15 | 0.35 | 0.45 | 0.55 | 0.56 | 0.45 | 0.55 | 0.62 | 0.62 | 0.63 |
| PD | 0.03 | 0.15 | 0.28 | 0.37 | 0.38 | 0.18 | 0.33 | 0.43 | 0.55 | 0.70 |
| Scenario 7 | Scenario 8 | |||||||||
| Toxicity | 0.02 | 0.04 | 0.06 | 0.08 | 0.12 | 0.10 | 0.40 | 0.50 | 0.70 | 0.85 |
| ORR | 0.10 | 0.20 | 0.30 | 0.40 | 0.50 | 0.45 | 0.60 | 0.62 | 0.62 | 0.62 |
| PD | 0.00 | 0.04 | 0.14 | 0.25 | 0.40 | 0.32 | 0.64 | 0.78 | 0.79 | 0.80 |
| Scenario 9 | ||||||||||
| Toxicity | 0.02 | 0.07 | 0.12 | 0.18 | 0.50 | |||||
| ORR | 0.45 | 0.45 | 0.45 | 0.45 | 0.45 | |||||
| PD | 0.20 | 0.20 | 0.21 | 0.21 | 0.21 | |||||
Notes: The boldface numbers are the optimal doses.
PD, pharmacodynamics.
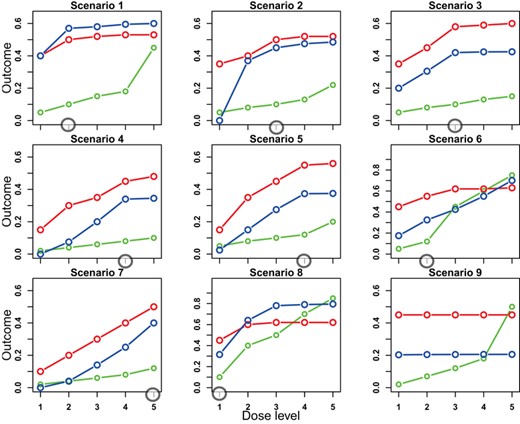
Dose–response curves for the nine scenarios in the simulation study. The green, blue, and red lines are the toxicity, PD, and ORR curves, respectively. The circled doses are the optimal doses. This figure appears in color in the electronic version of this paper, and any mention of color refers to that version. PD, pharmacodynamics.
Table 2 summarizes the operating characteristics of the DROID designs, EffTox and CRM designs. In Scenario 1, the first four dose levels are safe and PD plateaus from dose level 2, so the optimal dose is dose level 2 with ORR = 0.5. The percentage of correct selection (PCS) of the optimal dose under DROID-CRM and DROID–BOIN are over 75%, that of CRM and EffTox is 1% and 32%, respectively. In Scenarios 2 and 3, the optimal dose is dose level 3 as it is safe and PD plateaus from dose level 3. Like in Scenario 1, the PCS of DROID designs is over 75%, substantially higher than those of CRM and EffTox designs. For Scenarios 4 and 5, the optimal dose is dose level 4. Like for Scenarios 2 and 3, the DROID designs yielded higher PCS than CRM and EffTox. In Scenario 6, PD keeps increasing with dose. Since dose level 3 is overly toxic, dose level 2 is the optimal dose. In Scenario 7, PD increases with dose, so the optimal dose is dose level 5. In Scenario 8, dose level 1 is the optimal dose as it is the only acceptable dose in terms of toxicity. In these three scenarios, DROID designs yielded better PCS than EffTox and worse PCS than CRM. In Scenario 9, the PD curve is almost flat. The DROID designs claimed no PoC about 99% of the time, while CRM and EffTox recommended a dose for each simulated trial by design.
Selection percentage and the average number of patients treated at each dose under DROID designs using BOIN or CRM in Stage I, EffTox and CRM designs.
| Dose level | 1 | 2 | 3 | 4 | 5 | 1 | 2 | 3 | 4 | 5 |
|---|---|---|---|---|---|---|---|---|---|---|
| Scenario 1 | Scenario 2 | |||||||||
| DROID-BOIN Sel % | 0.009 | 0.781 | 0.179 | 0.009 | 0.000 | 0.000 | 0.147 | 0.820 | 0.016 | 0.000 |
| No. patients | 20.0 | 18.4 | 17.7 | 11.8 | 3.4 | 6.7 | 19.8 | 19.1 | 17.0 | 8.8 |
| DROID-CRM Sel % | 0.008 | 0.766 | 0.201 | 0.011 | 0.000 | 0.000 | 0.212 | 0.754 | 0.016 | 0.002 |
| No. patients | 20.0 | 18.5 | 17.4 | 12.0 | 2.9 | 16.5 | 18.5 | 18.3 | 14.8 | 6.8 |
| EffTox Sel % | 0.360 | 0.320 | 0.210 | 0.090 | 0.020 | 0.290 | 0.150 | 0.210 | 0.160 | 0.190 |
| No. patients | 25.6 | 18.8 | 13.1 | 6.0 | 2.5 | 21.8 | 11.1 | 13.0 | 9.0 | 11.1 |
| CRM Sel % | 0.004 | 0.010 | 0.071 | 0.897 | 0.018 | 0.000 | 0.002 | 0.013 | 0.177 | 0.808 |
| No. patients | 3.8 | 5.2 | 7.7 | 28.3 | 21.0 | 3.7 | 4.3 | 4.8 | 9.0 | 44.2 |
| Scenario 3 | Scenario 4 | |||||||||
| DROID-BOIN Sel % | 0.002 | 0.068 | 0.765 | 0.152 | 0.000 | 0.000 | 0.000 | 0.018 | 0.738 | 0.232 |
| No. patients | 19.7 | 18.0 | 18.8 | 16.3 | 9.6 | 4.1 | 11.6 | 18.3 | 19.2 | 17.3 |
| DROID-CRM Sel % | 0.005 | 0.075 | 0.755 | 0.144 | 0.000 | 0.000 | 0.000 | 0.010 | 0.738 | 0.244 |
| No. patients | 19.8 | 18.0 | 18.4 | 15.2 | 7.9 | 5.3 | 12.7 | 17.5 | 19.0 | 16.9 |
| EffTox Sel % | 0.240 | 0.150 | 0.210 | 0.150 | 0.250 | 0.010 | 0.060 | 0.140 | 0.160 | 0.620 |
| No. patients | 19.0 | 11.5 | 13.2 | 8.1 | 14.1 | 6.5 | 6.8 | 10.7 | 10.4 | 31.1 |
| CRM Sel % | 0.000 | 0.002 | 0.016 | 0.084 | 0.898 | 0.000 | 0.000 | 0.000 | 0.009 | 0.991 |
| No. patients | 3.7 | 4.3 | 4.9 | 7.9 | 45.2 | 3.2 | 3.5 | 3.4 | 4.3 | 51.5 |
| Scenario 5 | Scenario 6 | |||||||||
| DROID-BOIN Sel % | 0.000 | 0.015 | 0.164 | 0.771 | 0.024 | 0.026 | 0.902 | 0.049 | 0.000 | 0.000 |
| No. patients | 7.4 | 17.8 | 18.3 | 17.4 | 9.6 | 20.1 | 19.5 | 8.7 | 1.3 | 0.0 |
| DROID-CRM Sel % | 0.000 | 0.023 | 0.176 | 0.740 | 0.031 | 0.016 | 0.885 | 0.072 | 0.001 | 0.000 |
| No. patients | 6.6 | 17.5 | 17.9 | 16.6 | 8.6 | 20.1 | 19.5 | 10.2 | 2.1 | 0.1 |
| EffTox Sel % | 0.010 | 0.130 | 0.150 | 0.250 | 0.440 | 0.380 | 0.590 | 0.020 | 0.000 | 0.000 |
| No. patients | 7.0 | 10.0 | 11.3 | 13.9 | 23.7 | 27.4 | 32.1 | 5.7 | 0.5 | 0.1 |
| CRM Sel % | 0.000 | 0.002 | 0.012 | 0.130 | 0.856 | 0.000 | 0.985 | 0.015 | 0.000 | 0.000 |
| No. patients | 3.7 | 4.3 | 4.7 | 8.0 | 45.4 | 3.9 | 25.5 | 33.8 | 2.5 | 0.2 |
| Scenario 7 | Scenario 8 | |||||||||
| DROID-BOIN Sel % | 0.000 | 0.000 | 0.011 | 0.153 | 0.812 | 0.804 | 0.170 | 0.001 | 0.000 | 0.000 |
| No. patients | 3.7 | 7.8 | 15.7 | 18.2 | 17.5 | 24.1 | 12.3 | 2.5 | 0.3 | 0.0 |
| DROID-CRM Sel % | 0.000 | 0.000 | 0.005 | 0.181 | 0.797 | 0.726 | 0.250 | 0.000 | 0.000 | 0.000 |
| No. patients | 5.2 | 7.3 | 15.4 | 18.0 | 16.8 | 21.8 | 15.2 | 3.1 | 0.3 | 0.0 |
| EffTox Sel % | 0.010 | 0.010 | 0.110 | 0.150 | 0.710 | 0.760 | 0.160 | 0.000 | 0.000 | 0.000 |
| No. patients | 5.2 | 4.5 | 9.1 | 10.1 | 36.0 | 43.8 | 15.8 | 2.1 | 0.4 | 0.1 |
| CRM Sel % | 0.000 | 0.000 | 0.000 | 0.009 | 0.991 | 0.919 | 0.080 | 0.001 | 0.000 | 0.000 |
| No. patients | 3.2 | 3.5 | 3.5 | 4.4 | 51.5 | 18.4 | 43.3 | 3.9 | 0.4 | 0.0 |
| Scenario 9 | ||||||||||
| DROID-BOIN Sel % | 0.001 | 0.004 | 0.001 | 0.000 | 0.000 | |||||
| No. patients | 19.8 | 18.3 | 18.8 | 15.2 | 3.8 | |||||
| DROID-CRM Sel % | 0.002 | 0.004 | 0.002 | 0.001 | 0.000 | |||||
| No. patients | 19.8 | 18.1 | 19.0 | 15.9 | 4.7 | |||||
| EffTox Sel % | 0.500 | 0.230 | 0.200 | 0.060 | 0.010 | |||||
| No. patients | 32.5 | 14.5 | 12.6 | 4.7 | 1.5 | |||||
| CRM Sel % | 0.010 | 0.001 | 0.031 | 0.944 | 0.014 | |||||
| No. patients | 3.3 | 3.9 | 5.3 | 33.0 | 20.5 | |||||
Notes: The boldface numbers are optimal doses.
BOIN, Bayesian optimal interval design; CRM, continuous reassessment method; DROID, dose-ranging approach to optimizing dose.
We further investigated operating characteristics of the DROID designs when (i) the doses that are not included in TDR/RP2S at the end of Stage I can be added during Stage II randomization in light of accumulative data; (ii) the alternative point-estimate-based criterion (6) is used to select the optimal dose at the end of the trial; and (iii) the PD is generated from a misspecified model. Table 3 shows the results for (i). Although in some scenarios (e.g., Scenarios 5 and 7), there are sizeable performance improvements because of the use of this additional adaptation rule, the performance is comparable in most scenarios. Therefore, if adding new doses during randomization is operationally challenging, the adaptation rule (i) may not be needed. The results for (ii) and (iii) (see the Supporting information) show that the point-estimate-based dose selection criterion (6) often yields similar performance as the posterior-probability-based criterion (5), and DROID is not sensitive to the model assumption of PD. One factor contributing to the robustness is that for the purpose of selecting the optimal dose, we do not need to obtain accurate estimates. As long as the estimates recover the correct order of the doses in PD, the design will lead to correct dose selection and allocation.
Selection percentage and the average number of patients treated at each dose under DROID designs that allow adding dose to TDR/RP2S in Stage II.
| Dose level | 1 | 2 | 3 | 4 | 5 | 1 | 2 | 3 | 4 | 5 |
|---|---|---|---|---|---|---|---|---|---|---|
| Scenario 1 | Scenario 2 | |||||||||
| DROID-BOIN Sel % | 0.021 | 0.764 | 0.204 | 0.000 | 0.000 | 0.000 | 0.139 | 0.850 | 0.002 | 0.000 |
| No. patients | 20.2 | 19.8 | 18.5 | 15.0 | 4.3 | 6.7 | 20.0 | 19.6 | 18.7 | 11.7 |
| DROID-CRM Sel % | 0.011 | 0.787 | 0.192 | 0.000 | 0.000 | 0.000 | 0.187 | 0.797 | 0.000 | 0.000 |
| No. patients | 20.2 | 19.8 | 18.2 | 14.0 | 3.7 | 16.5 | 19.9 | 19.0 | 17.3 | 9.2 |
| Scenario 3 | Scenario 4 | |||||||||
| DROID-BOIN Sel % | 0.007 | 0.020 | 0.755 | 0.211 | 0.000 | 0.000 | 0.000 | 0.003 | 0.744 | 0.240 |
| No. patients | 20.2 | 19.9 | 19.6 | 18.5 | 12.1 | 4.2 | 11.8 | 19.8 | 19.8 | 19.0 |
| DROID-CRM Sel % | 0.003 | 0.037 | 0.733 | 0.211 | 0.000 | 0.000 | 0.000 | 0.008 | 0.750 | 0.233 |
| No. patients | 20.2 | 19.9 | 19.2 | 17.6 | 10.3 | 5.3 | 12.9 | 19.9 | 19.7 | 18.2 |
| Scenario 5 | Scenario 6 | |||||||||
| DROID-BOIN Sel % | 0.000 | 0.018 | 0.076 | 0.841 | 0.051 | 0.026 | 0.797 | 0.166 | 0.001 | 0.000 |
| No. patients | 7.4 | 19.2 | 19.6 | 18.7 | 12.5 | 20.1 | 19.8 | 11.7 | 1.4 | 0.1 |
| DROID-CRM Sel % | 0.000 | 0.018 | 0.087 | 0.814 | 0.038 | 0.012 | 0.808 | 0.154 | 0.000 | 0.000 |
| No. patients | 6.6 | 19.4 | 19.3 | 17.8 | 10.6 | 20.2 | 19.5 | 11.9 | 2.3 | 0.1 |
| Scenario 7 | Scenario 8 | |||||||||
| DROID-BOIN Sel % | 0.000 | 0.000 | 0.001 | 0.056 | 0.929 | 0.787 | 0.184 | 0.001 | 0.000 | 0.000 |
| No. patients | 3.7 | 7.8 | 17.7 | 19.8 | 19.0 | 24.1 | 12.3 | 2.4 | 0.3 | 0.0 |
| DROID-CRM Sel % | 0.000 | 0.000 | 0.004 | 0.093 | 0.884 | 0.690 | 0.279 | 0.003 | 0.000 | 0.000 |
| No. patients | 5.2 | 7.2 | 17.8 | 19.7 | 18.0 | 21.8 | 15.5 | 3.5 | 0.5 | 0.0 |
| Scenario 9 | ||||||||||
| DROID-BOIN Sel % | 0.001 | 0.004 | 0.001 | 0.000 | 0.000 | |||||
| No. patients | 20.1 | 19.8 | 19.6 | 18.5 | 5.8 | |||||
| DROID-CRM Sel % | 0.000 | 0.003 | 0.001 | 0.000 | 0.000 | |||||
| No. patients | 20.0 | 19.8 | 19.6 | 18.7 | 6.8 | |||||
Notes: The boldface numbers are optimal doses.
BOIN, Bayesian optimal interval design; CRM, continuous reassessment method; DROID, dose-ranging approach to optimizing dose; RP2S, recommended phase 2 dose set; TDR, therapeutic dose range.
4 Discussion
We have proposed DROID designs, a dose-ranging approach to optimizing dose for oncology trials with targeted drugs. DROID is a two-stage design. In the first stage, a model-based or model-assisted design is used to identify the TDR and RP2S in terms of both efficacy and toxicity. In the second stage, more patients are randomized to the doses in the RP2S to assess the dose–response relationship for PoC and identify the optimal dose. Our simulation study shows that the proposed DROID designs have desirable operating characteristics.
To facilitate the implementation of the DROID design in practice, we use the PD endpoint (or efficacy surrogate endpoint)  , along with the toxicity endpoint
  , to make the decision of dose assignment in Stage I. In some trials,
  may not be a strong surrogate for efficacy
  . This, however, is not of concern because
  is mainly used to determine the relative desirability among doses, not to estimate efficacy of the doses. Thus, as long as
  and
and  are reasonably concordant, patient allocation based on
  is generally similar to that based on
  . Moreover and more important, in the DROID design,
  is indeed used as a gatekeeper for key decisions, for example, to identify RP2S at the end of Stage I and to establish PoC and the optimal dose at the end of the trial. An alternative approach is to build a regression model and use
  to predict
  , and then make dose assignment decisions based on
  and
and  . As
. As  often takes a long time to be observed and the number of events (i.e., responses) may be small, this approach may offer limited improvement and is subject to the influence of misspecification of the prediction model.
Lastly, Stages I and II of the DROID design are not binding. In some applications, Stage I can be replaced by some pragmatic approaches. For example, we may first perform conventional dose escalation to identify the MTD with backfill or followed by small dose expansion on the MTD and a few doses below the MTD to identify the RP2S for Stage II randomization. This approach is less efficient to identify the RP2S, but might be more accessible to some practitioners as it is more similar to the conventional paradigm. Also, Stage II can be used independently as a randomized, parallel dose–response trial design, an approach recommended by the FDA (2022a).
Data Availability Statement
Data sharing is not applicable in this paper as all data in this paper are computer simulated.
Acknowledgments
The authors thank the Associate Editor and two Referees for their valuable comments which substantially improved the presentation of this ppaer. Guo's research is supported by the R&D Research Competitiveness Subprogram of Louisiana Board of Regents, Contract number LEQSF(2022-25)-RD-A-07. Yuan's research was partially supported by Award Number P50CA221707, P50CA127001, and P30 CA016672 from the National Cancer Institute.
References
Supplementary data
Supporting information, Tables, and Figures referenced in Sections 2 and 3, as well as R code files for the simulation studies are available with this paper at the Biometrics website on Wiley Online Library.
Table S1. Selection percentage and the average number of patients treated at each dose under DROID-BOIN based on ORR that selects as the dose where
plateaus under two cutoff values for C1.
Table S2. Dose level, outcomes, estimates, and decisions of each cohort in Stage I of trial illustration.
Table S3. Outcomes of patients randomized in Stage II.
Figure S1. Barplots of the selection percentage of each dose under the DROID designs. DROID, dose-ranging approach to optimizing dose.
Figure S2. Barplots of the selection percentage of each dose under the DROID designs that allow adding doses to TDR/RP2S in Stage II. DROID, dose-ranging approach to optimizing dose; RP2S, recommended phase 2 dose set; TDR, therapeutic dose range.
Table S4. True toxicity, PD, ORR, the selection percentage, and the average number of patients treated at each dose under DROID-BOIN design with PD generated from the logistic model. BOIN, Bayesian optimal interval design; DROID, dose-ranging approach to optimizing dose; PD, PD, pharmacodynamics.
Data S1
