


Abstract
Prognostic indices can enhance personalized predictions of health burdens. However, a simple, practical, and reproducible tool is lacking for clinical use. This study aimed to develop a machine learning-based prognostic index for predicting all-cause mortality in community-dwelling older individuals.
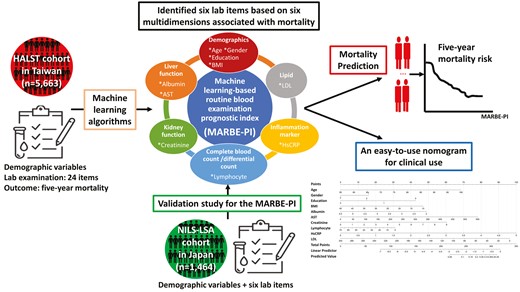
We utilized the Healthy Aging Longitudinal Study in Taiwan (HALST) cohort, encompassing data from 5 663 participants. Over the 5-year follow-up, 447 deaths were confirmed. A machine learning-based routine blood examination prognostic index (MARBE-PI) was developed using common laboratory tests based on machine learning techniques. Participants were grouped into multiple risk categories by stratum-specific likelihood ratio analysis based on their MARBE-PI scores. The MARBE-PI was subsequently externally validated with an independent population-based cohort from Japan.
Beyond age, sex, education level, and BMI, 6 laboratory tests (low-density lipoprotein, albumin, aspartate aminotransferase, lymphocyte count, high-sensitivity C-reactive protein, and creatinine) emerged as pivotal predictors via stepwise logistic regression (LR) for 5-year mortality. The area under curves of MARBE-PI constructed by LR were 0.799 (95% confidence interval [95% CI]: 0.778–0.819) and 0.756 (95% CI: 0.694–0.814) for the internal and external validation data sets, and were 0.801 (95% CI: 0.790–0.811) and 0.809 (95% CI: 0.774–0.845) for the extended 10-year mortality in both data sets, respectively. Risk categories stratified by MARBE-PI showed a consistent dose–response association with mortality. The MARBE-PI also performed comparably with indices constructed with clinical health deficits and/or laboratory results.
The MARBE-PI is considered the most applicable measure for risk stratification in busy clinical settings. It holds potential to pinpoint older individuals at elevated mortality risk, thereby aiding clinical decision-making.
Scientists and clinicians have sought a simple and practical way to identify older adults at risk for adverse health outcomes, including hospitalization, disability, and mortality. A comorbidity summarization score has yielded great predictive ability for 30-, 90-, 180-day, and 1-year mortality (1). Prognostic indices including Frailty Index (FI) incorporating deficits across various health domains (eg, comorbidities, activities of daily living, instrumental activities of daily living, physical performance, cognitive function, and mood status) have been demonstrating their ability to identify vulnerable older adults and predict mortality (2–8). Biomarker-based biological age constructed with lung function, kidney function, reaction time, insulin-like growth factor 1, hand grip strength, and blood pressure using UK Biobank significantly improved mortality prediction (9). However, the need for comprehensive data collection and additional assessments beyond routine clinical care compromise its clinical utility due to extra economic expense and human resources consumption (10).
To facilitate rapid screening in clinical setting, laboratory tests, which are objective and reliable measures, have been used to identify high risk of adverse health outcomes. An FI based on 21 routine blood tests plus systolic and diastolic blood pressure, namely FI-lab (11), was created and potentially differentiated older adults at high risk versus low risk of mortality; however, the area under curve (AUC) for FI-lab was only 0.72. Even when using the FI-lab in combination with signs, symptoms, and diseases, the AUC for mortality showed only a modest increase to 0.74 (11). Additionally, the cutoff value of each blood test used for determination and categorization of health deficits was relatively subjective and arbitrary in FI-lab (11). For example, the counts of white blood cells (WBC) below 1.8 × 10³/mm3 or above 7.8 × 10³/mm3 indicated “having a health deficit” in FI-lab; however, WBC counts were classified as tertiles of <5.5 × 10³/mm3, 5.5–7.1 × 10³/mm3, and >7.1 × 10³/mm3 in another population-based study (11).
Although the aforementioned prediction tools have been validated with large-scale cohorts, the population-level risk assessment, like prediction model, failed to translate to individual risk evaluation (12,13). To develop a precision prediction approach using available clinical data, the machine learning (ML) method has been widely applied to recognize risk factors and predict numerous adverse outcomes in large data sets with an ocean of variables (14–16). Peng et al. developed a ML-based multimorbidity index using the National Health Insurance Research Database in Taiwan. They further established different risk groups using ML approach to achieve the best distinction between groups and demonstrate the dose–response relationship with all-cause mortality, hospitalizations, and so on (17). However, the study only included hospitalized and institutionalized patients. Additionally, the AUC of ML-mFI for predicting mortality is only 0.602. Similar results are also shown in a previous study (18). In addition, a prognostic score through self-reported questionnaires based on UK Biobank successfully estimated personalized 5-year mortality risk (C index: 0.80 for men and 0.79 for women) (19). However, these researches lack of independent validation limited the generalizability. Therefore, a clinician-friendly approach with external and international validation, potentially enabling a proactive holistic intervention, is warranted (20).
In this study, we hypothesized that there is a predictive model that can utilize common laboratory tests, which are mostly covered by our National Health Insurance, to predict all-cause mortality. Our study aimed to utilize a large, prospective population cohort to develop and internally cross-validate a new prediction model with laboratory items, called ML-based routine blood examination prognostic index (MARBE-PI), for predicting 5- and 10-year mortality risk in the middle-aged and older adults. Furthermore, we established multiple risk groups based on their indices using a stratum-specific likelihood ratios (SSLR) approach and the dose–response association between the risk groups and mortality was also studied. Finally, we used an independent national cohort from Japan to externally validate the proposed MARBE-PI developed in Taiwan.
Method
Study Design and Participants
A population-based longitudinal cohort, namely the Healthy Aging Longitudinal Study in Taiwan (HALST), was established and funded by the National Health Research Institutes in Taiwan (ClinicalTrials.gov: NCT02677831) (21). Detailed information on HALST cohort is provided in Supplementary Material—HALST cohort. A total of 5 663 participants aged ≥55 between 2009 and 2013 answered the interviewer-administered questionnaires at home visits, and 5 348 participants completed all assessments at baseline. We used data from the first wave of HALST linking the Taiwan cause of death record to investigate the association between the prognostic indices and mortality. The study protocol was approved by the Institutional Review Board of the National Health Research Institutes (NHRI IRB No. EC0970608). Written informed consent was obtained from all participants before inclusion in the study.
Laboratory Items
The laboratory items for exploring the association between common laboratory tests and mortality were considered based on literature (22). To ensure that our laboratory items were comprehensive and clinically relevant, a group of experts including physicians, geriatricians, gerontologists, epidemiologists, and biostatisticians conducted an initial screening after reviewing the data set. A total of 24 items reportedly associated with mortality were selected, including (i) lipid profile (total cholesterol [TC]/low density lipoprotein cholesterol [LDL]/high density lipoprotein [HDL]/triglyceride [TG]) (23); (ii) blood sugar (fasting blood glucose [Glu-AC]/HbA1c/insulin) (23); liver function (globulin/albumin/total protein (24)/aspartate aminotransferase [AST] (25)); (iii) kidney function (blood urea nitrogen/creatinine/uric acid) (26); (iv) inflammation marker (high-sensitivity C-reactive protein (hsCRP)/intact parathyroid hormone (iPTH) (26)/free calcium (27)); (v) complete blood count or differential count (WBC counts (26)/hemoglobin (26)/platelet (28)/mean corpuscular volume (MCV)/neutrophil/lymphocyte (29)); and (vi) vitamin (30).
Outcome Measures
The primary outcome was 5-year mortality, and the secondary outcome was 10-year mortality. In this study, all 5 663 participants were linked to the national “Taiwan Cause of Death Record” between 2009 and 2021 from the Health and Welfare Data Science Center, Ministry of Health and Welfare, Taiwan. Using the binary outcome measures of death or survival within 5 years, the data were analyzed using our ML techniques. Because the registration of deaths is mandatory, this linkage is considered to be very accurate.
Statistical Analysis
Baseline characteristics
Baseline characteristics are presented as the numbers (percentages) for categorical variables and the mean (standard deviation) for continuous variables. Differences in baseline characteristics between status of 5-year survival (survival and death) were analyzed with Student’s t test and the chi-square test, as appropriate.
Data preprocessing and machine learning techniques
In this study, the ML techniques included stepwise logistic regression (LR), LASSO (short for Least Absolute Shrinkage and Selection Operator) regression, and random forest (RF). Figure 1 displays the workflow of data analysis in this study. The first step is data preprocessing. The second step is 10-fold cross-validation for the entire ML process. Details are provided in Supplementary Material—Data preprocessing and 10-fold cross-validation. Based on the 24 laboratory items as well as age, sex, education level, and body mass index (BMI), ML techniques that select variables based on the best fitness of the model were applied to develop MARBE-PI. The discriminative ability of each model was assessed using the AUC, accompanied by its corresponding 95% confidence interval (CI), standard error (SE), and root-mean-square error (RMSE).
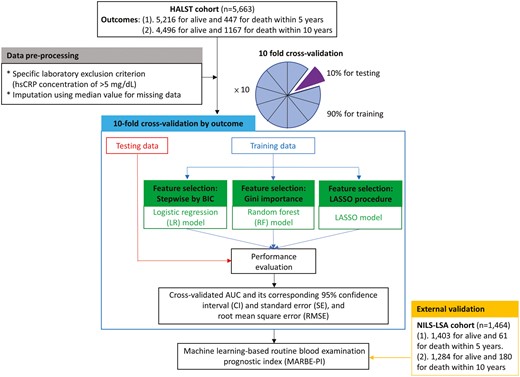
Workflow of data analysis, including data preprocessing, 10-fold cross-validation, and external validation for the entire machine learning process.
Machine learning-based prognostic index
The prognostic index is the main output of the ML model in this study. In many health science areas, the stepwise LR model is a high-performance ML model that offers great interpretability because the odds ratio (OR) in LR indicates the relative likelihood of an outcome (eg, mortality) given a specific exposure, such as a symptom, disease, or a 1-unit increment in a laboratory test (31). However, RF models are challenging to interpret. Moreover, ML models often incorporate a vast number of independent variables, which can lead to unexplainable patterns. We developed prediction models using stepwise LR and evaluated the 5-year mortality risk. Moreover, we also examined whether our developed MARBE-PI accurately predicted 10-year mortality in the HALST data.
Data preprocessing, prediction model building, and the processing of validation were constructed using R program and its related packages, including “cvAUC” for 10-fold cross-validation, “randomForest” for RF, “glmnet” for LASSO, “ggplot2” for calibration plot, and so on.
In order to translate a continuous prognostic index into a clinical decision, it is necessary to determine cutoff points and to stratify individuals into distinct groups, each requiring a different kind of health management (32). All individuals were grouped into multiple categories (groups) by SSLR analysis, based on their MARBE-PI scores. The SSLR approach was used to identify the cutoff points of MARBE-PIs for 5-year mortality risk, so that all participants can be grouped into multiple groups based on their distinct mortality risk (33). Detailed information is presented in Supplementary Material—SSLR approach. Finally, we studied the dose–response relationship between the PI groups and mortality risk using LR.
To assess the discriminative ability of MARBE-PI, we established a prognostic index using extra clinical health items (machine learning-based clinical health item prognostic index, MACHI-PI), and combined the MARBE-PI and MACHI-PI into a new prognostic index (combined PI; Supplementary Material—procedure for developing MACHI-PI and Combined PI). We aim to demonstrate our laboratory-based MARBE-PI that would have comparable discrimination power and good dose–response relationship with mortality risk when comparing to clinical-based MACHI-PI and/or combined PI.
Submodel Methods for Sensitivity Analysis
In our research, the proposed MARBE-PI may be used when there are missing data, specifically, when some predictors may not be available. This methodology is also suitable for external validation, as detailed below. When a predictor value is missing, it is imputed as zero. This implies that the predictor is excluded, and the MARBE-PI is applied using the LR coefficients of the original MARBE-PI. Janssen et al. developed a submodel approach, also known as the “all possible subsets regression procedure.” Their method identifies necessary submodels based solely on observed data (34). In this study, the most straightforward method involves fitting all potential submodels of the MARBE-PI from every possible combination of the candidate laboratory items. Subsequently, the discriminative ability of each submodel is evaluated. For k candidate laboratory items, there are 2k submodels to be evaluated for sensitivity analysis due to missing data.
The Validation Cohort: National Institute for Longevity Sciences—Longitudinal Study of Aging
In this validation study, our first objective is to validate the proposed prediction model (MARBE-PI) with the independent cohort of National Institute for Longevity Sciences - Longitudinal Study of Aging (NILS-LSA) from Japan population (Figure 1). The second objective is to study the dose–response relationship between the groups of risk level and mortality in the NILS-LSA cohort. Detailed information on NILS-LSA cohort is provided in Supplementary Material—NILS-LSA cohort.
The MARBE-PI developed using HALST cohort was applied to predict the mortality risks for individuals in the NILS-LSA cohort. Mortality risk estimation in the NILS-LSA cohort was based on the LR coefficients derived from the HALST data. The accuracy of the prediction model was presented by AUC. The 95% bootstrap CI of the AUC was determined from bootstrapping, with 1 000 resamplings (35). Then, we applied the developed MARBE-PI to study the dose–response relationship between the groups of PI level and mortality risk. All individuals from the NILS-LSA cohort were grouped into 4 categories (ie, robustness, low, medium, or high risk of mortality) based on the quantile scores of their risk status from the NILS-LSA data. LR model will be used to investigate the association of group of risk level and mortality.
Results
Participant Characteristics
Table 1 shows the baseline characteristics of the HALST and NILS-LSA cohorts. In the HALST, a total of 5 663 participants aged ≥55 (mean age = 69.6 ± 8.3 years) were analyzed. 52.8% of participants were female, 73.1% of participants were married, 12.8% of participants were current smokers, and 76.6% had BMI in the normal range of 18.5 to 27 kg/m2. In addition, about 45% of the HALST participants had higher than 6 years education. Using the Taiwan cause of death record, 447 (7.9%) individuals deceased during the 5-year follow-ups. Supplementary Table 1 describes differences in baseline laboratory items by the status of 5-year survival. There were significant statistical differences between the death group and the survival group in 16 items, where blood urea nitrogen (BUN), uric acid, creatinine, AST, globulin, hsCRP, iPTH, lymphocyte, MCV, and WBC were higher in the death group than the survival group; albumin, hemoglobin, LDL, neutrophil, platelet, and TC were higher in the survival group than the death group. The external validation cohort from NILS-LSA included 1 464 participants aged ≥55 (mean age = 68.6 ± 8.3 years), of which 49.7% of participants were female, 81.9% of participants were married, 12.4% of participants were current smokers, and 86.6% had BMI in the normal range (for more details, please see Table 1).
Baseline Demographic, Lifestyle, and Socioeconomic Characteristics in HALST and NILS-LSA (External Validation) Cohorts
| Variables | Levels | HALST | NILS-LSA | ||
|---|---|---|---|---|---|
| N = 5 663 | % | N = 1 464 | % | ||
| Age | 55–64 | 1 685 | 29.8 | 506 | 34.6 |
| 65–74 | 2 497 | 44.1 | 517 | 35.3 | |
| 75–84 | 1 282 | 22.6 | 401 | 27.4 | |
| 85– | 199 | 3.5 | 40 | 2.7 | |
| Sex | Male | 2 675 | 47.2 | 736 | 50.3 |
| Female | 2 988 | 52.8 | 728 | 49.7 | |
| BMI | Normal (18.5–27 kg/m2) | 4 338 | 76.6 | 1 268 | 86.6 |
| Abnormal (<18.5 or >27 kg/m2) | 1 325 | 23.4 | 196 | 13.4 | |
| Marital status | Married | 4 139 | 73.1 | 1 199 | 81.9 |
| Widowed | 1 235 | 21.8 | 196 | 13.4 | |
| Divorced, separated, and single | 289 | 5.1 | 69 | 4.7 | |
| Education level | No education | 799 | 14.1 | 1 | 0.1 |
| Primary school (1–6 y) | 2 322 | 41 | 17 | 1.2 | |
| High school (7–12 y) | 1 628 | 28.7 | 1 026 | 70.1 | |
| College or above (>12 y) | 910 | 16.1 | 420 | 28.7 | |
| Smoking status | Current smoker | 723 | 12.8 | 182 | 12.4 |
| Past smoker | 894 | 15.8 | 417 | 28.5 | |
| Nonsmoker | 4 046 | 71.4 | 865 | 59.1 | |
| Betel quid | Current chewer | 180 | 3.2 | — | — |
| Past chewer | 512 | 9 | — | — | |
| Nonchewer | 4 971 | 87.8 | — | — | |
| Household income (monthly, NT$)* | No income | 245 | 4.3 | 0 | — |
| 1–20 000 | 3 055 | 53.9 | 52 | 3.6 | |
| 20 001–40 000 | 781 | 13.8 | 119 | 8.1 | |
| 40 001–60 000 | 365 | 6.4 | 269 | 18.4 | |
| 60 001– | 336 | 5.9 | 987 | 67.4 | |
| Unknown | 881 | 15.6 | 37 | 2.5 | |
Notes: HALST = Healthy Aging Longitudinal Study in Taiwan; NILS-LSA = Least Absolute Shrinkage and Selection Operator.
*The household income for NILS-LSA (in Yen) is divided by the exchange rate of 5 (NT$:Yen = 1:5). Corresponding income categories are no income (no such category in NILS-LSA), <25 000, 25 001–41 500, 41 501–58 167, 58 168–, and unknown.
Discriminative Ability of the Machine Learning Process in Prediction of Mortality
The discriminative ability (AUC and its corresponding 95% CI and SE, and RMSE) of 10-fold cross-validation in the 3 ML methods (stepwise LR, LASSO, and RF) is shown in Table 2. The AUCs for stepwise LR, LASSO, and RF models were 0.799 (95% CI: 0.778–0.819), 0.797 (95% CI: 0.776–0.818), and 0.777 (95% CI: 0.753, 0.801), respectively, for 5-year mortality. Our results indicated that the stepwise LR model (namely, MARBE-PI) performed a bit better than the LASSO and RF models. However, there were no statistically significant differences in AUC between the 3 ML models based on the 95% CI.
Comparisons of Performance (AUC) Between the Stepwise Logistic Regression, LASSO, and Random Forest Models for 5-Year and 10-Year Mortality in HALST Cohort
| Prediction Model* | AUC (95% CI) | AUC SE | RMSE |
|---|---|---|---|
| 5-y mortality | |||
| Stepwise logistic regression | 0.799 (0.778, 0.819) | 0.011 | 0.064 |
| LASSO | 0.797 (0.776, 0.818) | 0.011 | 0.065 |
| Random forest | 0.777 (0.753, 0.801) | 0.012 | 0.064 |
| 10-y mortality | |||
| Stepwise logistic regression | 0.801 (0.790, 0.811) | 0.005 | 0.154 |
| LASSO | 0.809 (0.800, 0.820) | 0.005 | 0.125 |
| Random forest | 0.672 (0.662, 0.683) | 0.005 | 0.134 |
Notes: AUC = area under curve; CI = confidence interval; HALST = Healthy Aging Longitudinal Study in Taiwan; LASSO = Least Absolute Shrinkage and Selection Operator; SE = standard error; RMSE = root-mean-square error.
*All models were adjusted for age, sex, education level, and BMI. N = 5 663.
Variable Selection of the Stepwise Logistic Regression Model
When performing the variable selection, Table 3 shows the variables selected in the MARBE-PI for 5-year mortality by the stepwise LR method based on the HALST sample. The prediction model identified the 10 most important predictors (age, sex, education level, BMI, and the 6 blood examination items—including, albumin, AST, creatinine, hsCRP, LDL, and lymphocyte). Supplementary Figure 1 shows the importance of the variables of the laboratory items established by the stepwise LR, RF, and LASSO methods, respectively. The stepwise LR method identified the 10 most important predictors (as mentioned above); of them, 5—including age, BMI, creatinine, hsCRP, and lymphocyte—were also in the top 10 important variables for the RF method. In addition, 9 of the 10 selected predictors (with the exception of the LDL test) were among the top 10 most important variables identified by the LASSO method.
The Mortality Risk for MARBE-PI Items by Stepwise Logistic Regression (Performed Stepwise Model Selection by BIC) in HALST Cohort
| Variable | Beta | OR† (95% CI) | p Value |
|---|---|---|---|
| Intercept | −2.16 | .087 | |
| Age (y) | 0.09 | 1.09 (1.08, 1.11) | <.001* |
| Sex | |||
| Male | 1 | ||
| Female | −0.59 | 0.55 (0.44, 0.70) | <.001* |
| Education level | |||
| No | 1 | ||
| Primary school | −0.41 | 0.66 (0.49, 0.90) | .009* |
| High school | −0.62 | 0.54 (0.38, 0.77) | <.001* |
| College or above | −0.90 | 0.40 (0.26, 0.62) | <.001* |
| BMI | −0.05 | 0.95 (0.92, 0.98) | .002* |
| Laboratory items | |||
| Albumin (g/dL) | −0.85 | 0.43 (0.28, 0.65) | <.001* |
| AST (U/L) | 0.01 | 1.01 (1.004, 1.02) | .002* |
| Creatinine (mg/dL) | 0.41 | 1.51 (1.30, 1.76) | <.001* |
| HsCRP (mg/dL) | 0.40 | 1.49 (1.24, 1.77) | <.001* |
| LDL (mg/dL) | −0.01 | 0.99 (0.99, 0.997) | <.001* |
| Lymphocyte (%) | −0.03 | 0.97 (0.96, 0.99) | <.001* |
Notes: AST = aspartate aminotransferase; BIC = Bayesian information criterion; BMI = body mass index; CI = confidence interval; HALST = Healthy Aging Longitudinal Study in Taiwan; HsCRP = high-sensitivity C-reactive protein; LDL = low-density lipoprotein cholesterol; MARBE-PI = machine learning-based routine blood examination prognostic index; OR = odds ratio.
*p Value < .05.
†All models were adjusted for age, sex, education level, and BMI. N = 5 663.
Moreover, using the Taiwan cause of death record, 1 167 (20.6%) individuals in the HALST data deceased during the 10-year follow-ups. The results indicated that the accuracy of our MARBE-PI for the extended 10-year mortality prediction (AUC: 0.801, 95% CI: 0.790–0.811 using stepwise LR) was as good as 5-year prediction (Table 2).
Capability for Predicting Cause-Specific Mortality
In assessing cause-specific mortality, 386 individuals died of cancer within 5 years, 337 individuals died of cardiovascular disease (CVD), including heart diseases, cerebrovascular disease, and hypertension within 5 years. The MARBE-PI demonstrated an AUC of 0.719 (95% CI: 0.679–0.758) for cancer mortality, 0.807 (95% CI: 0.768–0.845) for cardiovascular disease (CVD) mortality, and 0.846 (95% CI: 0.820–0.872) for noncancer and noncaediovascular disease mortality.
Determination of Risk Status by Machine Learning-Based Prognostic Index
With the application of SSLR (as seen in the upper part of Supplementary Table 2), all participants were categorized into multiple groups based on the values of the MARBE-PI. Robustness was indicated by 0 ≤ MARBE-PI < 0.06; low risk was 0.06 ≤ MARBE-PI < 0.116; medium risk was 0.116 ≤ MARBE-PI < 0.192; and high risk was 0.192 ≤ MARBE-PI. Using the LR model, we found a dose–response association between the 4 risk groups and 5-year mortality (ORs in low risk group: 3.91, 95% CI: 2.9–5.29; medium risk group: 7.08, 95% CI: 5.15–9.74; high risk group: 18.11, 95% CI: 13.7–24.1, upper part of Table 4).
The 5-Year Mortality Risk for the MARBE-PI by Risk Groups in HALST Cohort and NILS-LSA (External Validation) Cohort
| Risk Status | Survival | Death | OR (95% CI) | ||
|---|---|---|---|---|---|
| N | (%) | N | (%) | ||
| HALST cohort | |||||
| Category | |||||
| Robustness (scale: 0–0.06) | 3 323 | 63.8 | 83 | 18.7 | 1 |
| Low risk (scale: 0.06–0.116) | 1 023 | 19.6 | 100 | 22.6 | 3.91 (2.90, 5.29) |
| Medium risk (scale: 0.116–0.192) | 475 | 9.1 | 84 | 19.0 | 7.08 (5.15, 9.74) |
| High risk (scale: 0.192–) | 389 | 7.5 | 176 | 39.7 | 18.11 (13.7, 24.1) |
| Continuous | |||||
| Per increment of 0.1 unit | — | — | — | — | 2.22 (2.06, 2.41) |
| NILS-LSA cohort | |||||
| Category* | |||||
| Robustness group | 362 | 25.9 | 3 | 4.9 | 1 |
| Low-risk group | 359 | 25.7 | 6 | 9.8 | 2.02 (0.53, 9.61) |
| Medium-risk group | 347 | 24.8 | 18 | 29.5 | 6.26 (2.10, 26.9) |
| High-risk group | 331 | 23.7 | 34 | 55.7 | 12.39 (4.40, 51.8) |
| Continuous | |||||
| Per increment of 0.1 unit | — | — | — | — | 3.62 (2.55, 5.16) |
Notes: CI = confidence interval; HALST = Healthy Aging Longitudinal Study in Taiwan; MARBE-PI = machine learning-based routine blood examination prognostic index; NILS-LSA = National Institute for Longevity Sciences - Longitudinal Study of Aging; OR = odds ratio.
*All individuals from the NILS-LSA cohort were grouped into 4 categories (ie, robustness, low, or high risk of mortality) based on the quantile scores of their risk status. N = 5 663.
In addition, MARBE-PI, MACHI-PI, and combined PI comparably predicted 5-year mortality with dose–response association (Supplementary Tables 2–4). The combined PI exhibited superior discrimination compared to the MARBE-PI, while the MACHI-PI demonstrated the least effective discrimination. Nonetheless, these differences were negligible when considering the 95% CI of the AUC. Moreover, the MARBE-PI, MACHI-PI, and combined PI were associated with 5-year mortality with an OR of 2.22 (95% CI: 2.06–2.41), 2.13 (95% CI: 1.99–2.29), and 2.13 (95% CI: 1.99–2.28) per increment of 0.1 unit, respectively (Supplementary Table 4). This means that MARBE-PI alone could be a reliable index to precisely predict mortality risk for older adults. The significant predictors identified for MACHI-PI and combined PI are shown in Supplementary Tables 5 and 6, respectively.
Sensitivity Analysis
The proposed MARBE-PI has k = 6 blood examination items as described above. Consequently, there are 64 submodels, representing all possible combinations of these items being present or absent. The discriminative ability results for all submodels are presented in Supplementary Table 7. The distribution of AUC values for all submodels within the MARBE-PI is depicted in Supplementary Figure 2. AUC values for 5-year mortality across the submodels range from 0.761 (95% CI: 0.74–0.784; this model excluded all laboratory items and only age, sex, education level, and BMI are included in the model) to 0.789 (95% CI: 0.768–0.810); this model excluded the LDL item from the MARBE-PI).
Validation Study Analysis
Our MARBE-PI was validated in the NILS-LSA using both the AUC and a calibration plot. The average 5-year rate in the NILS-LSA was 4.2% (N = 61). Demographic and laboratory characteristics of the NILS-LSA cohort at baseline can be found in Supplementary Table 8. Because the NILS-LSA does not include a lymphocyte test, we constructed a 9-item submodel of MARBE-PI, excluding the lymphocyte item, to evaluate the discriminative capability of the MARBE-PI for external validation. Lymphocyte values were imputed as zero. This indicates that the lymphocyte item was omitted while the intercept and regression coefficients of the remaining predictors in the MARBE-PI were retained without any modifications. This 9-item submodel, without the lymphocyte, demonstrated an AUC of 0.756 (95% bootstrapped CI: 0.694–0.814; SE: 0.031) for 5-year mortality, and an AUC of 0.809 (95% bootstrapped CI: 0.774–0.845; SE: 0.018) for 10-year mortality.
However, the calibration of the 9-item submodel of MARBE-PI within the NILS-LSA was suboptimal, leading to a significant overestimation (because the negative effect of lymphocyte item was ignored in the model) of the 5-year mortality risk, especially at higher predicted risks (as seen in the left part of Supplementary Figure 3). The MARBE-PI’s calibration had a slope of 1 (95% CI: 0.73–1.28) and an intercept of −1.05 (95% CI: −1.59 to −0.52), indicating notable deviations from perfect calibration. The slope was very close to 1, but the intercept was too far from 0, and as a result, model recalibration is needed.
Recalibration of MARBE-PI for NILS-LSA Cohort
The MARBE-PI model for 5-year mortality was poorly calibrated for the Japanese population because the intercept in the calibration plot was lower than 0 (in the left part of Supplementary Figure 3). Usually, the original prediction model may need to be recalibrated before ultimate reliable application to the new population (36). After applying logistic calibration regression (recalibration), the MARBE-PI model exhibited superior calibration (as depicted in the right part of Supplementary Figure 3). Recalibration of the MARBE-PI led to a little enhancement in discrimination, with AUC values ranging from 0.756 to 0.757 for 5-year mortality and an AUC value of 0.809 for 10-year mortality. Additionally, post-recalibration, the MARBE-PI effectively differentiated between various risk groups, showing dose–response mortality risks, and associated with 5-year mortality with an OR of 3.62 (95% CI: 2.55–5.16) per increment of 0.1 unit (in lower part of Table 4).
Discussion
In this study, we have developed a ML-based PI based on laboratory data sets (MARBE-PI) for predicting 5-year mortality with the potential to project 10-year mortality. Using LR model, our MARBE-PI demonstrated comparable ability to establish a dose–response relationship with mortality risk when comparing to a MACHI-PI constructed with clinical health items, and a combined PI. Moreover, in external validation, our MARBE-PI yielded a very satisfactory discriminative ability for 5-year mortality in another independent population-based cohort from Japan. The outcome of 5-year mortality is a research of “young death,” which is much earlier than average lifespan in Taiwan as well as Japan. Therefore, this clinical prediction is valuable as an early detection marker of premature mortality. Significantly, the MARBE-PI demonstrated remarkable discrimination for noncancer/non-CVD mortality in 5 years. However, its discrimination was less effective when predicting cancer mortality. Intuitively, this is because the prediction for cancer death is intricately linked to the cancer-specific biomarkers.
All laboratory items identified in the MARBE-PI were significantly associated with mortality, the association directions were mostly consistent with previous study findings (37–43). Interestingly, some of these biomarkers are associated with cause-specific mortality. First, hsCRP is already acknowledged as a biomarker for both cancer development and prognosis, and vascular events (44). This reflects its significant role in systemic inflammation and disease progression (45). In the HALST cohort study, hsCRP were significantly associated with cancer mortality (OR = 1.85, 95% CI: 1.46–2.29, p < .001) and CVD mortality (OR = 1.52, 95% CI: 1.07–2.03, p = .01) after adjustment for age, sex, education level, and BMI. Second, regarding LDL cholesterol, our findings presented some conflicting results. Although it is commonly believed that high levels of LDL cholesterol increase mortality risk, our model indicated a negative association between LDL and mortality. This finding is consistent with some studies (46–49), in which a Denmark cohort study demonstrated that the nadir of mortality was found at an LDL concentration of 140 mg/dL for the general population (46). It indicates that the mortality rate decreased when LDL increased before the concentration of 140 mg/dL. In addition, recent studies have expanded the understanding of LDL, traditionally associated with atherosclerosis, by highlighting its significance in malnutrition and its potential as a mortality predictor when LDL levels are low (50). In our study, participants showed relatively low baseline LDL levels (mean: 118.6 ± 32 mg/dL), correlating with a significant 0.7% increase in CVD mortality risk for each 1 mg/dL decrease in LDL (p = .031). In addition, low LDL in HALST participants is associated with self-reported malnutrition (p = .012). Our findings warrant further investigation into whether malnutrition modified the association of LDL with CVD mortality. Finally, concerning lymphocytes, Núñez et al. demonstrated that low lymphocyte percentages were associated with higher risk of all-cause mortality and CVD hospitalization (51). Our results similarly indicated a negative association between lymphocyte percentage and CVD mortality (OR = 0.96, 95% CI: 0.94–0.99, p = .005) after adjustment for age, sex, education level, and BMI. These aforementioned findings suggest the need for further investigation into the complex role of hsCRP, LDL, and lymphocyte in diverse health outcomes.
Shi et al. suggested that traditional FI or PI should be calculated separately for male and female (52). Because we focus on the common ML-based prognostic index between male and female in clinical practice, sex has been adjusted in the present model building. However, we separately calculated the risk scores for 5-year mortality using MARBE-PI in both men and women, and plotted the boxplots of the risk scores predicted. Supplementary Figure 4 has shown that the 5-year mortality risk for men was higher than that for women, indicating that women tended to live longer than men. Similar results are also shown in a previous study (53). So, in conclusion, our MARBE-PI can reflect sex differences in incidence of mortality.
Our study has 5 main strengths. First, in traditional laboratory data-based prognostic index construction, a deficit-based definition often leads to misclassification due to dichotomization within or beyond “normal” ranges and consequently may have loss of power in differentiating patients with mild, moderate, and advanced diseases (11). In MARBE-PI, the blood test results with continuous values can potentially reflect deficit severity more precisely. Removing the need for manual determination of normal value ranges also decreases the possibility of misclassification bias. Second, for traditional PIs, comprehensive geriatric assessments through structured questionnaire interviews and detailed physical assessments are usually needed for their construction (54). The measurement of some of these variables (eg, gait speed, Short Physical Performance Battery [SPPB], and quality of life) in a real-world clinical setting would be time-consuming and resource-intensive. In contrast, the laboratory tests used in our MARBE-PI are common items with great availability in most hospitals/clinics. For example, most of the included laboratory tests (eg, LDL, albumin, AST, lymphocyte, and creatinine) are included in the annual health exam for older adults sponsored by the Taiwanese National Health Insurance. Having no need for additional clinical evaluation would help promote MARBE-PI’s use in the busy clinical settings. Third, although the ML approach has been introduced and applied in laboratory medicine before (55), our MARBE-PI, based on the OR to evaluate the risk, made the explanation more understandable and acceptable, which would assist in translational and clinical research. For example, a 1 mg/dL increase in serum creatinine was associated with a statistically significant higher risk of 5-year mortality (OR = 1.51, 95% CI: 1.30–1.76; Table 3). To facilitate the bench-to-bedside clinical translation, we created a nomogram (Supplementary Figure 5) to diminish the information gap between physicians and patients, support clinical decision-making, and promote efficiency of health management. In addition, online tool of the MARBE-PI is in preparation. Fourth, the performances of the MARBE-PI for 5-year and projected 10-year mortality with 10-fold cross-validation and external validation showing excellent AUCs indicated the good accuracy and precision of the model.
Our study has 2 limitations. First, the results of this study could not provide a well-established theory- or hypothesis-driven framework due to the nature of ML approach. However, ML-identified laboratory items involved multisystem assessments including atherosclerotic status (LDL), cardiovascular function (hsCRP), nutritional status (albumin), hepatobiliary function (AST), immune function (lymphocyte), and renal function (creatinine). The comprehensive evaluation of MARBE-PI was consistent with the holistic approach in previous theory-driven PIs (2–8). In light of the need for precision medicine with individualized management, the study may pave the way for development of a system for estimating individualized health risk, triggering corresponding management action to prevent functional decline in community-dwelling older adults. Secondly, the MARBE-PI model for 5-year mortality was poorly calibrated for the Japanese population. However, after applying logistic calibration regression, the model demonstrated excellent calibration. Thus, our recalibrated model is recommended for future research in other populations.
Conclusions and Implication
The proposed ML-based PI had the potential to predict the 5-year and project the 10-year mortality risk. MARBE-PI, which was comparably accurate to MACHI-PI and combined PI, may be used to enable initial risk stratification for adverse health outcomes. Its use of common laboratory examinations makes possible for large-scale screening in older adults living in the community as outpatients. Because a PI based on electronic health record data has been used to identify vulnerable older adults in primary care (12), our MARBE-PI may be used to enable proactive interventions for this vulnerable group, using currently available and accessible data resources.
Funding
This work was supported by the National Health Research Institutes in Taiwan (grant numbers PH-108-SP-01 [PI: C.A.H.], PH-109-SP-01, PH-110-SP-01, and PH-111-SP-01), and the Ministry of Science and Technology of Taiwan (grant numbers 108-2319-B-400-001 [PI: C.A.H.], 108-2314-B-400-038 [PI: C.A.H.], 109-2740-B-400-002 [PI: C.A.H.], 109-2314-B-400-014 [PI: C.A.H.], 110-2740-B-400-002 [PI: C.A.H.], 110-2314-B-400-009 [PI: C.A.H.], and 111-2740-B-400-002 [PI: C.A.H.]).
Conflict of Interest
None.
Acknowledgments
The authors acknowledge HALST staff and all the subjects who participated in this work. The sponsors had no role in the design, methods, subject recruitment, data collection, analysis, or preparation of the paper.
Author Contributions
C.-H.H., C.-C.H., and C.A.H. designed this study. C.A.H., S.Z., I.-C.W., S.-C.C., H.-Y.C., W.-T.T., R.-C.W., Y.-T.L., L.-M.L., C.-C.J., C.T., C.-C.H., and C.A.H. collected and managed the data. C.-H.H., Y.-H.F., I.-C.W., Y.-F.T., and C.A.H. reviewed the literature. Y.-H.F., S.Z., and Y.-F.T. conducted the statistical analysis. C.-H.H., Y.-H.F., I.-C.W., S.-C.C., H.-Y.C., C.-C.H., and C.A.H. interpreted the data. C.-H.H., Y.-H.F., S.Z., and C.A.H. wrote the manuscript. C.-H.H., Y.-H.F., S.Z., I.-C.W., S.-C.C., H.-Y.C., Y.-T.L., L.-M.L., C.-C.J., C.T., R.O., H.A., C.-C.H., and C.A.H. reviewed and/or revised the manuscript. All authors read and approved the manuscript for submission and gave consent for publication.
References
Author notes
Chi-Hsien Huang and Yao-Hwei Fang contributed equally to the manuscript.
Rei Otsuka, Hidenori Arai, Chih-Cheng Hsu, and Chao Agnes Hsiung co-supervised this work.

