


Abstract
Several studies have reported the association between blood neurofilament light chain (NfL) levels and all-cause mortality. However, the generalizability of these findings in general adults remains unclear. The study aimed to examine the association between serum NfL and all-cause mortality in a nationally representative population.
Longitudinal data were obtained from 2 071 participants aged 20–75 years in the National Health and Nutrition Examination Survey 2013–14 cycle. Serum NfL levels were measured by using a novel, high-throughput acridinium-ester immunoassay. Kaplan–Meier curves, multivariate Cox regression analysis, and restricted cubic spline regression were employed to investigate the association between serum NfL and all-cause mortality.
Over a median follow-up of 73 (interquartile range = 12) months, 85 (3.50%) participants died. After adjustment for sociodemographic characteristics, lifestyle variables, comorbidity, body mass index, and estimated glomerular filtration rate, elevated serum NfL levels were still significantly associated with a higher risk of all-cause mortality (hazard ratio = 2.45, 95% confidence interval = 1.89–3.18 for per lnNfL increase) in a linear manner.
Our findings suggest that circulating levels of NfL may serve as a biomarker of mortality risk in a nationally representative population.
Introduction
Neurofilament light chain (NfL) is a subunit of neurofilaments (Nfs), which are specifically synthesized in neurons and highly expressed in axons. Nfs are critical for axon integrity and neuron stability as structural scaffolding proteins; thus, improper expression of intracellular Nfs may lead to motor neuropathology (1). In addition, as a result of neurodegenerative diseases and inflammatory and traumatic injury, Nfs are sharply released into the extracellular space following neuroaxonal damage, principally NfL (2). Owing to its enrichment and high solubility, NfL in cerebrospinal fluid (CSF) is considered a reliable biomarker to reflect axonal damage in various neurological diseases, including multiple sclerosis (MS), dementia, amyotrophic lateral sclerosis (ALS), and Parkinson’s disease (PD) (2). With axonal damage, blood NfL levels are approximately 2% of the CSF NfL levels, and both show great correlation (3), providing the possibility for blood NfL to become a noninvasive alternative. The extensive application potential of blood NfL as a biomarker in neurological disorders for diagnosis and treatment response has been reported before (4). Recently, an accumulating body of literature has reported the association between blood NfL and mortality risk among patients with ALS (5), spontaneous subarachnoid hemorrhage (6), stroke (7), parkinsonism (8), cerebral small vessel disease (9), and among community-dwelling middle-aged and older individuals (10–12). Notably, increased attention has been given to the contribution of blood NfL to mortality among nondemented older adult individuals (13), suggesting the value of blood NfL as a mirror of the underlying central nervous system (CNS) damage for predicting the long-term risk of mortality. However, owing to the limited number of participants with monoethnic backgrounds in previous studies, the generalizability of these associations in the general population remains unclear, especially when applied to expanded sample sizes, age ranges, ethnic diversity, and geography. In our study, we aimed to further examine the association between serum NfL and all-cause mortality among American adults recruited in the National Health and Nutrition Examination Survey (NHANES), a nationally representative survey of the noninstitutionalized civilian residents in the United States, by using a stratified, multistage, and probability sampling design.
Method
Study Population
Data were obtained from the NHANES 2013–14 cycle. NfL was only measured in a half-sample of participants aged 20–75 years old who consented to have surplus serum stored for future research. Therefore, the subsample of individuals with measured serum concentrations of NfL and mortality information (n = 2 701) was included in this study.
NFL Measurement
NfL was measured by using a novel, high throughput acridinium-ester (AE) immunoassay on the fully automated Atellica immunoassay system. Detailed information about the development and validation of the assay is described elsewhere (14). In brief, the sample was incubated with AE-labeled antibodies that bind to the NfL antigen, and then paramagnetic particles (PMPs) coated with capture antibody were added to the sample, forming antigen complexes bound to AE-labeled antibodies and PMPs. After separating and removing unbound AE-labeled antibodies, acid and base were added to initiate chemiluminescence, and light emission was measured. The analytical measurements were conducted following strict quality control/quality assurance procedures (15). The lower limit of quantification of the assay was 3.9 pg/mL, which was defined as the concentration at which the coefficient of variation was less than or equal to 20%, and the upper limit was 500 pg/mL. Compared to other established assays, AE immunoassays feature a number of advantages, including high quantum yields, rapid kinetics, hydrophilicity, hydrolytic stability, and small size.
Mortality Outcomes
Mortality information on vital status and survival time (in months) from the time of interview to death or the end of the follow-up (December 31, 2019) was available from the National Death Index, a centralized database compiled from state vital statistics offices.
Covariates
Sociodemographic characteristics (age, sex, race/ethnicity, marital status, education level, and family income), lifestyle variables (smoking status and physical activity [PA]), and disease information were self-reported via computer-assisted questionnaires. Except for race/ethnicity, other categorical variables were set as binary variables. Among them, PA status was defined as whether meeting the national PA guidelines, that is, at least 150 minutes a week of moderate intensity, 75 minutes a week of vigorous intensity, or an equivalent combination of aerobic PA. Comorbidity was defined as the presence of at least 1 self-reported disease, including hypercholesterolemia, hypertension, diabetes, congestive heart failure, coronary heart disease, angina, heart attack, and stroke. The estimated glomerular filtration rate (eGFR) was calculated using the creatinine equation of the Chronic Kidney Disease Epidemiology Collaboration (16).
Statistical Analysis
To obtain generalizable estimates for U.S. adults, sample weights, clustering, and stratification were incorporated in the main analyses according to NHANES analytic guidelines. Participants were divided into 3 groups based on quartiles of serum NfL concentrations (log-transformed). Weighted means ± standard deviations (SDs), weighted medians (interquartile ranges [IQRs]), and numbers (weighted percentages) were used to present the baseline characteristics of study participants. Kaplan–Meier survival curves for all-cause mortality were stratified by groups. Crude and multivariate-adjusted Cox proportional hazards models were used to estimate weighted hazard ratios (HRs) and 95% confidence intervals (CIs) for the association between serum NfL concentrations (continuous and categorical variables) and all-cause mortality. The linear trend was tested by treating the groups as ordinal. Multiple imputations were performed for covariates with missing values (education level, family income, smoking status, PA, and body mass index [BMI]), and Cox regression analyses for the preimputation data and subgroup analysis were considered as sensitivity analyses. Restricted cubic spline (RCS) regression with full covariate adjustment was used to examine the dose–response relationship. All statistical analyses were performed using R version 4.0.3 (R Foundation for Statistical Computing, Vienna, Austria). A 2-tailed p value of <.05 was considered significant.
Results
In analyses of the 2 071 individuals weighted to the general U.S. adult population, the median age was 45.7 (IQR = 25.0) years and 51.3% were women. Approximately 64.9% of the population was White, followed by Hispanic (15.3%), African American (12.00%), and others (7.70%). Detailed characteristics of the participants are shown in Supplementary Table 1. The weighted mean serum NfL concentration was 16.92 pg/mL (SD = 22.6). Over a median follow-up of 73 (IQR = 12) months, there were 85 (3.50%) all-cause deaths. Kaplan–Meier curves and crude Cox regression analysis showed that risks for all-cause mortality were the highest among individuals in the high NfL concentration group (Figure 1). After adjustment for age, sex, race/ethnicity, and additionally adjusted for marital status, education level, family income, smoking status, BMI, PA, eGFR, and comorbidity, serum NfL still remained significantly associated with all-cause mortality (HR = 2.45, 95% CI = 1.89–3.18 for per lnNfL increase, Table 1). Similar findings were repeated in Cox regression analysis of subgroup analysis (participants equal to or older than 50 years old, Table 1) and preimputation data (Supplementary Table 2). We used RCSs to flexibly model and visualize the relation between serum NfL and all-cause mortality, and identified a J-shaped association (Figure 2).
Weighted HR (95% CI) of serum NfL With All-Cause Mortality, U.S. Adults Aged 20–75, NHANES 2013–14
| Per 1-Unit Increase in lnNfL | NfL as Categorical Variable* | |||||
|---|---|---|---|---|---|---|
| Low | Median | High | p for Trend | |||
| All adults | Unweighted number of deaths/total | 85/2 071 | 1/500 | 38/1 031 | 46/540 | |
| Model 1 | 2.77 (2.00, 3.83) | 1.00 (Ref.) | 10.25 (1.76, 59.62) | 19.48 (2.87, 132.30) | <.0001 | |
| Model 2 | 2.45 (1.89, 3.18) | 1.00 (Ref.) | 9.03 (1.25, 65.30) | 13.73 (1.69, 111.55) | .0005 | |
| 20–49 years old adults | Unweighted number of deaths/total | 17/1 136 | 1/374 | 5/388 | 11/374 | |
| Model 1 | 2.46 (1.50, 4.04) | 1.00 (Ref.) | 4.63 (0.56, 38.60) | 6.63 (1.05, 41.74) | .0186 | |
| Model 2 | 2.26 (1.19, 4.29) | 1.00 (Ref.) | 6.32 (0.60, 66.45) | 5.57 (0.75, 41.36) | .0761 | |
| 50–75 years old adults | Unweighted number of deaths/total | 68/935 | 7/244 | 33/465 | 28/226 | |
| Model 1 | 2.78 (1.85, 4.19) | 1.00 (Ref.) | 2.82 (0.83, 9.58) | 7.57 (2.08, 9.58) | <.0001 | |
| Model 2 | 2.50 (1.86, 3.36) | 1.00 (Ref.) | 2.42 (0.76, 7.71) | 5.48 (1.83, 16.42) | <.0001 |
Notes: Model 1, adjusted for age, sex and race/ethnicity; Model 2, further adjusted for marital status, education level, family income, smoking status, body mass index, physical activity, eGFR and comorbidity. CI = confidence interval; HR = hazards ratio; lnNfL = log-transformed NfL; NfL = neurofilament light chain; NHANES = National Health and Nutrition Examination Survey.
*Given the high correlation between age and NfL, we grouped separately in the two stratas.
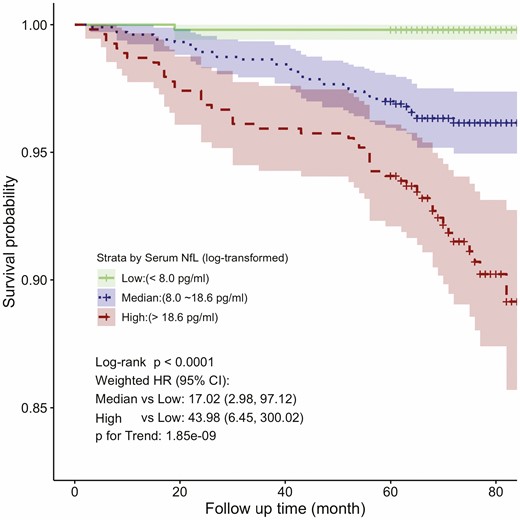
Kaplan–Meier all-cause survival estimates by serum neurofilament light chain (NfL) groups. CI = confidence interval; HR = hazards ratio.
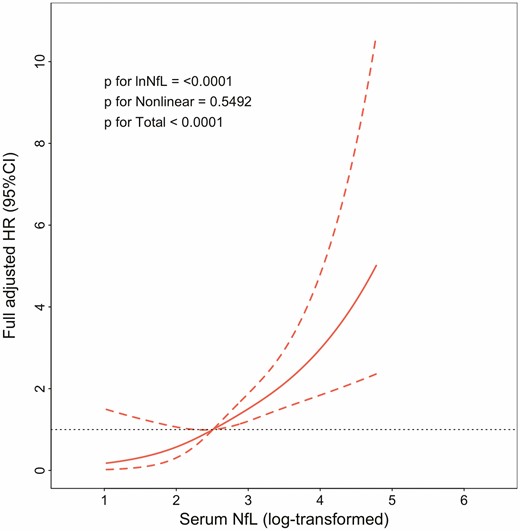
Dose–response association of serum neurofilament light chain (NfL) with risk of all-cause mortality. Solid line represents nonlinear dose–response and dotted lines represent 95% CI. Restricted cubic spline model was adjusted by age, sex and race/ethnicity, marital status, education level, family income, smoking status, body mass index, physical activity, estimated glomerular filtration rate, and comorbidity. CI = confidence interval; HR = hazards ratio.
Discussion
In this study, in a nationally representative population in NHANES, we found that increased serum NfL levels were associated with a higher risk of all-cause mortality in a linearly positive manner, especially among adults older than 49 years. A cohort study that included 294 African Americans (49–65 years of age) found higher all-cause mortality rates in groups with elevated serum NfL levels (12). Similar results were found in the cohort of the memory and morbidity in Augsburg Elderly (MEMO) study, which enrolled older adults from Augsburg (median age 73 years) (10). Another study that measured plasma NfL levels at 3 visits from 694 middle-aged urban White and African Americans showed similar findings (11). To our knowledge, this is the first study to examine the association between blood NfL and all-cause mortality in a nationally representative, ethnically diverse, and the largest sample of U.S. adults. In addition, we included several important covariates in the multivariate Cox regression models to ensure the robustness of our results, which was one of the major improvements from previous studies. One important variable was PA, which has been shown to have a positive influence on health in diverse aspects, and insufficient PA in daily life may be related to increased morbidity and mortality (17–19). The 2020 report of the Lancet Commission declared that engaging in frequent exercise contributes to reduced neuropathological damage and increases and maintains cognitive reserve, suggesting the close involvement of PA in CNS protection (20). Several reports have shown that PA, including aerobic exercise, anaerobic exercise, and the combination of both, diminishes blood NfL levels in MS patients (21,22). Moreover, Raffin and his colleagues also noted the benefit of PA on the reduction of blood NfL in healthy older adult individuals (23). Hence we adjusted the effect of PA in our models, considering the independent contribution of PA to life span as well as blood NfL levels and the varied benefits of PA on cognition under diverse blood NfL concentrations (24). In addition, a study based on the same data available in NHANES assessed the effects of demographics, lifestyle factors, and comorbidities on serum NfL levels among people without the neurologic disease, and found that eGFR was the second most significant contributor to serum NfL levels (15), suggesting a potential relationship between kidney function and the clearance of blood NfL. On the other hand, it is universally acknowledged that abnormal kidney function, including chronic kidney disease, albuminuria, and acute kidney injury, is associated with a higher risk of mortality. In light of the 2 aspects earlier (16), we particularly took into account the interference of eGFR on the Cox regression models. In addition, our finding that eGFR was inversely associated with serum NfL levels (Supplementary Table 1) was in agreement with those of previous studies (25); however, we were unable to determine how eGFR moderates the association between serum NfL and all-cause mortality in the present study.
Although the results of the current study were generated from an analysis of a representative sample of U.S. population, it had some limitations. The relatively short follow-up period resulted in such a small number of deaths that we were unable to carry out subgroup analyses to further identify those at high risk of death predicted by blood NfL levels. For the same reasons, details about disease-cause-specific mortality were unavailable; therefore, we could not evaluate the possible contribution of specific diseases to the relationship of serum NfL levels with mortality.
In conclusion, we validated the association between elevated serum NfL levels and higher all-cause mortality in a nationally representative sample of U.S. adults. Our findings suggest the potential of serum NfL levels in mortality prediction and individual health care intervention. Future research will focus on the mechanism for the association between circulating NfL levels and mortality.
Funding
This work was supported by the Guizhou Provincial People’s Hospital Talent Fund (grant number [2022]-15) and the National Key Research and Development Program of China (grant number 2018YFC2000200).
Conflict of Interest
None declared.
Author Contributions
K.W. designed the study, analyzed the data. X.T.C. and K.W. drafted the manuscript. K.W. critically revised the manuscript. K.W. and Y.L. provided the fund support. All authors approved the final submitted version.
References
Author notes
Yong Lin and Kai Wei contributed equally.

