


Abstract
The brainstem functions as a relay and integrative brain center and plays an essential role in motor function. Whether brainstem tissue deterioration, including demyelination, affects motor function has not been studied. Understanding the potential relationship between brainstem demyelination and motor function may be useful for the early diagnosis of neurodegenerative diseases and to understand age-related gait impairments that have no apparent cause. In this work, we investigated the associations between rapid or usual gait speeds, as integrative measures of motor function, and cerebral myelin content. In 118 individuals (age 22–94 years) free of neurodegenerative diseases or cognitive impairment, myelin content was assessed as the myelin water fraction, a direct magnetic resonance imaging measure of myelin content, and longitudinal and transverse relaxation rates (R1 and R2), which are sensitive magnetic resonance imaging measures of myelin content. Our results indicate that participants with lower usual or rapid gait speed exhibited lower values of myelin water fraction and R1 in the main brainstem regions, which were more evident and statistically significant in the midbrain. In contrast, we found no significant associations between gait speeds and R2, an expected result because various physiological factors confound R2. These original findings provide evidence that the level of brainstem myelination may affect gait performance among cognitively unimpaired adults who are free from any clinically detectable neurodegenerative diseases. Further studies are needed to understand the longitudinal changes in brainstem myelination with aging and neurodegenerative diseases, including Alzheimer’s disease and Parkinson’s disease.
Gait speed is a relatively simple yet effective measure of motor performance and is emerging as an early indicator of physical dysfunction, cognitive decline, disability, and dementias (1,2). Studies have revealed that abnormal gait speed is associated with significant changes in gray and white matter macro- and microstructure in various cerebral regions, including those responsible for initiating, sustaining, and coordinating mobility (3,4). It has recently been shown that lower cerebral myelination is associated with lower gait speeds in a cohort of cognitively unimpaired adults (5), adding further evidence of the potential implication and central role of myelin integrity in aging and neurodegeneration. However, the potential effect of changes in the brainstem microstructure and composition, including differences in myelin content, on gait speed has not been studied.
In addition to functioning as a relay and integrative brain center, the brainstem plays an important role in motor function, sensation, and alertness, and acts as an intermediary between the cerebrum and spinal cord (2,6,7). Multiple studies suggest significant brainstem involvement in the early development of Alzheimer’s disease and Parkinson’s disease with accompanying neuropsychiatric symptoms including disturbances in mood, emotion, appetite, and sleep, as well as confusion, agitation, and depression (8,9). Although the patterns of differences in brainstem microstructure and composition, including myelination and axonal integrity, with age have recently been documented and have revealed complex subregional trajectories (10,11), evidence of the potential implication of brainstem tissue integrity on gait speed impairment is lacking. It is increasingly established that the brainstem is involved in the initiation, cadence and control of locomotion and gait in animal models through its projections to the spinal cord (12,13). Hence, investigating the association between gait speed and brainstem microstructural integrity in humans could provide novel insights into the process of normative aging and development of age-related diseases, and could enable early detection of functional decline that could lead to more effective prevention and targeted treatments.
In recent work, using magnetic resonance imaging (MRI)-based morphometry, Blumen et al. showed that atrophy of the brainstem was associated with the decline in gait speed (2). Additionally, Sclocco et al. provided further discussion of the relationship between brainstem structural integrity, as measured using MRI, and motor functions (14). Using functional MRI, Wei et al. provided evidence of the role of the brainstem circuits in dual-task walking and walking automaticity (15). However, to our knowledge, the association between brainstem microstructural integrity and gait speed has not been established. The paucity of such studies is perhaps due to its complex anatomical structure and relative limited tissue contrast (14,16). Therefore, it is essential to use high spatial resolution imaging to minimize partial volume effects between gray and white matter as well as between different substructures.
The recent year has seen the development of a myriad of quantitative MRI (qMRI) methods for high spatial resolution mapping of relaxation times (17,18). These qMRI relaxometry techniques have been adopted in several clinical investigations of central nervous system (CNS) maturation and degeneration, including in complex CNS structures such as the spinal cord and the brainstem (10,11,17–20). Notwithstanding the importance of transverse and longitudinal relaxation times for providing valuable information regarding tissue microstructure, composition, and biochemistry, these qMRI metrics are not specific to any underlying determinant of central nervous system (CNS) tissue, such as myelin content, which hampers interpretation of results for targeted interventions. The limited sensitivity is partly due to the effect of parameters other than myelin content, including axonal density, fibers crossing and fanning, iron content, and proton density. Further, these metrics cannot be regarded as truly quantitative because changes in the amount of tissue composition, including myelin content, are not necessarily linearly associated with changes in these qMRI metrics. To overcome some of these limitations, advanced MR methods based on multicomponent relaxometry to map the myelin water fraction (MWF) have been introduced. MWF, a surrogate of myelin content, exhibits much greater specificity to myelin content and has been used in several studies of brain maturation and degeneration (21–23).
In the present work, we used the Bayesian Monte-Carlo analysis of multicomponent-driven equilibrium single pulse observation of T1 and T2 (BMC-mcDESPOT) method to estimate MWF from a large cohort of cognitively unimpaired participants (N = 118) spanning an extended and well-characterized age range between 22 and 94 years. BMC-mcDESPOT is an advanced multicomponent relaxometry approach that uniquely provides a high spatial resolution MWF map within clinically feasible acquisition time (23–25). BMC-mcDESPOT has extensively been used to investigate the patterns of cerebrum and brainstem myelination with aging and dementias (10,11,22,26). Further, assuming a mono-component system, we also measured longitudinal, R1, and transverse, R2, relaxation rates, which are sensitive measures of myelin content. R1 and R2 depend on water mobility as well as macromolecular tissue composition, especially lipids and iron, which are the main constituents of myelin (18,27). These metrics are calculated from the same MRI data used in the BMC-mcDESPOT modeling, without extra scan time, and incorporate MR sequences with very short echo times, which allow them to better detect the rapidly relaxing water pool signal corresponding to myelin water. Our main goal is to investigate the effect of brainstem myelination on differences in gait speed using these stabilized approaches to myelin quantification. Using our established protocol (5), both rapid and usual gait speeds (UGS) were measured and correlated to MWF, R1, or R2 after adjusting for relevant covariates. Finally, using principal component analysis (PCA) (28), we combined MWF, , and together to estimate multivariate joint features and used them to further establish the association between brainstem microstructural integrity and gait speeds. The goal of this analysis was to explore whether multivariate features could further improve identification of this potential association.
Materials and Methods
Subjects
After exclusion of 22 participants’ datasets with either missing data, severe motion artifacts on the MR images, or from participants with cognitive impairments, the final cohort consisted of 118 cognitively unimpaired volunteers (mean ± standard deviation (SD) MMSE = 28.8 ± 1.4) ranging in age from 22 to 94 years (55.4 ± 20.4 years). Of this final cohort, 54 (45.8%) were women, 82 (69.4%) were White, and 24 (20.3%) were Black. The mean ± SD values of body mass index (BMI) were 25.8 ± 3.6. The mean ± SD values of RGS and UGS were 1.85 ± 0.33 m/s and 1.24 ± 0.22 m/s, respectively (Table 1). All participants were recruited from the Baltimore Longitudinal Study of Aging (BLSA) and the Genetic and Epigenetic Signatures of Translational Aging Laboratory Testing (GESTALT) study (29,30). Both the BLSA and GESTALT are longitudinal studies on healthy individuals designed to investigate multiple biomarkers of aging. The inclusion and exclusion criteria for these 2 studies are virtually identical. Experimental procedures were performed in compliance with our local Institutional Review Board, and all subjects provided written informed consent.
Demographic Characteristics of Participants
| Total sample | N = 118 |
|---|---|
| Age (yrs.), mean ± SD (min–max) | 55.4 ± 20.4 (22–94) |
| Sex | |
| Male | 64 |
| Female | 54 |
| Race | |
| White | 82 |
| Black | 24 |
| Other | 12 |
| MMSE, mean ± SD (min–max) | 28.8 ± 1.4 (23–30) |
| BMI (kg/m2) mean ± SD (min–max) | 25.8 ± 3.6 (18.3–35.8) |
Notes: BMI = body mass index; max = maximum; min = minimum; MMSE = Mini-Mental State Examination; SD = standard deviation.
Data Acquisition
MR imaging
MRI scans for this study were collected using a 3T whole-body Philips MRI system (Achieva, Best, The Netherlands) using the internal quadrature body coil for transmission and an eight-channel phased-array head coil for reception. MWF, , and , were derived from each participant using the BMC-mcDESPOT protocol (11,23–25). This imaging protocol consists of 10 3D spoiled gradient recalled echo (SPGR) images acquired with flip angles (FAs) of [2 4 6 8 10 12 14 16 18 20]°, echo time (TE) of 1.37 ms, and repetition time (TR) of 5 ms, and ten 3D balanced steady-state free precession (bSSFP) images acquired with FAs of [2 7 11 16 24 32 40 60] °, TE of 2.8 ms, and TR of 5.8 ms. The bSSFP images we acquired with pulse phases of 0° or 180° to account for off-resonance effects (24,25,31). All the images were acquired with a voxel size of 1.6 mm × 1.6 mm × 1.6 mm. We further used the double-angle method (DAM), consisting of 2 fast spin-echo images acquired with FAs of 45° and 90°, TE of 102 ms, TR of 3000 ms, and acquisition voxel size of 2.6 mm × 2.6 mm × 4 mm, to correct for radiofrequency excitation inhomogeneity (32). All images were obtained with a field of view of 240 mm × 208 mm × 150 mm and reconstructed to a voxel size of 1 mm × 1 mm × 1 mm. We emphasize that all MRI studies and ancillary measurements were performed with the same MRI system, running the same pulse sequences, at the same facility and directed by the same investigators for both BLSA and GESTALT participants.
Gait speeds measurement
Participants were asked to perform 2 different gait movements, usual and rapid. The UGS was assessed by asking participants to walk at their “usual, comfortable pace” over a 6-meter course in an uncarpeted corridor. Participants stood with their feet behind a taped starting line and after a “go” command, timing was captured for each subject to finish the full distance. Two timed trials were conducted to derive the UGS in m/s, with the faster used for analysis (33). The rapid gait speed (RGS) was collected in a similar manner, although in this case the participants were asked to finish the course as quickly as possible, without running.
Image Processing
We used the FMRIB Library Software (FSL) to remove the scalp, ventricles, and other nonparenchymal regions within the acquired images for each subject (34). For each participant, we used the SPGR image, averaged over all FAs, as the input image. Then a whole-brain MWF map was generated for the extracted parenchymal regions using BMC-mcDESPOT (24,25). This emerging method offers rapid and reliable whole-brain MWF maps and has been used in assessing myelin loss in mild cognitive impairment and dementias, as well as examining factors influencing cerebral myelination in normative aging (5,10,11). BMC-mcDESPOT assumes a two-component nonexchanging system consisting of short and long T1 and T2 components. The short component corresponds to the signal of water trapped within the myelin sheets, while the long component corresponds to intra/extra-cellular water. Analysis was performed explicitly accounting for nonzero TE as incorporated into our TE-corrected-mcDESPOT signal model. Finally, the averaged SPGR image was nonlinearly registered to the MNI space (MNI152_T1_1 mm) using the FSL registration tools FLIRT and FNIRT (35,36). The computed transformation matrix was then applied to the MWF map using the applywarp function in FSL (34). Similarly, a whole-brain map was generated from the SPGR and DAM datasets using DESPOT1 assuming a single component, and a whole-brain map was generated from the bSSFP and DAM datasets using DESPOT2 assuming a single component (27). Finally, we selected four regions of interests (ROIs) within the brainstem corresponding to the midbrain, pons, medulla, and whole brainstem from the Talairach structural atlas provided in FSL. All ROIs were eroded to reduce partial volume effects and imperfect image registration using a kernel box of 2 voxels × 2 voxels × 2 voxels with the FSL tool fslmaths. The ROIs were further superimposed on the atlas and manually corrected, when needed, to avoid anatomic overlap with nearby brain regions. Within each ROI, the mean MWF, R1 and R2 values for each subject were calculated.
Statistical Analyses
Multiple linear regression models were used to assess the relationships between UGS or RGS and MWF, , or within each ROI. The UGS or RGS was used as the dependent variable while age, sex, race, MMSE, BMI, and MWF/ / as independent variables. The continuous variables were z-scored to enable better interpretability of the model. The initial model incorporated interaction between age and MWF/ / but was removed if found not to be significant. The resulting parsimonious model was then constructed without the nonsignificant interaction.
The MRI parameters of MWF, R1 and R2 are relatively correlated with each other. To test whether the shared variance between these MRI parameters contributes to RGS or UGS, we applied principal component analysis (PCA) to capture the correlated variation in these MRI parameters and to maximize the joint feature’s information. PCA is a statistical technique that decomposes the data into uncorrelated components. Each component is a weighted sum of initial features (here, MRI parameters). The first principal component (PC1) corresponding to the largest eigenvalue captures the highest amount of variance, while the second component is orthogonal to the first component and accounts for the second-largest amount of variance, and so on. PC1 was used here as our joint feature along with age, sex, race, MMSE, and BMI as independent variables to further investigate the association between brainstem microstructure and gait speeds.
For all analyses, p < .05 was defined as the threshold for statistical significance. Due to the exploratory nature of this study and concerns about type 2 errors, multiple comparisons correction was not conducted. All calculations were performed within MATLAB (MathWorks, Natick, MA).
Results
Figure 1A provides a summary of the regression results of MWF, R1 or R2, and UGS or RGS for the 4 investigated brainstem subregions after adjusting for age, sex, BMI, and race as relevant covariates. The results indicate that the UGS was significantly associated (p < .05) with MWF and R1 in all brainstem ROIs, namely, the midbrain (MB), pons (PN), medulla (MD), and whole brainstem (WBS), while this association was limited to the midbrain (MD) subregion for RGS versus MWF or R1, as presented in Figure 1B. Interestingly, no significant association between R2 and RGS or UGS was observed in any brainstem subregions investigated. Tables 2 and 3 contain the regression coefficients and p-values of all covariates used in the regression analysis for each of the 4 brainstem subregions. As expected, the effect of age was statistically significant and exhibited negative slopes across all brainstem subregions investigated (Tables 2 and 3), with RGS being more strongly associated with age compared with UGS. Further, the interaction between age and the MRI measures (age MWF/R1/R2) was tested and found to be not significant for all brainstem subregions investigated (Supplementary Material, Table 1). Finally, the effect of sex on gait speed was not significant as well (Tables 2 and 3).
Regression Coefficients and P-Values of the Regression Parameters and All ROIs Investigated
| ROIs | |||||||
|---|---|---|---|---|---|---|---|
| WBS | MB | PN | MD | ||||
| UGS | MWF | MRI | β | 0.21 | 0.23 | 0.18 | 0.22 |
| p | 0.01 | 0.01 | 0.04 | 0.01 | |||
| Age | β | −0.32 | –0.29 | –0.33 | –0.31 | ||
| p | 9.8E–04 | 3.1E–03 | 7.6E–04 | 1.0E–03 | |||
| Sex | β | 0.15 | 0.16 | 0.16 | 0.12 | ||
| p | 0.36 | 0.34 | 0.35 | 0.46 | |||
| MMSE | β | 0.17 | 0.15 | 0.17 | 0.17 | ||
| p | 0.06 | 0.09 | 0.07 | 0.06 | |||
| BMI | β | –0.25 | –0.23 | –0.26 | –0.25 | ||
| p | 0.002 | 0.005 | 0.001 | 0.003 | |||
| R1 | MRI | β | 0.18 | 0.17 | 0.18 | 0.17 | |
| p | 0.03 | 0.04 | 0.03 | 0.04 | |||
| Age | β | –0.37 | –0.34 | –0.38 | –0.35 | ||
| p | 9.4E–05 | 3.5E–04 | 5.9E–05 | 2.1E–04 | |||
| Sex | β | 0.17 | 0.15 | 0.17 | 0.13 | ||
| p | 0.31 | 0.38 | 0.32 | 0.43 | |||
| MMSE | β | 0.12 | 0.12 | 0.12 | 0.12 | ||
| p | 0.17 | 0.18 | 0.18 | 0.17 | |||
| BMI | β | –0.23 | –0.25 | –0.25 | –0.24 | ||
| p | 0.005 | 0.002 | 0.002 | 0.003 | |||
| R2 | MRI | β | 0.13 | 0.1 | 0.11 | 0.04 | |
| p | 0.13 | 0.31 | 0.19 | 0.64 | |||
| Age | β | –0.33 | –0.33 | –0.34 | –0.37 | ||
| p | 9.4E–04 | 2.0E–03 | 6.5E–04 | 2.2E–04 | |||
| Sex | β | 0.12 | 0.16 | 0.09 | 0.10 | ||
| p | 0.47 | 0.35 | 0.58 | 0.57 | |||
| MMSE | β | 0.14 | 0.15 | 0.16 | 0.14 | ||
| p | 0.11 | 0.11 | 0.09 | 0.13 | |||
| BMI | β | –0.25 | –0.27 | –0.26 | –0.26 | ||
| p | 0.002 | 0.001 | 0.002 | 0.002 | |||
Notes: The multiple regression model is given by: UGS ~ β0 + βage × age + βMRI × MRI + βBMI × BMI + βsex × sex + βrace × race + βMMSE × MMSE, where MRI corresponds to R1, R2, or MWF. Bold indicates statistical significance (P < .05). p = p-values; MB = mid brain; MD = medulla MWF = myelin water fraction; PN = pons; R1 = longitudinal relaxation rate; R2 = transverse relaxation rate; RGS = rapid gait speed; UGS = usual gait speed; WBS = whole brainstem = β = regression coefficient.
Regression Coefficients and p-Values of the Regression Parameters and for Each of the Four ROIs Investigated
| ROIs | |||||||
|---|---|---|---|---|---|---|---|
| WBS | MB | PN | MD | ||||
| RGS | MWF | MRI | Β | 0.13 | 0.19 | 0.11 | 0.12 |
| p | 0.11 | 0.03 | 0.17 | 0.14 | |||
| Age | Β | –0.54 | –0.51 | –0.54 | –0.54 | ||
| p | 2.9E–08 | 2.5E–07 | 2.5E–08 | 2.4E–08 | |||
| Sex | Β | 0.18 | 0.16 | 0.18 | 0.16 | ||
| p | 0.27 | 0.33 | 0.27 | 0.34 | |||
| MMSE | β | 0.01 | 0.01 | 0.02 | 0.01 | ||
| p | 0.59 | 0.69 | 0.59 | 0.60 | |||
| BMI | β | –0.09 | –0.11 | –0.10 | –0.10 | ||
| p | 0.15 | 0.25 | 0.13 | 0.16 | |||
| R1 | MRI | β | 0.15 | 0.16 | 0.11 | 0.15 | |
| p | 0.06 | 0.05 | 0.19 | 0.06 | |||
| Age | β | –0.57 | –0.54 | –0.58 | –0.56 | ||
| p | 1.8E–09 | 1.1E–08 | 1.4E–09 | 5.3E–09 | |||
| Sex | β | 0.18 | 0.17 | 0.17 | 0.15 | ||
| p | 0.26 | 0.29 | 0.31 | 0.35 | |||
| MMSE | β | 0.03 | 0.03 | 0.05 | 0.03 | ||
| p | 0.86 | 0.94 | 0.84 | 0.89 | |||
| BMI | β | –0.11 | –0.12 | –0.10 | –0.10 | ||
| p | 0.25 | 0.17 | 0.18 | 0.20 | |||
| R2 | MRI | β | 0.07 | 0.14 | 0.1 | 0.07 | |
| p | 0.38 | 0.12 | 0.21 | 0.4 | |||
| Age | β | –0.55 | –0.51 | –0.54 | –0.56 | ||
| p | 3.5E–08 | 1.2E–06 | 4E–08 | 1.4E–08 | |||
| Sex | β | 0.14 | 0.18 | 0.11 | 0.11 | ||
| p | 0.40 | 0.27 | 0.47 | 0.50 | |||
| MMSE | β | 0.03 | 0.03 | 0.05 | 0.03 | ||
| p | 0.72 | 0.72 | 0.60 | 0.72 | |||
| BMI | β | –0.11 | –0.12 | –0.10 | –0.10 | ||
| ps | 0.17 | 0.13 | 0.22 | 0.22 | |||
Notes: The multiple regression model is given by: RGS ~ β0 + βage × age + βMRI × MRI + βBMI × BMI + βsex × sex+ βrace × race + βMMSE × MMSE, where MRI corresponds to R1, R2, or MWF. Significant p-values (p < .05) are written in bold font. p = p-values; MB = mid brain; MD = medulla; MWF = myelin water fraction; PN = pons; R1 = longitudinal relaxation rate; R2 = transverse relaxation rate; RGS = rapid gait speed; UGS = usual gait speed; WBS = whole brainstem = β = regression coefficient.


(A) Regression results between gait speeds and MWF (left panel), (middle panel), or (right panel), where (A) represents summary graph plots of all 4 selected brainstem subregions and (B) represents scatter plots of the standardized RGS or UGS as a function of the MWF, R1, or R2, adjusted for sex, race, MMSE, and BMI, within the midbrain region. The multiple regression model used to generate these results is given by: RGS/UGS ~ β0 + βage × age + βMRI × MRI + βBMI × BMI + βsex × sex + βrace × race + βMMSE × MMSE, where MRI corresponds to R1, R2 or MWF. In (A), for each plot, red line indicates a significant association (p < .05) between gait speeds and MRI parameters, while green and blue lines indicate a close to significant .05 < p ≤ .1 and no significant (p > .1) associations, respectively. The regression coefficient βMRI is also presented for each result. (B) Regressions plots of the standardized RGS (top) or UGS (bottom) as a function of the standardized MWF (left panel), R1 (middle panel), or R2 (right panel), adjusted for age, sex, race, MMSE, and BMI, within the midbrain region. For each plot, the line of fit (blue solid line) and confidence intervals (red dashed lines) are displayed. The adjusted response function describes the relationship between the fitted response and MWF, R2 or R1 with the other predictors averaged out by averaging the fitted values over the data used in the fit. There is a positive correlation between all MR parameters and both RGS and UGS. MB = mid brain; MD = medulla MWF = myelin water fraction; PN = pons; R1 = longitudinal relaxation rate; R2 = transverse relaxation rate; RGS = rapid gait speed; UGS = usual gait speed; WBS = whole brainstem.
Figure 2A represents the cross-correlation plot between the MRI parameters, namely, MWF, R1, and R2, with values averaged across all 4 studied brainstem ROIs. As expected, all 3 MRI parameters exhibit some degree of cross-correlations, with MWF and being more correlated among all MRI parameter combinations. Based on this observation, we estimated the multivariate features that can preserve and maximize the use of the available shared information provided by these MRI parameters using PCA. We note that, because the MWF, and are correlated, the derived PCs will inherently preserve the information shared across these MRI parameters. Indeed, the component corresponding to the largest eigenvalue, on average, explained nearly 65% variation across all 4 brainstem subregions studied, as indicated in Figure 2B, representing the estimated PCs using the 3 MRI parameters jointly. As expected, given the strong correlation between MWF and R1, most of the information in the dominant PC (PC1) is provided by MWF and . Figure 2C represents the results of the association between the gait speeds and PC1 for all 4 ROI’s within the brainstem. UGS is significantly associated (p < .05) with PC1 in all brainstem subregions, while RGS exhibits a significant association in the midbrain subregion with close-to-significant associations (p < .1) in the other 3 subregions. While these results agree with the previous analysis (Figure 1), the use of joint multivariate features led to stronger and more significant associations with the gait speeds, as expected.
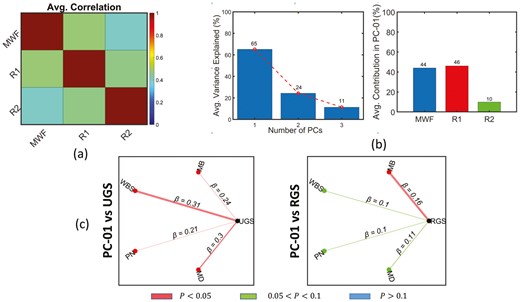
Correlation analysis between the gait speed measures and the MRI parameters using PCA-based features. (A) represents the average correlation among the MRI parameters across all four ROIs, (B) represents the percentage of average variance explained by each principal components (left graph) and the contribution of each MRI parameter to the dominant principal component (right graph) across ROIs, and (C) represents the graph plots of the regression results between gait speeds and the dominant principal component. The multiple regression model used to generate these results is given by: RGS/UGS ~ β0 + βage × age + βPC × PC + βBMI × BMI + βsex × sex + βrace × race + βMMSE × MMSE, where PC corresponds to the dominant principal component. In each plot, red indicates a significant association (p < .05) between gait speeds and MRI parameters, while, green and blue indicate a close to significant .05 < p ≤ .1 and no significant (p > .1) associations, respectively.
Discussion
Microstructural damage and concomitant changes in tissue composition, including demyelination, precede macrostructural changes by decades, and are now recognized as strong biomarkers of various neurodegenerative disorders (11,37,38). Demyelination halts nerve impulse transmission, resulting in various neurological conditions. Improper gait speed is also reported as a hallmark of declining health with aging and is often observed in individuals without overt clinical evidence of muscle, joint or neurodegenerative diseases (1,2,39). Several studies have investigated and reported strong associations between decline in microstructural tissue integrity, including demyelination, and improper gait speed (40–42). However, most of these studies were conducted on cohorts of cognitively impaired subjects while focusing on the cerebrum. There is, therefore, a lack of evidence that deterioration of brainstem tissue microstructure, specifically demyelination, may be an important cause of gait impairments in older persons and may not be associated with a specific neurodegenerative disease diagnosis. To fill this gap, in this cross-sectional advanced MRI study on 118 cognitively unimpaired subjects spanning an expanded age range between 22 and 94 years, we provide evidence of the association between brainstem microstructural integrity, as measured by MWF, R1, and R2, and gait speed. Specifically, we showed that the main brainstem substructures exhibit significant associations between their lower myelination and lower usual or rapid gait speeds, after adjusting for relevant confounders. To the best of our knowledge, this is the first study to investigate such relationship.
We identified significant, or close-to-significant, associations between MWF or R1 and gait speeds within all main brainstem subregions investigated, namely, the midbrain, pons, medulla, and whole brainstem. This association was strengthened after MR parameters fusion using PCA. This result was expected because these brainstem subregions are responsible for several fundamental physiological functions including eye movements, hearing, breathing, motor movement, and balance, which represent essential tasks for proper gait function. We note that this association was stronger and more significant in the midbrain substructure. Interestingly, the midbrain also exhibits a rapid decline of MWF and significant atrophy with aging (10,11,20,43), in contrast to other brainstem regions. We speculate that the strong association between the myelination status, gait speed, and age in the midbrain, the most superior of the main brainstem structures, is likely related to the fact that this structure contains large bundles of myelinated axons, such as the cerebral peduncle, while the medulla, in the inferior position, contains cell bodies of most of the cranial nerves in addition to gray matter nuclei with unmyelinated axons. Finally, the association between R2 and gait speed was not significant. Although not specific to myelin content, R1 and R2 are very sensitive to myelin and have been extensively used to study brain development and neuropathology (44,45). In fact, our correlation analysis indicates strong regional correlations between R1 and MWF, and to a lesser extent between R2 and MWF. This is expected because R1 is very sensitive to variations in lipid content, the main constituent of myelin, while R2 is sensitive to other tissue properties including hydration, macromolecular content, temperature, iron content, and flow, while being relatively less sensitive to lipids (18). Thus, in addition to changes in myelin content, interpretation of conventional MRI metrics is greatly confounded by their sensitivity to other structural changes, including changes in axonal density or axon caliber.
In previous work, in contrast to UGS, a stronger association between RGS and myelin content was observed in the cerebrum (5). This finding has been attributed to the higher cognitive and physiological demands placed on the brain during strenuous physical activities in RGS performance which necessitates greater cognitive control and neuronal activity as compared to less challenging physical activities and use of limited brain resources in UGS performance. Interestingly, in this current work, for the brainstem, a stronger and more significant correlation between UGS and myelin content as compared to RGS was observed. This likely reflects the structural and functional differences between the brainstem and the cerebrum. Indeed, the brainstem is primarily focused on integrating information for survival, proprioception, motion, and sensation, while the cerebrum integrates more complicated reactions to stimuli and processes information necessary for higher-level functions such as perception, thought, learning, and memory. Therefore, it is plausible that the myelination patterns between these functionally and developmentally different regions of the brain would be different. Indeed, the specialized process responsible for usual gait functions in healthy individuals is integrated early in life to allow stable yet flexible gait control. Indeed, the brainstem is the generator of “automatic gait,” involving minimal thinking, which is operationalized as “usual gait speed,” while max gait speed requires a volitional component that is provided by higher parts of the brain including the cortex. Studies performed by Suzuki et al. (46) and Meester et al. (47) suggested that steady-state walking at usual speeds does not significantly affect the prefrontal activation that requires substantial executive control resources, rather depends on the ability of the brainstem and spinal circuits to alter the rate of locomotor patterns. In contrast, numerous studies report significant increase in cerebrum activity during complex walking tasks or executing speed changes relative to the steady-state movement tasks (46,48,49). However, the association between RGS and myelination was nevertheless close-to-significance in all other brainstem subregions, so the possibility that our analysis was simply underpowered cannot be excluded. Further, our dataset is cross-sectional, so that the differential associations of RGS or UGS and myelin content observed here, and in previous work, require further validation through longitudinal studies. Such work, motivated by the present results, is underway.
Although we used advanced MRI methodology and a relatively large cohort of adult participants, our work comes with limitations. First, longitudinal assessments over prolonged periods are needed to further establish the association between gait speed impairment and deterioration in brainstem microstructure and composition. Indeed, both myelination and gait speeds are expected to change over time and have been investigated in previous studies (10, 11). Further, as with all MRI sequences, there are numerous experimental and physiological limitations that may impact the derived parameter values. Therefore, replication of our findings using other qMRI modalities is needed. Finally, although we have conducted a careful examination of all ROIs, a certain degree of partial volume bias is unavoidable in the calculated parameter values. This issue highlights the challenge of accurately segmenting brainstem substructures; this is mainly due to their small size as well as the relatively poor contrast between regions.
Conclusion
This original study provides evidence of the implication of the brainstem myelination on motor function indicating that loss of brainstem myelination is associated with age-related gait impairments among adults. This work lays the groundwork for further studies to shed light on the relationship between gait speed and myelination in aging and age-related neurodegenerative diseases.
Funding
This work was funded by the Intramural Research Program of the National Institute on Aging of the National Institutes of Health.
Conflict of Interest
None.
Author Contributions
M.B.: experimental design and MRI data acquisition. M.A.B.S.A., M.E.F., M.B.: data analysis, results interpretation, paper writing, and paper editing. M.A.B.S.A., M.E.F., J.P.L., Z.G.: data preprocessing, data processing, paper editing, results interpretation. J.B. and C.M.B.: MRI data acquisition, paper editing. S.C. and J.D.: gait speed measurements, paper editing. L.F.: paper editing, results interpretation.

