


Abstract
Sarcopenia is characterized by progressive loss of muscle mass and function due to aging. Retinol-binding protein 4 (RBP4) is an adipokine with pro-inflammatory effects. However, the change of RBP4 concentration and its role in sarcopenia remains unclear. The aim of this study was to evaluate the association of serum RBP4 level with sarcopenia in the older adults. A total of 816 community-dwelling older adults aged ≥60 years were enrolled. Serum RBP4 was measured by enzyme-linked immunosorbent assay. Appendicular skeletal muscle mass index (ASMI), grip strength, and gait speed were measured. We found that serum RBP4 levels were higher in patients with sarcopenia when compared with those without sarcopenias (44.3 [33.9–57.7] vs 38.0 [28.0–48.4] μg/mL). Receiver operating characteristic curve analysis indicated that the optimal cutoff value of serum RBP4 level that predicted sarcopenia was 38.79 μg/mL with a sensitivity of 67.8% and a specificity of 53.3%. Multivariate logistic regression analysis showed that the subjects with a higher level of RBP4 had a higher risk of sarcopenia (adjusted odds ratio [OR] = 2.036, 95% CI = 1.449–2.861). Serum RBP4 concentration was negatively correlated with grip strength (r = −.098), gait speed (r = −.186), and AMSI (r = −.096). Moreover, serum RBP4 levels were higher in patients with severe sarcopenia when compared with those with moderate sarcopenia (49.0 [37.3–61.2] vs 40.4 [31.3–51.2] μg/mL). Taken together, our results demonstrate that serum RBP4 level is correlated with the risk and severity of sarcopenia in the older adults, indicating that RBP4 might serve as a surrogate biomarker for the screening and evaluation of sarcopenia.
Sarcopenia is an age-related syndrome characterized by a degenerative loss of skeletal muscle mass, muscle strength, and/or physical performance (1). Studies have demonstrated that muscle mass decreases by 30%–50% between the age of 40 and 80 years, and the loss of muscle strength decreases from 20% to 40% between the age of 60 and 70 years (2). The consequences of these changes contribute to functional impairment and physical disability, leading to poor quality of life and increased health care costs for the old adults (3). The overall prevalence of sarcopenia among adults aged 50 years and older ranged from 1% to 29% in community-dwelling populations (4). In the Chinese population, the prevalence of sarcopenia ranges from 9.8% to 18.6% (5–7), with a higher prevalence rate in the rural region than in the urban region (5,6). Diagnosis of sarcopenia requires at least 2 of the parameters, including muscle mass, muscle strength, and physical performance; however, different cutoff points lead to difficulties in standardization in clinical practice. Although there have been a variety of tools being available for the assessment of sarcopenia, some of them are limited in clinical practice due to difficulties in access, relatively high costs, and lack of portable equipment (8). Over the past few years, considerable efforts have been made in searching potential blood biomarkers to aid the screening and diagnosis of sarcopenia (9); however, no sensitive and specific biomarker of sarcopenia has been identified. Considering sarcopenia has been demonstrated as a mortality predictor in the older adults (10), the emerging priority is to explore practicable biomarkers for the early identification of subjects at high risk for sarcopenia.
Sarcopenia is a complex disease that interacts with genetic and epigenetic factors (11). Numerous studies have demonstrated multiple pathophysiological processes that regulate the development of sarcopenia, such as neuro-muscular disorders (12), chronic muscular inflammation (13), imbalance in protein synthesis and degradation (11), impaired muscle regeneration (12), mitochondrial dysfunction (14), and energy metabolism disturbance (14), etc. However, the specific molecular mechanism of the onset of sarcopenia has not been well understood. Interestingly, with aging, adipose tissue also shows a pro-inflammatory profile through endocrine factors such as adipokines, indicating a cross-talk between adipose tissue and skeletal muscle in the pathogenesis of sarcopenia (15).
Retinol-binding protein 4 (RBP4) is an approximately 21-kDa secreted protein that mediates the transport of vitamin A (retinol) in circulation (16). RBP4 has been well known as an important adipokine that contributes to insulin resistance and obesity through its pro-inflammatory effect (17–19). It was reported that serum RBP4 increased with age (20,21), indicating a potential role of RBP4 in aging-related disorders. However, whether elevated RBP4 is correlated with the risk of sarcopenia remains unclear. Therefore, in this study, we performed a case–control study to investigate the association of serum RBP4 with sarcopenia in a Chinese population of community-dwelling older adults.
Methods and Materials
Study Participants
The study was based on the National Basic Public Health Project, which provides annual physical examinations for the older adults in China. Our study population consisted of the older adults aged ≥60 years from both rural and urban regions. The rural subjects were enrolled from Yuetang Medical Center in Yangzhou, Jiangsu Province, whereas the urban subjects were from Maigaoqiao Community Medical Center in Nanjing, Jiangsu Province, respectively. Participants with the following conditions were excluded: (a) unable to move independently or failure to maintain in supine position; (b) unable to complete the specified actions due to nervous system diseases or bone and joint diseases; (c) chronic cardiopulmonary insufficiency (unable to carry out normal daily activities; New York Heart Association heart failure was classified as grade III and IV or unable to withstand the 6-m walking test); (d) severe renal insufficiency (creatinine clearance rate <60 mL/min) or severe liver damage (transaminase increased more than 2 times); (e) malignant tumor; and (f) mental disorders and senile dementia. This study was performed in accordance with the principles outlined in the Declaration of Helsinki (22) and approved by the Ethics Committee of Sir Run Run Hospital, Nanjing Medical University (approval number 2019-SR-S041). Written informed consent was obtained from each participant.
Data Collection
Body mass index (BMI) was calculated by dividing weight by height squared. For blood and biochemical parameters, a venous blood sample was collected in the early morning after an overnight fasting and separated into serum and cellular fractions within 2 hours. The serum was stored at −80°C before further analysis. Fasting blood glucose (FBG), alanine transaminase (ALT), aspartate aminotransferase (AST), total bilirubin (TBil), serum creatinine (SCr), blood urea nitrogen (BUN), total cholesterol (TC), triglyceride (TG), low-density lipoprotein-cholesterol (LDL-C), high-density lipoprotein-cholesterol (HDL-C) were measured. The estimated glomerular filtration rate (eGFR) was calculated using the simplified Modification of Diet in Renal Disease formula. Current smokers were defined as those who smoked more than 1 cigarette per day during the previous 12 months. Participants who drank alcohol at least once per day during the last 12 months were classified as current drinkers.
Assessment of Sarcopenia
Sarcopenia was diagnosed according to the latest criteria of the Asian Working Group for Sarcopenia 2019 (23). Muscle mass was measured by bioelectrical impedance analysis (BIA) using Inbody S10 (Inbody, Seoul, Korea). Appendicular skeletal muscle mass (ASM) was calculated as the sum of skeletal muscle in the arms and legs. The height-adjusted appendicular skeletal muscle mass index (ASMI) was defined as ASM divided by height squared in meters (ASM/height2). Low muscle mass was defined as an ASMI of less than 7.0 kg/m2 in men and 5.7 kg/m2 in women (23). Muscle strength was assessed by grip strength and measured using a dynamometer (CAMRY EH101, Zhongshan, China). In the standing position, the left and right handgrip strength were measured 3 times, and the maximum value was taken. Low handgrip strength was defined as <28 kg in men and <18 kg in women (23). Usual gait speed on a 6-m course was used as an objective measure of physical performance, and a slow walking speed was defined as a walking speed less than 1 m/s (23). The test was measured 3 times, and the average value was calculated.
Serum RBP4 Measurements
Serum RBP4 levels were assayed in duplicate by using a sandwich enzyme-linked immunosorbent assay kit (Elabscience, Wuhan, China) according to the manufacturer’s protocol. The intra-assay and inter-assay coefficients of variance were 5.22% and 4.95%, respectively. The analytic sensitivity of the assays was 0.94 ng/mL.
Statistical Analysis
Normality of distribution was assessed using Kolmogorov–Smirnov test. Continuous variables were described as median (interquartile range). Mann–Whitney U test was used to determine the differences between 2 groups. Pearson χ2 test was used to compare qualitative variables represented as frequencies. Receiver operating characteristic (ROC) curve analysis was used to determine the optimum cutoff level of serum RBP4 level best-predicting sarcopenia according to the criteria described previously (24). The area under the ROC curve (AUC) was measured, and an AUC of 0.5 suggests no discrimination, 0.7–0.8 is considered acceptable, 0.8–0.9 is considered excellent, and more than 0.9 is considered outstanding (24). The correlations between serum RBP4 level and other variables were calculated using Spearman correlation coefficient and partial correlation coefficient adjusted for age, sex, smoking, alcohol intake, BMI, eGFR, FBG, TC, TG, LDL-C, and HDL-C, as appropriate. Univariate analysis and multivariate logistic regression analysis were taken to determine the variables that independently contributed to the presence of sarcopenia. Odds ratios (ORs) and 95% confidence intervals (CIs) were calculated. Considering the level of RBP4, which has been identified as a biomarker of obese and diabetes, varies among different ages and sexes (25), stratified analyses were further conducted according to age, sex, diabetes, and BMI. A 2-sided p < .05 was considered to be statistically significant. All analyses were performed using SPSS 28.0 (IBM, Chicago, IL).
Results
Characteristics of the Study Participants
A total of 816 older adults were enrolled in this study, with 611 from the rural area and 205 from the urban area. There were 377 and 122 patients with sarcopenia in the rural and urban populations, respectively (Supplementary Table 1). As shown in Table 1, sarcopenia patients were older and thinner, had more males and smokers, and had lower levels of ALT, TBil, and TG but higher HDL-C level when compared with the non-sarcopenia subjects. As expected, the levels of grip, gait speed, and ASMI were all lower in patients with sarcopenia (p < .001). There was no significant difference of serum RBP4 levels between rural and urban population (41.6 [32.1–53.7] μg/mL vs 42.3 [32.1–54.5] μg/mL, p = .665). Serum RBP4 levels were higher in patients with sarcopenia when compared with those without sarcopenias (44.3 [33.9–57.7] μg/mL vs 38.0 [28.0–48.4] μg/mL, p < .001). Specifically, serum RBP4 levels were higher both in rural (43.7 [34.5–57.5] μg/mL vs 37.8 [27.2–48.7] μg/mL, p < .001) and urban (45.8 [32.1–58.2] μg/mL vs 38.5 [32.1–58.2] μg/mL, p = .042) sarcopenia subjects (Supplementary Table 1).
The Characteristics of the Enrolled Subjects
| Variables | Non-sarcopenia (n = 317) | Sarcopenia (n = 499) | p |
|---|---|---|---|
| Age, years | 73.0 (71.0–77.0) | 76.0 (70.0–81.0) | <.001 |
| Male, n (%) | 155 (48.9) | 295 (59.1) | .004 |
| BMI, kg/m2 | 25.1 (23.1–27.1) | 21.8 (19.8–23.7) | <.001 |
| Smokers, n (%) | 66 (20.8) | 136 (27.3) | .038 |
| Drinkers, n (%) | 50 (15.8) | 89 (17.8) | .445 |
| Hypertension, n (%) | 158 (49.8) | 236 (47.3) | .478 |
| Diabetes, n (%) | 46 (14.5) | 91 (18.2) | .165 |
| FBG, mmol/L | 5.45 (5.11–5.97) | 5.44 (5.10–6.07) | .925 |
| ALT, U/L | 16.2 (12.5–22.7) | 13.6 (10.1–13.6) | <.001 |
| AST, U/L | 23.0 (19.0–27.6) | 22.0 (18.5–27.0) | .107 |
| TBil, μmol/L | 13.2 (10.6–16.8) | 12.2 (9.3–15.8) | .001 |
| SCr, μmol/L | 60.1 (47.9–75.8) | 63.0 (47.8–77.6) | .131 |
| eGFR, mL/min | 89.9 (80.9–97.7) | 88.8 (76.9–100.0) | .245 |
| BUN, mmol/L | 5.37 (4.51–6.16) | 5.40 (4.49–6.70) | .057 |
| TC, mmol/L | 4.79 (4.23–5.31) | 4.82 (4.24–5.39) | .588 |
| TG, mmol/L | 1.41 (1.04–1.91) | 1.15 (0.90–1.56) | <.001 |
| LDL-C, mmol/L | 2.23 (1.75–2.60) | 2.18 (1.74–2.68) | .797 |
| HDL-C, mmol/L | 1.40 (1.22–1.59) | 1.53 (1.26–1.77) | <.001 |
| RBP4, μg/mL | 38.0 (28.0–48.4) | 44.3 (33.9–57.7) | <.001 |
| Grip, kg | 28.0 (22.5–33.1) | 17.9 (15.4–24.4) | <.001 |
| Gait speed, m/s | 1.1 (1.0–1.2) | 1.0 (0.8–1.1) | <.001 |
| ASMI, kg/m2 | 7.10 (6.30–7.60) | 5.70 (5.30–6.50) | <.001 |
Note: ALT = alanine transaminase; ASMI = appendicular skeletal muscle mass index; AST = aspartate aminotransferase; BMI = body mass index; BUN = blood urea nitrogen; eGFR = estimated glomerular filtration rate; FBG = fasting blood glucose; HDL-C = high-density lipoprotein cholesterol; LDL-C = low-density lipoprotein cholesterol; RBP4 = retinol binding protein 4; SCr = serum creatinine; TBil = total bilirubin; TC = total cholesterol; TG = triglyceride.
Association of Serum RBP4 with Clinical Parameters
We next investigated the relationship of serum RBP4 levels with clinical parameters (Supplementary Table 2). Serum RBP4 levels were positively associated with age (r = .110, p = .002), but negatively associated with BMI (r = −.084, p = .017). The correlations remained statistically significant (for age, r = .093, p = .008; for BMI, r = −.126, p < .001, respectively) even after adjustments for age, sex, smoking, alcohol intake, BMI, FBG, eGFR, FBG, TC, TG, LDL-C, and HDL-C, as appropriate.
Association of Serum RBP4 with the Risk of Sarcopenia
To analyze the association of RBP4 with the risk of sarcopenia, we first investigated the correlation between clinical variables and the components of sarcopenia. As given in Table 2, besides the conventional risk factors age and BMI, only serum RBP4 level was negatively correlated with all of the components, including grip strength, gait speed, and ASMI. Univariate logistic regression analyses indicated that age, male, smoking, low BMI, low ALT, high BUN, low TG, high HDL-C, and high RBP4 were correlated with increased risk of sarcopenia (Supplementary Table 3). As shown in Figure 1, ROC curve analysis indicated that the optimal cutoff value of serum RBP4 level that predicted sarcopenia was 38.79 μg/mL with a sensitivity of 67.8% and a specificity of 53.3% (AUC = 0.617, 95% CI = 0.577–0.656, p < .001). Univariate and multivariate logistic regression analyses showed that higher serum RBP4 level (>38.79 μg/mL) was significantly associated with increased risk of sarcopenia both before and after adjustment for potential confounders including age, sex, BMI, smoking, ALT, BUN, TG, and HDL-C (Table 3). Similar results were observed when using serum RBP4 concentration as a continuous variable (Table 3).
Spearman’s Correlation of Clinical Variables with the Components of Sarcopenia
| Variables | Grip Strength | Gait Speed | ASMI | |||
|---|---|---|---|---|---|---|
| (n = 816) | r | p | r | p | r | p |
| Age | −.143 | <.001 | −.376 | <.001 | −.114 | .001 |
| BMI | .246 | <.001 | .120 | .001 | .450 | <.001 |
| FBG | −.070 | .045 | −.072 | .039 | −.011 | .750 |
| ALT | .226 | <.001 | .185 | <.001 | .230 | <.001 |
| AST | .093 | .008 | .132 | <.001 | .049 | .161 |
| TBil | .200 | <.001 | .111 | .001 | .196 | <.001 |
| Scr | .149 | <.001 | −.011 | .755 | .178 | <.001 |
| eGFR | .067 | .054 | .145 | <.001 | .023 | .505 |
| BUN | −.026 | .451 | −.040 | .255 | −.005 | .895 |
| TC | −.118 | .001 | .002 | .962 | −.131 | <.001 |
| TG | −.073 | .037 | .026 | .466 | −.010 | .769 |
| LDL-C | −.090 | .010 | −.004 | .902 | −.055 | .115 |
| HDL-C | −.049 | .161 | .014 | .682 | −.118 | .001 |
| RBP4 | −.098 | .005 | −.186 | <.001 | −.096 | .006 |
Note: ALT = alanine transaminase; ASMI = appendicular skeletal muscle mass index; AST = aspartate aminotransferase; BMI = body mass index; BUN = blood urea nitrogen; eGFR = estimated glomerular filtration rate; FBG = fasting blood glucose; HDL-C = high-density lipoprotein cholesterol; LDL-C = low-density lipoprotein cholesterol; RBP4 = retinol binding protein 4; SCr = serum creatinine; TBil = total bilirubin; TC = total cholesterol; TG = triglyceride.
Associations of Serum RBP4 with the Risk of Sarcopenia
| Continuous | Categorical | |||||
|---|---|---|---|---|---|---|
| β | OR (95% CI) | p | β | OR (95% CI) | p | |
| Crude model | 0.026 | 1.026 (1.017–1.035) | <.001 | 0.749 | 2.114 (1.586–2.818) | <.001 |
| Adjusted model | 0.023 | 1.023 (1.013–1.034) | <.001 | 0.711 | 2.036 (1.449–2.861) | <.001 |
| Continuous | Categorical | |||||
|---|---|---|---|---|---|---|
| β | OR (95% CI) | p | β | OR (95% CI) | p | |
| Crude model | 0.026 | 1.026 (1.017–1.035) | <.001 | 0.749 | 2.114 (1.586–2.818) | <.001 |
| Adjusted model | 0.023 | 1.023 (1.013–1.034) | <.001 | 0.711 | 2.036 (1.449–2.861) | <.001 |
Notes: The adjusted model included age, sex, BMI, smoking, ALT, Scr, BUN, TG, and HDL-C.
ALT = alanine transaminase; BMI = body mass index; BUN = blood urea nitrogen; CI = confidence interval; HDL-C = high-density lipoprotein cholesterol; OR = odds ratio; RBP4 = retinol binding protein 4; SCr = serum creatinine; TG = triglyceride.
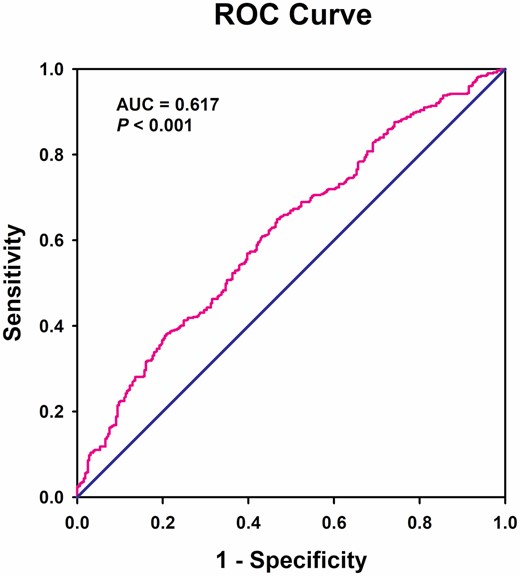
Receiver operating characteristic curves for the diagnostic accuracy of RBP4 for sarcopenia (n = 816).
Stratification Analyses for the Association of Serum RBP4 with the Risk of Sarcopenia
Stratified analyses were further conducted according to age, sex, diabetes, and BMI (Table 4). Serum RBP4 levels were higher in the subjects older than 80 years (44.6 [34.5–57.2] μg/mL vs 41.0 [31.9–53.2] μg/mL, p = .017). After adjustment for potential confounders, higher serum RBP4 level was correlated with increased risk of sarcopenia only in the old adults younger than 80 years (adjusted OR = 2.200, 95% CI = 1.493–3.241, p < .001). In addition, the levels of serum RBP4 were also similar between men and women in our study (42.4 [32.5–56.8] μg/mL vs 41.2 [31.8–52.3] μg/mL, p = .176). High serum RBP4 level was associated with higher risk of sarcopenia after adjustment for potential confounders only in women (adjusted OR = 2.959, 95% CI = 1.791–4.890, p < .001) but not in men. Moreover, no difference of serum RBP4 was observed between diabetic and non-diabetic subjects (42.2 [33.5–54.5] μg/mL vs 41.8 [31.9–53.9] μg/mL, p = .355). Similarly, the association of higher serum RBP4 level with higher risk of sarcopenia was only observed in the old adults without diabetes (adjusted OR = 2.294, 95% CI = 1.570–3.351, p < .001). Finally, we did not find any difference of serum RBP4 levels between lean (BMI <24.0 kg/m2) and obese old adults (BMI ≥ 24.0 kg/m2) either in non-sarcopenic subjects (38.9 [31.0–52.6] μg/mL vs 37.8 [27.5–47.8] μg/mL, p = .196) or in patients with sarcopenia (44.3 [33.8–57.9] μg/mL vs 45.7 [34.5–56.8] μg/mL, p = .995; Supplementary Figure 1). However, the association of higher RBP4 levels with increased risk of sarcopenia remained significance both in the obese (adjusted OR = 2.281, 95% CI = 1.348–3.859, p = .002) and lean (adjusted OR = 1.886, 95% CI = 1.226–2.901, p = .004) old adults.
Stratification Analyses for the Association of Serum RBP4 with the Risk of Sarcopenia
| Continuous | Categorical | |||||||
|---|---|---|---|---|---|---|---|---|
| Variables | Crude OR (95% CI) | p | Adjusted OR (95% CI) | p | Crude OR (95% CI) | p | Adjusted OR (95% CI) | p |
| Age | ||||||||
| <80 (n = 616) | 1.026 (1.016–1.037) | <.001 | 1.029* (1.016–1.042) | <.001 | 1.971 (1.426–2.726) | <.001 | 2.200* (1.493–3.241) | <.001 |
| ≥80 (n = 200) | 1.020 (1.000–1.040) | .046 | 1.011* (0.990–1.034) | .845 | 2.378 (1.231–4.594) | .010 | 2.005* (0.935–4.298) | .074 |
| Sex | ||||||||
| Male (n = 450) | 1.013 (1.002–1.025) | .017 | 1.010† (0.996–1.024) | .144 | 1.613 (1.089–2.389) | .017 | 1.420† (0.875–2.303) | .156 |
| Female (n = 366) | 1.046 (1.029–1.062) | <.001 | 1.043† (1.025–1.062) | <.001 | 2.941 (1.914–4.522) | <.001 | 2.959† (1.791–4.890) | <.001 |
| Diabetes | ||||||||
| With (n = 147) | 1.021 (1.000–1.044) | .055 | 1.012‡ (0.987–1.036) | .354 | 1.175 (0.573–2.411) | .660 | 1.116‡ (0.500–2.716) | .723 |
| Without (n = 679) | 1.027 (1.017–1.037) | <.001 | 1.026‡ (1.014–1.038) | <.001 | 2.364 (1.725–3.238) | <.001 | 2.294‡ (1.570–3.351) | <.001 |
| BMI | ||||||||
| <24.0 (n = 512) | 1.018 (1.006–1.031) | .004 | 1.017§ (1.004–1.030) | .010 | 1.861 (1.231–2.815) | .003 | 1.886§ (1.226–2.901) | .004 |
| ≥24.0 (n = 304) | 1.032 (1.016–1.049) | <.001 | 1.126§ (1.069–1.186) | <.001 | 2.249 (1.384–3.655) | .001 | 2.281§ (1.348–3.859) | .002 |
Notes: ALT = alanine transaminase; BMI = body mass index; BUN = blood urea nitrogen; CI = confidence interval; HDL-C = high-density lipoprotein cholesterol; OR = odds ratio; TG = triglyceride; RBP4 = retinol binding protein 4; SCr = serum creatinine.
*The adjusted model included sex, BMI, smoking, ALT, Scr, BUN, TG, and HDL-C.
†The adjusted model included age, BMI, smoking, ALT, Scr, BUN, TG, and HDL-C.
‡The adjusted model included age, sex, BMI, smoking, ALT, Scr, BUN, TG, and HDL-C.
§The adjusted model included age, sex, smoking, ALT, Scr, BUN, TG, and HDL-C.
Association of Serum RBP4 with the Severity of Sarcopenia
To investigate the association of serum RBP4 level with the severity of sarcopenia, we first analyzed the correlation of serum RBP4 to the components of sarcopenia. As shown in Figure 2, serum RBP4 concentration was negatively correlated with grip strength (r = −.098, p = .005), gait speed (r = −.186, p < .001), and AMSI (r = −.096, p = .006). When low muscle strength, low muscle quantity, and low physical performance are all detected, sarcopenia is considered severe (23). Our results showed that serum RBP4 levels were significantly higher in patients with severe sarcopenia when compared with those with moderate sarcopenia (49.0 [37.3–61.2] μg/mL vs 40.4 [31.3–51.2] μg/mL, p < .001; Figure 2D).

Association of RBP4 with the severity of sarcopenia. Spearman correlation coefficient (n = 816) was used to analyze the correlation between serum RBP4 levels and grip strength (A), gait speed (B), and ASMI (C). n = 816. Serum RBP4 levels in patients with sarcopenia (n = 237) and severe sarcopenia (n = 262) (D). *p < .001. ASMI = appendicular skeletal muscle mass index.
Discussion
To our knowledge, this is the first study that investigated the association of RBP4 with sarcopenia. The main finding of our study is that serum RBP4, a well-known adipokine that promotes insulin resistance, was associated with sarcopenia in the older adults. Among 816 community-dwelling older adults enrolled in our study, subjects with higher levels of serum RBP4 (>38.79 μg/mL) had more than 2-fold risk of sarcopenia when compared with those with lower RBP4 levels. Another interesting finding is that a higher RBP4 level was also associated with the increased severity of sarcopenia in the present study. Our results indicate that serum RBP4 might serve as a surrogate biomarker for the screening and evaluation of sarcopenia in the older adults.
To date, sarcopenia has now been considered as a syndrome of muscle disorders associated with low muscle quantity and quality. Although research findings over the last decade have provided a variety of methods to determine these parameters of muscle, some cutoff points are arbitrary and varied among different consensuses (26). The development of accessible biomarkers might be an easy and cost-effective way to screen and diagnose people with sarcopenia. Recently, several circulating factors have been proposed as possible biomarkers for sarcopenia, such as interleukin-6 (IL-6), growth differentiation factor-15 (GDF-15), fibroblast growth factor-21 (FGF-21), myostatin, etc. (27). However, to date, blood biomarkers of sarcopenia are not yet available in clinical practice. A recent study reported that high serum AST/ALT ratio was associated with an increased prevalence of sarcopenia (28), which is consistent with our results showing that the serum ALT level was decreased in patients with sarcopenia. Clinically, a high ALT or AST value predominantly reflects liver damage; however, high AST accompanied by low ALT has also been related to skeletal muscle injury (29). Further studies are needed to investigate whether AST/ALT ratio might be served as a predictor for the presence of sarcopenia. Importantly, we here showed that, despite relatively low sensitive and specificity, using 38.79 μg/mL as cutoff value of serum RBP4 levels could help to diagnose sarcopenia in the older adults. A higher RBP4 level was correlated with an increased risk of sarcopenia in the older adults. Moreover, serum RBP4 levels were positively correlated with the severity of sarcopenia, which was quantified by decreased grip strength, gait speed, and ASMI. Our results are consistent with a recent study showing that higher serum RBP4 level was associated with the incidence of frailty, a major etiologic factor for sarcopenia (30). Considering that muscle mass as a surrogate parameter of muscle health is less favorable than muscle quality (26), the correlation of high RBP4 level with low grip strength and gait speed may therefore suggest a predictive role of RBP4 level in muscle dysfunction. Further larger-scale longitudinal studies are needed to validate these initial findings and determine whether serum RBP4 could be used for early diagnosis of sarcopenia.
Our stratified analyses showed that the predictive effect of serum RBP4 on the presence of sarcopenia was prominent among females. Previous studies have reported that circulating RBP4 concentration varies by sex (31–33). Interestingly, there is also sexual dimorphism in the prevalence of sarcopenia, with a lower prevalence in the females (34,35). We therefore hypothesized that the observed sexually dimorphic association of higher RBP4 level with sarcopenia may be caused by the regulation of sex hormones. In addition, serum RBP4 level was reported to be higher in subjects of older age (20). We here also found that serum RBP4 level was positively correlated with age even after adjustments for potential confounders. The association of higher level of serum RBP4 with the risk of sarcopenia was only significant in the old adults younger than 80 years, suggesting a potential U-shaped relationship between serum RBP4 levels and the risk of sarcopenia in the old adults. This phenomenon may possibly attribute to the declined renal function in the older subjects (80.1 [62.9–96.5) vs 92.2 [84.7–100.7] mL/min), since eGFR has been identified as an independent determinants of elevated serum RBP4 level (36). Another potential explanation may be related to thyroid dysfunction as circulating RBP4 level was higher in patients with subclinical and overt hypothyroidism (37–39). Plenty of evidence has linked elevated RBP4 level to metabolic disorders especially diabetes (40), which has been identified as one of the major risk factors for sarcopenia (41). However, the role of RBP4 in sarcopenia might be independent of diabetes, since no correlation of elevated serum RBP4 with sarcopenia was observed in the older adults with diabetes.
The pro-inflammatory effect of RBP4 may be the underlying mechanism for the relationship between RBP4 and sarcopenia. Chronic inflammation associated with aging has been identified as a key factor in the pathogenesis of sarcopenia through impairing the regenerative capacity of muscle stem cells and disrupting the homeostatic balance between muscular protein synthesis and catabolism loss (13). RBP4 activates both CD4-positive T cells and macrophages through TLR4- and JNK-dependent pathways, leading to increased secretion of inflammatory factors such as IL-1β, IL-6, and tumor necrosis factor α (17,19,42). We have previously demonstrated that RBP4 can exacerbate cardiac injury via inducing inflammation and pyroptosis in cardiomyocytes (43,44). As an adipokine, increased secretion of RBP4 impairs the glucose uptake of skeletal muscle which in turn causing insulin resistance (45,46). Whether elevated circulating RBP4 could induce skeletal muscle atrophy via its pro-inflammatory effect will be interesting to dissect. In fact, the dysfunction of skeletal muscle also induces a chronic inflammatory response, which subsequently reduces the function of skeletal muscle, forming a vicious cycle (13). Interestingly, muscle-specific over-expression of RBP4 contributed to the increased blood RBP4 concentration in RBP4-deficient mice, suggesting that RBP4 may be a novel myokine that can regulate skeletal muscle function (47). Moreover, we still cannot rule out the possibility that RBP4 might have detrimental effects on skeletal muscle cell in situ, because the expression of RBP4 was also detected in skeletal muscle (48,49). Further in-depth investigation is required to elucidate the precise mechanism governing the pathological effect of RBP4 on the development of sarcopenia.
Study Limitations
First, although our study population were enrolled from different communities in rural and urban area, it was hard to exclude the possibility of selection and causality bias as a result of the cross-sectional nature. Thus, further prospective cohort studies will be needed to corroborate our findings. Second, our study was performed in Chinese population, and the data should be extrapolated to the population from other regions and ethnicities cautiously. Third, we used BIA method to measure the mass of skeletal muscle, which may result in a relatively less accurate when compared with the method of dual-energy X-ray absorptiometry. Fourth, although ASM/height2 index has been recommended to determine muscle mass by several consensus reports; however, because this index is positively correlated with BMI, subjects with high BMI due to larger amount of fat are easier to escape diagnosis of sarcopenia (50). Future studies using other adjustment methods, for example, ASM/BMI as recommended by the Foundation for the National Institutes of Health (FNIH) Sarcopenia Project (51) will help to identify the most appropriate skeletal muscle mass adjustment. Fifth, although our results suggest serum RBP4 might be a potential biomarker for sarcopenia, the AUC obtained in our study was only 0.617 (<0.7), indicating a relatively low predictive value. Finally, we did not investigate the correlation between serum RBP4 level and markers of systemic inflammation to test the hypothesis that increased RBP4 leads to severe sarcopenia through its pro-inflammatory effect.
Conclusions
In summary, our findings demonstrate that higher serum RBP4 level is correlated with the risk and severity of sarcopenia in the older adults. The addition of RBP4 to the traditional screening tools may not only help the risk stratification for the patients with sarcopenia but also may serve as an easily accessible biomarker for the diagnosis of sarcopenia. Further studies are needed to confirm the results of our study and explore the underlying mechanism for the association of RBP4 with sarcopenia.
Funding
This work was supported by grants from the National Key Research and Development Plan of China (No. 2020YFC2008505 to Xiang Lu), the National Natural Science Foundation of China (No. 81970217 to Wei Gao, 81970218 to Xiang Lu), a grant from the Jiangsu Geriatrics Society (No. JGS2019ZXYY06 to Xiang Lu), and a grant from the Six Talent Peaks Project of Jiangsu Province (No. WSN- 175 to Wei Gao).
Conflict of Interest
None declared.
References
Author notes
These authors contributed equally to this work.

