


Abstract
This study examined educational differences in decline in maximum gait speed over an 11-year follow-up in the general Finnish population aged 55 years and older and assessed the contribution of lifestyle factors, body mass index, physical workload, and chronic conditions on the association.
Data from the nationally representative Health 2000 Survey and its 11-year follow-up were used. Participants aged 55 years and older with maximum gait speed measured at both time points were included (n = 1128). Information on education, age, sex, lifestyle factors, body mass index, physical workload, and chronic conditions was collected at baseline. General linear model was used to examine differences in decline in maximum gait speed between education groups. Mediation analyses using the product method was conducted to partition the total effect of education on decline in maximum gait speed into direct effect and indirect effect acting through mediators.
Decline in maximum gait speed was greater in low and intermediate education groups in comparison to the high education group (0.24 m/s [95% confidence interval 0.21–0.26], 0.24 m/s [0.21–0.28], 0.10 m/s [0.07–0.14], respectively]. The most important mediators were higher body mass index and lifetime exposure to physical workload among the less educated, accounting for 10% and 11% of the total effect, respectively.
Education-based disparities in objectively measured mobility increase with age as lower education is associated with greater decline in gait speed. Higher body mass index and physical workload among less educated contributed most to the educational disparities in age-related decline in maximum gait speed.
Mobility is a central pre-requisite for quality of life with advancing age (1). Mobility limitations increase with age (2) and with population ageing, the number of people with mobility limitations will continue to increase. Promotion and maintenance of mobility among older adults are, therefore, essential from the point of view of public health. Previous studies have shown that mobility limitations among older adults vary by socioeconomic status (SES) (3–11) measured either in terms of educational level (3–5,7–9,11), material dimensions (5–9), or position in working life (10). This evidence is mostly based on cross-sectional studies, restricting causal inferences. On the other hand, longitudinal studies have produced conflicting results on the association between SES and mobility decline, as some studies suggest that SES differences persist or widen over time (8,12,13), while others indicate that disparities decline with ageing (6,14,15). Furthermore, most previous findings are based on self-reported indicators of mobility, which are not very sensitive indicators among high-functioning older adults and may confound the interpretation owing to reporting heterogeneity by SES (16). Evidence on how SES predicts objectively measured mobility, such as gait speed, are scarce and conflicting.
Two studies (6,12) based on data from the English Longitudinal Study of Ageing (ELSA) investigated the effect of SES on gait speed over time. One showed persisting disparities by wealth in 6-year trajectories in gait speed among people aged 60 years and older, supporting that SES has a cumulative positive association with mobility (12). Moreover, people in the most affluent quintile reached a critical value of gait speed (0.60 m/s) on average 6 years later than people in the lowest wealth quintile. The other study (6), in contrast, showed in a 10-year follow-up, among the same age group, that the magnitude of the advantage associated with higher SES (defined by education, regional wealth, and non-manual vs manual occupation) declined with increasing age. Yet, higher education was associated with faster gait speed at all ages.
Education is less subject to reverse causation as compared to other measures of SES, as it is usually acquired earlier in life, much before the onset of mobility limitations. The main weakness in the previous studies is that they have not examined the potential mechanisms through which education conveys into differential mobility decline in a longitudinal setting. It is important to identify the factors that contribute to this association and may be amenable to preventive interventions. Chronic conditions such as diabetes, cardiovascular diseases, and musculoskeletal diseases have previously been shown to partly explain SES differences in mobility limitations in older adults (3,9,11). Moreover, several factors related to lifestyle and health behaviors, such as obesity, smoking, excessive alcohol consumption, and physical activity, are unequally distributed across SES groups (17–20). As these factors are also directly associated with mobility in older age (21–23), they may be important in explaining educational differences in mobility decline. Previous studies have also found that depressive symptoms correlate with education (24) and predict physical performance decline (25). Finally, work-related physical strain, a predictor of adverse mobility outcomes (3,23), may be important in mediating educational differences in mobility decline, as people with lower education generally have physically more strenuous work than people with high education.
To address the gaps in the literature, this study aimed to examine the relationship of education and decline in maximum gait speed over an 11-year follow-up in the general Finnish population aged 55 years and older. The second aim was to assess the contribution of lifestyle factors, body mass index (BMI), physical workload, and chronic conditions to the association between education and decline in maximum gait speed.
Method
Study Population
The data came from the nationally representative Finnish Health 2000 Survey and its follow-up measurements in 2011, conducted by the National Public Health Institute (currently Finnish Institute for Health and Welfare). A 2-staged clustered sample representing the Finnish adult population was drawn. The Health 2000 survey sample included 8028 adults aged 30 years and older, of whom 87% (6986) participated in the study. The study consisted of home interviews, self-administered questionnaires, and comprehensive health examinations. Participants aged 55 years and older were also measured for functional capacity, which included testing for maximum gait speed. The participants of Health 2000 were invited to take part in Health 2011 follow-up study. Of the whole Health 2000 survey sample, 1573 people died, 96 moved abroad, and 109 refused further contact during the 11-year follow-up. The details of Health 2000 and Health 2011 studies have been reported elsewhere (26,27).
For the current study, the basic population were those 3439 participants who were 55 years and older at the baseline in 2000–2001. Out of them 77% (2660 persons) had their maximum gait speed measured by trained professionals. Participants who had participated both at the baseline and the 11-year follow-up and had their gait speed measured on both time points (n = 1128) were included. The Ethics Committee for Epidemiology and Public Health of the Hospital District of Helsinki and Uusimaa, Finland approved the Health 2000 Survey. Participants gave written informed consent.
Measurement of Education
A 3-class variable based on the level of general and vocational education was used as a marker of SES. Information was retrieved from the interviews at baseline and classified into 3 categories: low (=primary school or less, no vocational training), intermediate (=no general education beyond some secondary school combined with low vocational training/school, or secondary school with no vocational training beyond a basic course), and high (=matriculation examination, or secondary school with vocational school, or a degree from a vocational institute, polytechnic or university) (3). The mean years of education in these categories were 7.7 (SD 1.8), 10.4 (SD 2.5), and 14.9 (SD 3.3), respectively.
Measurement of Maximum Gait Speed
Maximum gait speed was measured over a 6.1-m course using a stopwatch. Subjects were asked to walk as fast as possible, starting from a standing position. A cane was accepted as a walking aid. Based on the distance and the time to finish the test, we calculated maximum gait speed as meters/second (m/s). Measurements were performed identically at baseline and at 11-year follow-up. Decline in maximum gait speed was calculated as the difference between baseline and follow-up maximum gait speed.
Measurement of Covariates
Information on all covariates was collected at baseline. Age and sex were considered as confounders of the relationship between education and decline in maximum gait speed. From previous literature, we identified several factors, that could potentially mediate the association between education and decline in maximum gait speed, that is, we considered these factors to be on the causal pathway. These potential mediators included leisure-time physical activity (LTPA) (18,20,22,23), physical workload (3,23), body mass index (17,21), alcohol consumption (18,22), smoking (3,18,22), depression (24,25), and chronic conditions (3,9,19).
Leisure-time physical activity was measured with a question: “How much do you exercise and strain yourself physically in your leisure time?” LTPA was classified as low (main activities do not involve moving/physical strain), moderate (walking, cycling, and other light exercise ≥4 h/wk), or high (exercising ≥3 h/wk or practicing several times/week for competition).
Physical workload was determined (as previously done by Sainio et al. (3)) based on participants’ self-reports on lifetime exposure to (a) heavy physical workload and (b) working in a kneeling or squatting position for at least one hour a day. A sum index of the years of exposure to these factors in the latest- and in the five longest-lasting jobs over lifetime was calculated. For the primary analyses, participants were categorized into 3 groups based on the tertiles of this index. Cutoff points were 1 and 30 years for women and 5 and 45 years for men.
Body mass index (kg/m2) was based on weight and height measured in the health examination and was treated as a continuous variable in the analyses. For smoking behavior, subjects were categorized as never smokers, former smokers, and current smokers. Alcohol consumption was classified as abstinent/moderate (≤140 g/wk for women and ≤280 g/wk for men) or excessive (>140 g/wk for women and >280 g/wk for men) (28). Information on medical conditions was retrieved from the baseline health examinations, in which the occurrence of major somatic diseases and mental disorders was inquired using a structured set of questions and the field physicians made clinical diagnoses according to standard diagnostic criteria (ICD-10) (26). The following conditions were included: respiratory disease (=bronchitis and/or asthma), heart disease (=angina pectoris and/or myocardial infarction and/or heart failure), osteoarthrosis of the hip or knee, low-back syndrome, diabetes, and depression.
Statistical Analysis
The primary analyses were conducted with SPSS v.24 (IBM). A package for complex samples and analytical weights were used to account for the clustered sampling design and to reduce bias due to non-response. Baseline characteristics by level of education are reported as mean and SD for continuous variables and proportions for categorical variables. Differences between groups were examined with chi-squared test for categorical variables, 1-way analysis of variance for continuous normally distributed variables, and Kruskal–Wallis test for skewed continuous variables.
To examine age- and sex-adjusted differences in maximum gait speed between education groups at baseline and at follow-up, we used analysis of variance for repeated measures (29). Next, we calculated decline in maximum gait speed as a difference of baseline and follow-up maximum gait speed. This was used as dependent variable in the explanatory analysis. To examine educational differences in decline in maximum gait speed, we fitted a general linear model that was adjusted for age, sex, and baseline gait speed (model 1). The interaction term between sex and education was not significant (p = .41), hence, men and women were analyzed together. Each potential mediator was individually included into the model to examine their associations with decline in maximum gait speed. To avoid multicollinearity, only variables most strongly associated with the outcome (p < .10) were included into the final multivariate model (model 2). Multicollinearity was checked using variance inflation factor. No multicollinearity appeared in either of the models. For both fitted models, assumptions of normality and homoscedasticity of residuals were met. Excluding outliers in the data did not change the results substantially, and the inferences were the same. Owing to missing values, 44 observations were excluded from the final model and from mediation analysis. Participants with missing data on the potential mediating factors were included in model 1 as our additional sensitivity analysis showed that restricting the analysis to participants with complete data did not change the results (data not shown).
Because neither of the models showed differences in decline in maximum gait speed between low and intermediate education groups, we combined these groups for the mediation analysis. We used the difference in coefficients approach (30,31) to examine the individual contribution of each potential mediator to the difference in decline in maximum gait between the education groups. Each potential mediator was added individually into the sex- and age-adjusted model. The factors that were included in the mediation model were chosen based on the following criteria: (a) prior evidence on their contribution to mobility decline, (b) a statistically significant association (p < .10) with both education level and decline in maximum gait speed, and (c) >10% change in the effect estimate of education with the inclusion of the factor (30,31). Two factors, BMI and physical workload, met these criteria.
The total effect of low and intermediate education versus high education on decline in maximum gait speed was then partitioned into direct effect of education, and indirect effect of education acting through its effect on mediating variables. We explored possible exposure–mediator and mediator–mediator interactions, yet no evidence of interaction was detected. Therefore, the mediating effects of BMI and physical workload were assessed in the same model (32). Decline in maximum gait speed during the 11-year follow-up was modeled as a function of education without and with inclusion of the mediators to obtain the total effect and the direct effect of education, respectively. Both mediators were used as continuous variables and they were standardized prior to analyses by dividing them by their SDs. The resulting BMI z-scores and physical workload z-scores were evaluated as potential mediators using the “product method” to calculate their indirect effects (32). We obtained 95% CIs for the indirect effects by performing 2000 bootstrap replicates from the sample (33). We present results of the mediation analysis as proportion mediated, which were calculated as the ratio between the indirect effects and the total effect. For the mediation analysis, we used Stata v.15 (College Station, TX).
Results
Baseline characteristics of the study population by level of education are shown in Table 1. There were slightly more women (57%) than men (43%), and the sex distribution differed by education level (p = .046). There were statistically significant differences in age, maximum gait speed, BMI, physical workload, and osteoarthrosis of knee and hip by education group; so that those who were older, had a higher BMI, higher lifetime exposure to physical workload, slower maximum gait speed, and a record of osteoarthrosis of knee and hip were more likely to be in the lower educational groups.
Baseline Characteristics of Participants by Level of Education
| Level of Education | |||||
|---|---|---|---|---|---|
| All (n = 1128a) | Low (n = 603a) | Intermediate (n = 284a) | High (n = 241a) | p for Difference | |
| Women, % | 56.9 | 59.7 | 50.0 | 56.8 | .046 |
| Age, y, mean (SD) | 63.5 (6.5) | 64.7 (6.6) | 62.3 (6.0) | 61.7 (5.9) | <.001 |
| Leisure-time physical activity, % | .146 | ||||
| Low | 20.0 | 22.3 | 18.3 | 15.8 | |
| Moderate | 63.6 | 63.4 | 63.4 | 64.1 | |
| High | 16.4 | 14.3 | 18.3 | 20.1 | |
| Physical workload | <.001 | ||||
| 1st tertile (lowest) | 38.7 | 24.9 | 44.2 | 71.4 | |
| 2nd tertile | 30.9 | 35.2 | 30.1 | 19.8 | |
| 3rd tertile | 30.4 | 39.9 | 25.7 | 8.8 | |
| Body mass index, kg/m2 | 27.8 (4.1) | 28.3 (4.2) | 27.6 (4.2) | 26.7 (3.6) | <.001 |
| Alcohol consumption, % | .212 | ||||
| Moderate | 93.6 | 94.4 | 93.8 | 90.8 | |
| Excessive | 6.4 | 5.6 | 6.2 | 9.2 | |
| Smoking, % | .234 | ||||
| Never | 63.3 | 63.2 | 62.8 | 63.9 | |
| Former | 24.5 | 25.3 | 26.5 | 19.7 | |
| Current | 12.2 | 11.5 | 10.6 | 16.4 | |
| Chronic conditions, % | |||||
| Respiratory disease | 7.5 | 7.8 | 7.6 | 6.7 | .890 |
| Coronary heart disease | 11.3 | 13.4 | 9.4 | 7.7 | .065 |
| Osteoarthrosis of the hip or knee | 16.6 | 20.2 | 14.3 | 8.9 | .001 |
| Low-back syndrome | 17.0 | 19.4 | 15.2 | 12.2 | .059 |
| Diabetes | 5.1 | 5.7 | 4.9 | 3.9 | .628 |
| Depression | 6.8 | 6.4 | 5.9 | 9.0 | .411 |
| Gait speed, m/s, mean (SD) | 1.63 (0.35) | 1.55 (0.33) | 1.71 (0.35) | 1.74 (0.36) | <.001 |
Notes: Summary statistics calculated among participants with non-missing data; missing data included leisure-time physical activity (n = 17), physical workload (n = 15), respiratory disease (n = 17), coronary heart disease (n = 14), osteoarthrosis of the hip or knee (n = 15), low-back syndrome (n = 15), diabetes (n = 16), and depression (n = 21).
aNon-weighed number of observations.
Figure 1 shows age- and sex-adjusted maximum gait speed at baseline and at 11-year follow-up according to education. At baseline, the difference in maximum gait speed between high education and low education group was 0.14 m/s (95% CI 0.08–0.19). Between intermediate education group and low education group, the mean difference was 0.10 m/s (95% CI 0.04–0.15). The difference between intermediate and high education groups was not statistically significant (−0.04 m/s, 95% CI −0.03 to 0.10).
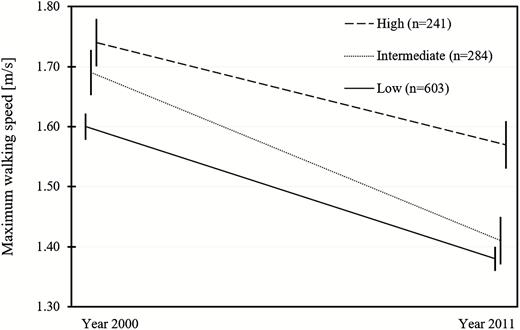
Age- and sex-adjusted maximum gait speed over the 11-year follow-up by education group.
Table 2 presents the estimates for decline in maximum gait speed (m/s) and their 95% CI in each education group. The decline was greater in low and intermediate groups as compared to high education group (Table 2, model 1). No difference between low and intermediate education group was found.
Estimated Average Decline in Maximum Gait Speed (m/s) Over an 11-Year Follow-up by Level of Education
| Low Education (n = 603) | Intermediate Education (n = 284) | High Education (n = 241) | R2 | |
|---|---|---|---|---|
| Mean Estimate (95% CI) | Mean Estimate (95% CI) | Mean Estimate (95% CI) | ||
| Model 1a | 0.24 (0.21–0.26) | 0.24 (0.21–0.28) | 0.10 (0.07–0.14) | .344 |
| Model 2b | 0.36 (0.31–0.41) | 0.38 (0.32–0.44) | 0.27 (0.20–0.33) | .391 |
Notes: CI = confidence interval. Estimates are obtained from general linear models.
aAdjusted for baseline gait speed, age, and sex. bAdditionally adjusted for body mass index, physical workload, leisure-time physical activity, respiratory disease, diabetes, and knee and hip osteoarthrosis, n = 1084 (44 participants omitted in model 2 due to missing values).
Multivariate analysis (Table 3) showed significant associations of BMI, physical workload, LTPA, respiratory disease, diabetes, and osteoarthrosis of the hip or knee with decline in maximum gait speed. Adjusting for all significant variables (Table 2, model 2) changed all the group estimates markedly. Low and intermediate education still predicted greater decline in maximum gait speed as compared to high education, but the differences lost statistical significance. No difference between low and intermediate education group was found.
Regression Coefficients of General Linear Models With 95% Confidence Interval (CI) for Decline in Maximum Gait Speed of the Participants Over an 11-Year Follow-up
| Decline in Maximum Gait Speed | ||||
|---|---|---|---|---|
| Model 1a,* (n = 1128) | Model 2b,* (n = 1084) | |||
| B | 95% CI | B | 95% CI | |
| Intercept | −2.292 | −2.529 to −2.056 | −2.638 | −2.922 to −2.354 |
| Education | ||||
| Low | 0.135 | 0.092–0.178 | 0.093 | 0.051–0.135 |
| Intermediate | 0.140 | 0.089–0.191 | 0.113 | 0.064–0.161 |
| High | Ref. | Ref. | ||
| Baseline gait speed | 0.571 | 0.508–0.634 | 0.626 | 0.562–0.690 |
| Age | 0.024 | 0.021–0.027 | 0.023 | 0.020–0.026 |
| Sex | ||||
| Women | Ref. | Ref. | ||
| Men | −0.101 | −0.141 to −0.062 | −0.108 | −0.147 to −0.068 |
| Body mass index | 0.009 | 0.004–0.013 | ||
| Physical workload | ||||
| 1st tertile (=lowest) | Ref. | Ref. | ||
| 2nd tertile | 0.009 | −0.034 to 0.052 | ||
| 3rd tertile | 0.045 | 0.004–0.086 | ||
| Leisure-time physical activity | ||||
| High | Ref. | Ref. | ||
| Intermediate | 0.052 | 0.005–0.099 | ||
| Low | 0.051 | −0.014 to 0.116 | ||
| Respiratory disease | 0.062 | 0.002–0.122 | ||
| Osteoarthrosis | 0.101 | 0.047–0.156 | ||
| Diabetes | 0.171 | 0.090–0.251 | ||
Notes: B = beta coefficient; CI = confidence interval.
aadj. R2 = .344, n = 1128. bp < .001, adj. R2 = 0.391, n = 1084 (due to missing values 44 participants were omitted).
*p < .001.
To understand what portion of the difference in decline in maximum gait speed between the education groups was attributable to BMI and physical workload, we conducted mediation analysis. Direct and indirect effects of education on decline in maximum gait speed are summarized in Table 4. Indirect effect of lower education acting through its combined effect on both considered mediators accounted for 21% of the total effect. Indirect effect of lower education acting through BMI accounted for 10% of the total effect, whereas 11% of the total effect was mediated through lifetime exposure to heavy physical workload. Both examined indirect effects were statistically significant.
Mediation Analyses on the Association Between Education and Decline in Maximum Gait Speed With Body Mass Index z-Score (BMIZ) and Physical Workload z-Score (PWZ) as Mediators
| Effect Type | Adjusted Mean Decline in Maximum Gait Speed (m/s) (n = 1084) | % of Total Effect | |
|---|---|---|---|
| Total | 0.133 (0.093–0.173) | 100 | |
| Direct | High education | Ref. | Ref. |
| Low and intermediate education | 0.101 (0.060–0.142) | 75.9 | |
| Indirect | BMIZ | 0. 013 (0.005–0.020) | 9.7 |
| Indirect | PWZ | 0.015 (0.002–0.028) | 11.3 |
| Indirect total | 0.028 (0.013–0.043) | 21.0 |
Note: Mediation analysis were adjusted for age, sex, and baseline gait speed with or without adjustment for BMIZ and PWZ. Given the use of the product method, the indirect and direct effects do not add up to 100%.
Discussion
Using nationally representative data from Finland with 11-year follow-up, we found that maximum gait speed declined markedly faster in low and intermediate education groups as compared to high education group. Moreover, the most important factors explaining the educational differences in decline in maximum gait speed were higher exposure to physically strenuous work and higher BMI in lower educational groups, accounting for 11% and 10% of the total effect, respectively.
Our results are in line with existing evidence, stating that higher education is associated with better mobility (3–5,7–9,11). Moreover, these findings support the cumulative advantage hypothesis (34) according to which health disparities according to socioeconomic position increase over time. However, the results are discordant with earlier 2 studies which found, utilizing data from the ELSA, that SES-based differences in gait speed decrease (6) or do not change (12) over time. The mean age of the participants in the ELSA cohorts was slightly older (70 years) than in the present study (64 years), which could partly explain the divergent results. Furthermore, they examined preferred gait speed, whereas we analyzed maximum gait speed in our study. It is possible that by using maximal gait speed, we were able to capture better subtle changes in mobility, which were not detected in ELSA when using preferred gait speed.
We also aimed at identifying proximal risk factors, which could explain educational disparities in mobility decline. Our mediation analyses showed that these differences were partly explained by higher BMI and higher lifetime exposure to physically strenuous work among less-educated groups. This finding is in line with a previous cross-sectional study from Finland (3). The combined effects of BMI and physical workload explained up to 21% of the differences. However, most of the differences between education groups in decline in maximum gait speed was not mediated by these 2 factors, which suggests that there are other pathways that mediate the association between education and mobility decline.
Detrimental health behaviors are known risk factors for mobility limitations and tend to be socially stratified. Therefore, the association between education and decline in maximum gait speed was expected to be partly mediated by smoking, alcohol consumption, and physical activity. However, in our study, smoking behavior did not differ between education groups. While there were slightly more smokers among highly educated, those who reported having previously smoked were conversely less educated. In addition, there was no significant difference between levels of education in the prevalence of excessive alcohol consumption and, although LTPA was a statistically significant predictor of decline in maximum gait speed in our analyses, it lacked explanatory power for the differences between education groups. Although some previous research has similarly indicated that hazardous health behaviors only modestly explain socioeconomic health disparities among adults (9,35), it is possible that the crude classification of these factors failed to capture the actual differences between participants, and more accurate information could have yielded different results.
Another explanation is that selective loss to follow up may have led to underestimation of mediation through LTPA and excessive alcohol consumption, which were more prevalent among those who were lost to follow-up (Supplementary Table1). Same can be concluded about the mediating role of chronic conditions. In discordant with our findings, some previous studies have shown that chronic conditions contribute to SES-based mobility disparities (3,9). Our attrition analyses showed that those who did not have follow-up data on maximum gait speed were older and had more chronic conditions at baseline than those who were included in the study (Supplementary Table1). Completion of follow-up was influenced by baseline health condition which in turn was strongly correlated with educational level as well as baseline maximum gait speed. Therefore, the actual differences in decline in maximum gait speed between the education groups may be even greater than our results suggest, and the contribution of medical conditions on the differences may be an underestimate.
Strengths of this study include the longitudinal design, which reinforces causal inferences as compared to previous cross-sectional analyses (3–5,7). We measured follow-up information on gait speed 11 years after the information about mediators, ensuring that the mediators were measured prior to outcome. In addition, the use of education as a SES-indicator diminished causal order issues as education is acquired earlier in life. However, given the contradicting findings with some previous studies (6,12), an important direction for future research is to determine the associations of different SES dimensions, such as income or occupational class, with mobility decline. In addition, a more comprehensive assessment of mobility, for example, by utilizing novel wearable technologies as suggested by Buchman et al. (36), could enhance the understanding of varied causes of mobility decline among older adults. Walking requires several features of physical performance and gait speed has shown to be one of the most sensitive indicators of mobility. Metrics that quantify other facets of gait, such as cadence or sway, could further inform on which aspect of mobility may contribute to slowing of gait speed.
A further limitation in our study is that we did not examine how all the potential mediators may influence one another. However, obesity, as well as physical workload are widely acknowledged risk factors, for example, for incidence and progression of osteoarthritis, which in turn is negatively associated with mobility (37). As there may be causal chains between the mediating variables, an important future study topic is the complex interactions between the mediators and their effect on mobility outcomes.
Conclusions
We found that educational level was strongly associated with mobility decline at older age as assessed by decline in maximum gait speed over an 11-year follow-up. Higher lifetime exposure to physical workload and higher BMI among less educated were identified to contribute most to the educational differences in mobility decline. To reduce education-based health disparities, attention should be paid to these proximal risk factors.
Funding
This work was supported the Academy of Finland (grant numbers 286294, 294154, 319246) to S.S., and by the Competitive State Research Financing of the Expert Responsibility area of Tampere University Hospital to S.N.
Conflict of Interest
None declared.
Acknowledgment
We thank all participants, investigators, and contributors of Health 2000 and Health 2011 studies.
Author Contributions
S.M.K., K.T., and S.S. designed the study. S.M.K and J.R. conducted the statistical analyses. S.M.K. drafted the manuscript. All authors contributed to interpretation of the results, reviewed the manuscript for important intellectual content, edited the paper, and approved the final version.

