


Abstract
To investigate the association between frailty, Parkinson’s disease (PD), and the probability of prodromal Parkinson’s disease (prodromal PD) in Greek community-dwelling older individuals.
Parkinson’s disease diagnosis was reached through standard clinical research procedures. Probability of prodromal PD was calculated according to the International Parkinson and Movement Disorder Society’s research criteria for PD-free participants. Frailty was evaluated according to definitions of the phenotypic and multidomain approach. Logistic and linear regression models were performed to investigate associations between frailty (predictor) and the probability of prodromal PD, either continuous or dichotomous (≥30% probability score), or PD (outcome).
Data from 1765 participants aged 65 and older were included in the present analysis. Parkinson’s disease and prodromal PD prevalence were 1.9% and 3.0%, respectively. Compared to nonfrail participants, those who were frail, as identified with either the Fried frailty phenotype or Frailty Index had approximately 4 (odds ratio [OR] 4.09, 95% confidence interval [CI] 1.54–10.89) and 12 times (OR 12.16, 95% CI 5.46–27.09) higher odds of having a PD diagnosis, respectively. Moreover, compared to the nonfrail, frail participants as identified with either the Fried frailty phenotype or Frailty Index had 2.8 (OR 2.83, 95% CI 1.09–7.37) and 8.3 times (OR 8.39, 95% CI 4.56–15.42) higher odds of having possible/probable prodromal PD, respectively.
Frailty status was associated with prodromal PD and PD, suggesting common characteristics or underlying mechanisms of these conditions. Although prospective studies are warranted, acknowledging the possible association of frailty, PD, and prodromal PD may improve their clinical management.
Frailty is a term used to describe the increased vulnerability levels observed mainly in older people caused by the accumulation of multiple deficits (1,2). Frail people decline in various domains of functioning (mobility, gait, muscle strength, cognition, and physical activity) and are more susceptible to adverse health outcomes (including hospitalization, loss of autonomy, falls, and mortality) (1). Regarding the assessment of frailty, many instruments have been developed and used but 2 approaches have prevailed: (a) the biological or phenotypic approach, which focuses on the physical aspects of frailty, and (b) the multidomain approach, as part of a broader perspective which includes a combination of physical measures, syndromes, diseases, and psychosocial factors (3).
Some core features of frailty (low gait speed, age-dependency, and physical appearance of weakness) are also characteristics of Parkinson’s disease (PD), a neurodegenerative disease manifested with motor and nonmotor symptoms. Similarities between frailty and PD probably underlie shared pathophysiological mechanisms. Data regarding the association between frailty and PD are limited, but have shown that frailty prevalence is high among people with PD (4–7) or mild parkinsonian symptoms (8). Apart from the small number of studies exploring the relationship between frailty and PD, the existing literature is also based on quite small sample sizes (4,7,9). Another limitation includes the use of nonrepresentative samples, which may limit the generalization of the results. Specifically, in some studies, the sample was derived from clinical cohorts of people diagnosed with PD (6,8) or was limited to women (7). Additionally, although many definitions of frailty have been proposed, most studies used the definition proposed by Fried (5,7,9), which includes criteria that are common in PD (such as slow walking speed). The multidomain frailty approach has not been adequately explored. Even more importantly, to the best of our knowledge, there is no study examining the association between frailty and prodromal stages of PD, wherein nonmotor symptoms and/or subtle motor signs are present before the clinical diagnosis of PD. More specifically, the International Parkinson and Movement Disorder Society (MDS) defined the research criteria for prodromal PD and calculated a probability score for prodromal PD, based on known risks and prodromal markers of PD (10).
The aim of the present large-scale, population-based study was to examine the association between frailty, PD, and the probability of prodromal PD in a general population of community-dwelling older individuals in Greece.
Method
Participants
We randomly selected volunteers among Greek community-dwelling individuals (aged 65 or older, no exclusion criteria) to participate in the HEllenic Longitudinal Investigation of Aging and Diet (HELIAD) study. HELIAD is a population-based, multidisciplinary study on the prevalence of aging-related neuropsychiatric conditions, described in detail elsewhere (11,12). The relevant Institutional Review Boards approved study procedures and all volunteers gave written informed consent prior to their participation.
Qualified neurologists examined all participants. In face-to-face interviews, volunteers provided information regarding medical problems, neurological conditions, neuropsychiatric symptoms, current medications, hospitalizations, surgeries, and injuries. We also collected information about the medical history of the participants’ first-degree relatives. Additionally, we conducted an extensive structured physical examination, evaluating neurological signs and symptoms. Structured questionnaires were used in order to gather information about participants’ functioning, social, mental and physical activities, sleep, and dietary habits. Information regarding sociodemographics, tobacco use, and pesticide exposure was also collected. Height and weight were measured to the nearest 0.5 cm and 0.5 kg, respectively and body mass index was calculated by dividing the weight (kg) by height squared (m2). All participants went through a comprehensive neuropsychological assessment of all major cognitive domains, conducted by neuropsychologists (13,14)
Expert consensus meetings (the neurologists who examined the participants [senior neurologists: E.D., G.M.H., and N.S. and junior neurologists] and the neuropsychologists [senior neuropsychologist: M.H.K. and psychometricians]) reviewed all obtained information and provided the clinical diagnosis of each participant using published criteria. Specifically, the diagnosis of dementia was based on the Diagnostic and Statistical Manual of Mental Disorders-IV—text revision criteria (15), and the diagnosis of probable/possible Alzheimer disease was made according to the National Institute of Neurological and Communicative Disorders and Stroke/Alzheimer Disease and Related Disorders Association criteria (16). The diagnosis of vascular dementia was based on history or clinical evidence of stroke, the presence of a clear temporal relation between stroke and the onset of dementia and the Hachinski Ischemia Scale score (17). Lewy body and frontotemporal dementias were considered according to respective criteria (18,19). Mild cognitive impairment was diagnosed according to the Petersen Criteria (20).
Frailty Assessment
We took into account both the biological and the multidomain approaches of frailty (3). Thus we used 2 measurements of frailty: the Fried frailty phenotype (FFP) (1) and the Frailty Index (FI) (2,21). Briefly, regarding the FFP, participants who met 3 or more criteria were considered as frail, those with 1 or 2 criteria present as prefrail, and those who met none of the FFP criteria as nonfrail. The 5 criteria were the following: (a) Slow walking speed was defined as the lowest 20% of our study population for the 4 m walking speed test (adjusted for sex and height). (b) Shrinking/weight loss was defined as a body mass index of less than 18.5 kg/m2. (c) Poor endurance/exhaustion was evaluated as a negative response to the question taken from the Geriatric Depression Scale “Do you feel full of energy?” (22). (d) Low physical activity was estimated based on the Athens Physical Activity Questionnaire, which calculates participants’ daily energy expenditure for physical activities (23). The lowest 20% for each sex was assumed to be indicative of this frailty criterion. (e) Weakness was defined as the lowest 20% of the current study participants’ performance on the grip strength test adjusted for sex and body mass index. Grip strength of the dominant hand was measured with an electronic dynamometer (model MG-4800, UK) and the mean strength of 3 trials was used in the current analysis. Details regarding the operationalization of this definition and specific cutoffs for walking time and grip strength criteria have been reported in previous publications from the HELIAD study (14).
FFP criteria are mainly physical, thus frailty defined in this way is more likely to share similar characteristics with PD. Thus, we also operationalized frailty based on the multidomain definition proposed by Rockwood and Mitnitski (2,21). This approach is based on the calculation of a FI, defined as the ratio of deficits presented in a person to the total number of deficits considered in a medical evaluation. For the construction of FI, we followed the standard procedure described by Searle et al. (24). In the current study, 38 variables regarding diseases, syndromes, functioning in activities of daily living, cognitive decline, mood disorders, and performance on physical activities were included for the assessment of frailty (Supplementary Table S1). To avoid circularity when investigating associations with PD, variables related to PD or included in the prodromal PD calculation (eg, PD diagnosis, intention tremor, and family history of PD) were not included in the operationalization. According to this index, a score of 0.25 is the cutoff point for frailty, with higher scores indicating the presence of more “deficits,” and, thus, a greater degree of frailty (2).
PD Diagnosis and Calculation of Probability of Prodromal PD
PD diagnosis was reached through standard clinical research procedures: neurological clinical evaluation (past history, symptomatology, examination, etc.), administration of the Unified Parkinson’s Disease Rating Scale (UPDRS) (25), relevant medications taken, etc. (26). For non-PD participants, prodromal PD probability was calculated following the MDS procedure as we have previously reported (27,28). In this way, researchers can identify participants with early symptoms or signs of PD neurodegeneration, who have not shown symptoms of motor parkinsonism. The procedure proposed by the MDS is a validated method, used for research purposes so far, and it calculates the prodromal PD probability including a combination of risks and other prodromal markers of PD. Specifically, to assess prodromal PD probability, we used several instruments (Supplementary Table S2): a structured pretested questionnaire for pesticide use (29), a semiquantitative food frequency questionnaire (30), the UPDRS, a structured questionnaire of the core, suggestive or supportive features of dementia with Lewy bodies (fluctuation of alertness/cognition, visual hallucinations, parkinsonism, rapid eye movement sleep behavior disorder, severe neuroleptic sensitivity, repeated falls and syncope, transient, unexplained alteration of consciousness, severe autonomic dysfunction, hallucinations in other modalities, systematized delusions, and depression) (31,32), the Medical Outcomes Study Sleep Scale (33), the Geriatric Depression Scale (22), the Hospital Anxiety and Depression Scale (34), and the Neuropsychiatric Inventory (35). Prior (pretest) probability for prodromal PD was assessed according to the age of the participant. We calculated the individualized likelihood ratios (LRs) for every risk and prodromal marker and an LR of 1.0 was assigned for missing values. We computed the total risk LR and total prodromal LR separately by multiplying the relevant markers. These LRs were then multiplied to generate the total LR and the final posttest probability of prodromal PD was calculated combining total LR with pretest probability. Based on this probability score, study participants were categorized into 2 groups: those with at least 30% prodromal PD probability who were considered as having possible/probable prodromal PD and those with less than 30% prodromal PD probability who were considered as possible/probable prodromal PD-free (10,28). In the current study, we use the acronyms cont. pPD and prob/poss. pPD when referring to the continuous variable of prodromal PD probability score and the categorical variable of possible/probable prodromal PD.
Statistical Analysis
We used Q–Q plots to assess data normality. Normally distributed data are presented as means ± SD, not normally as medians (Q1, Q3) and categorical data as frequencies (%). Differences between groups (participants with PD vs participants without PD) were explored with Student’s paired t tests or Mann–Whitney rank tests, for normally and not normally distributed continuous variables, respectively, and chi-square tests (or logistic regression) for categorical variables. The same statistical tests mentioned above were used to assess differences between the participants with prob/poss. pPD and those without prob/poss. pPD.
The associations between frailty status and PD, prodromal PD status and prodromal PD probability score were evaluated by regression analyses. Specifically, irrespectively of the frailty operationalization, we used logistic regression analysis with frailty status treated as the predictor and the diagnosis of PD (PD participants vs others) as the outcome. In order to examine the association between frailty status and prodromal PD probability score (which is a continuous variable), linear regression models were performed with frailty status as the predictor and cont. pPD score as the outcome. Data on the cont. pPD were not normally distributed and were log-transformed before performing regression analyses. Moreover, when prodromal PD was used as a categorical variable (prob/poss. pPD participants vs prob/poss. pPD-free participants), logistic regression analysis was performed with frailty status treated as the predictor and prob/poss. pPD status considered as the outcome. Frailty status was categorized into frail and nonfrail for both measurements: thus for FFP (that discriminates between frail, prefrail, and nonfrail participants), we decided to include prefrail participants in the nonfrail category. Finally, in the case of FI, frailty was entered into the models mentioned above both as a categorical (comparing frail to nonfrail individuals), but also as a continuous variable (as the total criteria met by participants). All models were initially unadjusted, because usual sociodemographic characteristics such as age and gender are both included in the calculation of the study’s outcome (ie, prob/poss. pPD and cont. pPD). However, we further perform the analyses adjusting for age, sex, education (years), and socioeconomic status (lower vs higher). Results are shown as β (95% confidence interval [CI]) for linear and odds ratio (OR; 95% CI) for logistic regression analyses. SPSS statistical software (SPSS 23.0; SPSS Inc., Chicago, IL) was used for all data analyses.
Supplementary Statistical Analyses
As far as the association between frailty and PD is concerned, we performed some complementary analyses exploring if any specific parkinsonian sign is more related to frailty. The parkinsonian signs entered in these analyses were rest tremor, facial bradykinesia, overall bradykinesia, rigidity, and gait impairment. In these regression models, frailty status was considered as the predictor and each parkinsonian sign as the outcome.
As far as the FFP is concerned, it is evident that the criterion of slow walking speed is also a key feature of PD and measuring this may lead to over-diagnosing frailty in people with PD. To avoid overlapping between frailty as measured with the FFP and PD, we opted to repeat the abovementioned analyses between frailty, prodromal PD, and PD, after excluding the low walking speed criterion from the assessment of frailty. Thus, frailty was defined as having 2 or more of the following criteria: grip strength, shrinking/weight loss, poor endurance, and low physical activity. Participants with one criterion present were identified as prefrail and those who met none of the FFP criteria as nonfrail. For these analyses, only adjusted models were performed.
Results
The total sample consisted of 1765 people (1042 women). They were all at least 65 years, with a median (Q1, Q3) age of 73 (69, 77) years. As we have previously published, PD and prodromal PD prevalence in our sample was 1.9% (35/1765) and 3.0% (49/1731), respectively (27). Frailty prevalence in the total sample was 4.2% (75/1765), and 22.2% (391/1765) as measured with the FFP and the FI, respectively (36).
The sample demographic and anthropometric characteristics of the study population according to PD/prodromal PD status are given in Table 1. Those identified with prob/poss. pPD or diagnosed with PD were older and reported lower socioeconomic status and those with prob/poss. pPD were less educated than the remaining sample (p < .05). In addition, frailty prevalence was higher among participants with PD or prob/poss. pPD, compared to PD-free and prob/poss. pPD-free participants, irrespectively of the frailty definition used (p < .05; Figure 1).
Demographics and Scores of Other Frailty Characteristics of the Study Population According to PD Status
| PD/Prodromal PD-Free (ie, non-PD and prodromal PD probability <30; n = 1682) | Prob/Poss. Prodromal PD (ie, prodromal PD probability ≥30; n = 49) | PD (n = 34) | p Value | |
|---|---|---|---|---|
| Age, median (Q1, Q3), years | 73 (69, 77)a | 76 (73, 79)b | 76 (73, 79)b | <.001† |
| Education, median (Q1, Q3), years | 6 (5,12)a | 6 (3,6)b | 6 (2,11) | .003† |
| Sex, male, n (%) | 683 (40.6) | 22 (44.9) | 18 (52.9) | .298‡ |
| Socioeconomic status, lower, n (%) | 765 (45.7) | 25 (51.0) | 25 (58.8) | .244‡ |
| Fried criteria | .001‡ | |||
| Frail, n (%) | 65 (3.9) | 5 (10.2) | 5 (14.7) | |
| Nonfrail, n (%) | 1617 (96.1) | 44 (89.8) | 29 (85.3) | |
| Frailty index | <.001‡ | |||
| Frail, n (%) | 332 (19.7) | 33 (67.3) | 26 (76.5) | |
| Nonfrail, n (%) | 1350 (80.3) | 16 (32.7) | 8 (23.5) |
Note: PD = Parkinson’s disease; prodromal PD = prodromal Parkinson’s disease.
†Kruskal–Wallis test. Values in the same row bearing different superscript letters differ significantly, according to Mann–Whitney rank tests (not normally distributed continuous variables, Bonferroni corrected for multiple comparisons). For example, for the variable of age: prodromal PD and PD groups have b, meaning that they do not differ from each other, PD/prodromal PD-free group has a, meaning that differs from both prodromal PD and PD groups (which have b).
‡Pearson’s chi-square test.
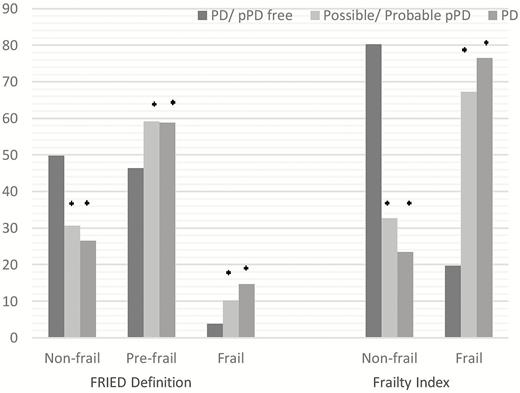
Frequencies (%) of frailty status according to PD status. PD = Parkinson’s disease; prodromal PD = possible/probable prodromal PD (ie, prodromal PD probability ≥30%). p values were obtained with logistic regression analyses. *p < .05 versus participants without PD or prodromal PD.
The results of the regression analyses, organized based on the outcome, are given in Table 2 (unadjusted models) and Table 3 (adjusted models) and are depicted in Figure 2A and B.
Associations Between Frailty (as measured with FFP definition and FI) and PD Diagnosis, Possible/Probable Prodromal PD (≥30% probability) and Probability of Prodromal PD (continuous variable) in Older Population
| Participants With PD (n = 34) vs Participants Without PD (n = 1731) | Participants With Prob/Poss. pPD (n = 49) vs Participants Without Prob/Poss. pPD (n = 1682) | Associations With Cont. pPD score (n = 1731 PD-free) | ||||
|---|---|---|---|---|---|---|
| OR (95% CI) | p Value | OR (95% CI) | p Value | β (95% CI) | p Value | |
| Association with Fried definition | ||||||
| Nonfrail | 1 (reference) | 1 (reference) | ||||
| Frail | 4.09 (1.54–10.89) | .005 | 2.83 (1.09–7.37) | .033 | 2.42 (1.82–3.20) | <.001 |
| Association with FI (as a dichotomous variable) | ||||||
| Nonfrail | 1 (reference) | 1 (reference) | ||||
| Frail | 12.16 (5.46–27.09) | <.001 | 8.39 (4.56–15.42) | <.001 | 2.86 (2.51–3.25) | <.001 |
| Association with FI (as a continuous variable) | ||||||
| Total continuous score | 1.33 (1.23–1.43) | <.001 | 1.37 (1.28–1.47) | <.001 | 1.17 (1.16–1.19) | <.001 |
Notes: CI = confidence interval; FFP = Fried frailty phenotype; FI = frailty index; OR = odds ratio; PD = Parkinson’s disease; prodromal PD = prodromal Parkinson’s disease. All models were unadjusted. Results for the probability of PD and prodromal PD came from logistic regression analyses. Results for the probability of prodromal PD came from linear regression analyses using log-transformed data. For clarity purposes, β (95% CI) were back-transformed from log scale to their original scale.
Associations Between Frailty (as measured with FFP and FI) and PD Diagnosis, Possible/Probable Prodromal PD (≥30% probability) and Probability of Prodromal PD (continuous variable) in Older Population
| Participants With PD (n = 34) vs Participants Without PD (n = 1731) | Participants With Prob/Poss. pPD (n = 49) vs Participants Without Prob/Poss. pPD (n = 1682) | Associations With Cont. pPD score (n = 1731 PD-free) | ||||
|---|---|---|---|---|---|---|
| OR (95% CI) | p Value | OR (95% CI) | p Value | β (95% CI) | p Value | |
| Association with Fried definition | ||||||
| Nonfrail | 1 (reference) | 1 (reference) | ||||
| Frail | 2.82 (0.96–8.29) | .060 | 1.58 (0.56–4.46) | .389 | 1.46 (1.11–1.91) | .007 |
| Association with FI (as a dichotomous variable) | ||||||
| Nonfrail | 1 (reference) | 1 (reference) | ||||
| Frail | 11.76 (5.12–27.01) | <.001 | 7.55 (4.00–14.25) | <.001 | 2.39 (1.23–2.16) | <.001 |
| Association with FI (as a continuous variable) | ||||||
| Total continuous score | 1.35 (1.24–1.46) | <.001 | 1.39 (1.28–1.50) | <.001 | 1.14 (1.13–1.16) | <.001 |
Notes: CI = confidence interval; FFP = Fried frailty phenotype; FI = frailty index; OR = odds ratio; PD = Parkinson’s disease; prodromal PD = prodromal Parkinson’s disease. Results for the probability of PD and prodromal PD came from logistic regression analyses. Results for the probability of prodromal PD came from linear regression analyses using log-transformed data. For clarity purposes, β (95% CI) were back-transformed from log scale to their original scale. Models were adjusted for gender, age, education, and socioeconomic status.
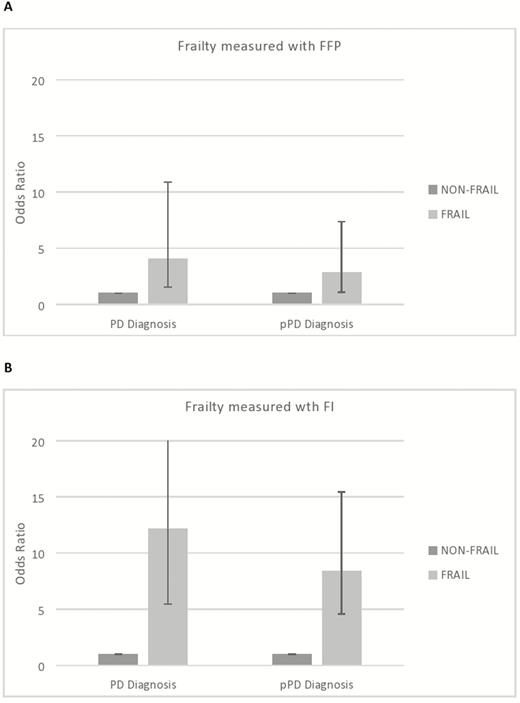
Odds ratio and confidence intervals of the unadjusted association between frailty status and diagnosis of Parkinson’s disease (PD) and possible/probable prodromal PD (≥30% probability). (A) Frailty status measured with Fried frailty phenotype (FFP) and (B) frailty status measured with the Frailty Index (FI).
Frailty and PD Diagnosis
Frail participants, as identified with FFP and FI, had approximately 4 and 12 times higher odds of being diagnosed with PD (p < .001), respectively, compared to nonfrail participants (Table 2, unadjusted models). Adjustment for age, sex, education, and socioeconomic status revealed similar associations between FI and PD, while the association between FFP and PD diagnosis tended to remain significant (OR 2.82, 95% CI 0.96–8.29, p = .060, Table 3).
Frailty and Prodromal PD (Prob/Poss. pPD and Cont. pPD Probability)
When the FFP measurement was used, frail participants had 2.4 times higher cont. pPD score and approximately 3 times higher odds of being identified with prob/poss. pPD, compared to nonfrail (Table 2, unadjusted models). When frailty was measured with the FI, frail participants had 2.8 times higher cont. pPD score and 8 times higher odds of having prob/poss. pPD (p < .001) than the nonfrail participants. It is remarkable that each point increase in frailty score (out of 38), that is, each additional criterion of frailty in the FI, raised cont. pPD score approximately by 17% (p < .001) and odds of having prob/poss. pPD by 37% (p < .001). When adjusted for age, sex, education, and socioeconomic status, the above association between FI and prodromal PD did not change (Table 3, adjusted models). As far as the FFP is concerned, although frail participants still had significantly higher cont. pPD probability score (β = 1.46 p = .007, adjusted models), there was no significant association between frailty and prob/poss. pPD diagnosis.
Supplementary Analyses
The supplementary analyses regarding the association between frailty and each specific parkinsonian sign showed that frailty (irrespectively of the definition used) was related to all individual signs. Specifically, when FI was used, compared to nonfrail, frail individuals had 7.2 (95% CI 4.71–11.27), 8.8 (95% CI 5.01–15.55), 11.6 (95% CI 6.31–21.65), 4.8 (95% CI 2.94–7.99), and 12.5 (95% CI 6.13–25.73) times higher risk to show rest tremor, facial bradykinesia, overall bradykinesia, rigidity, and gait disorder, respectively. Results were quite similar when FFP was used, or even when PD participants were excluded from the analysis. Therefore, it seems that frailty is associated with the whole disorder and not a particular parkinsonian sign or a particular PD phenotype.
When we excluded the criterion of walking speed from the FFP definition, we observed that the association between frailty, diagnosis of PD, and cont. pPD probability score remained statistically significant. Specifically, compared to nonfrail, frail participants had significantly higher odds of having PD (OR 2.72, 95% CI 1.19–6.25), and higher cont. pPD probability score (β = 1.21 p = .039), but there was no significant association between frailty and diagnosis of prob/poss. pPD (OR 0.87, 95% CI 0.35–2.19). This difference may be attributed to type II error restrictions. Specifically, the observed nonsignificant association between frailty and prob/poss. pPD may be due to the low number of cases (n = 49). However, when the cont. pPD is used, analyses are performed for a larger population (n = 1731) and the results show significant association with frailty.
Discussion
To date, only a few studies have focused on the relationship between frailty and PD (6,8,37). The current study focuses not only on PD per se but also on its prodromal stage, prodromal PD, and explores their relationship with frailty in a population of community-dwelling older people. To the best of our knowledge, this is the first study to examine the association between frailty (as measured with various instruments) and prodromal PD probability (as computed using the recently published MDS research criteria). Our results showed that irrespective of the frailty measurement used, frail community-dwelling older adults had higher odds of being identified either with PD or prodromal PD, compared to nonfrail individuals (Figure 2A and B), implying that the mechanisms underlying this relationship may be independent of the specific frailty criteria used in each assessment tool.
Regarding the association between PD and frailty, our findings are in line with previous research. Ahmed et al. (6) found that the prevalence of frailty in a sample of PD patients was much higher, compared to that reported in cohorts of older individuals. Frailty prevalence was also found to be higher in PD patients compared to the general older population (4) or their spouses/siblings (5). A higher prevalence of frailty has been reported in patients with mild parkinsonian symptoms as well (8). Thus, the high prevalence of frailty in people with PD and the similarities that the 2 conditions share raise the need for an accurate diagnosis and treatment of both conditions.
We expand these findings by using different frailty definitions. In an effort to translate the results of the current study, we observe that older adults (both men and women) who report fatigue, weight loss, low physical activity, and have low grip strength (criteria of the FFP) have increased odds of being diagnosed with PD. The same applies to people who report chronic conditions, mobility impairment, functional limitations, mood or cognitive problems, and also have sensory and neurological signs (as measured with the FI).
The pathway lying beneath the relationship between frailty and PD is not fully understood. However, common underlying mechanisms between frailty and PD may be responsible for the observed association. Specifically, inflammation (38,39), oxidative stress and free radicals (38,40,41), and mitochondrial dysfunction (42,43) are common in both frailty and PD pathology. Frailty-related dysfunction of the gut–brain axis may also contribute to PD pathology (44). It has been also hypothesized that dopamine dysfunction may mediate this relationship (8).
Most of the aforementioned changes attributed to PD pathology are thought to occur early, years before PD diagnosis is reached. Our data support that notion, because we found that frailty is associated not only with PD but also with prodromal PD, implying that the common characteristics between frailty and PD are present even in the prediagnostic stage of PD (prodromal PD). Thus, frailty diagnosis early in the prodromal PD stage may exacerbate the need for lifestyle changes to improve quality of life and, perhaps, prevent or delay PD onset. Supporting this notion is the finding that a lifestyle factor, adherence to the Mediterranean diet, is associated with lower odds for both clinical identities in studies with a cross-sectional design (14,27), suggesting common clinical strategies for their management.
However, the cross-sectional design of the current study does not allow us to establish any causal or temporal relationship between frailty and PD or prodromal PD. According to our findings, frail individuals had higher odds of being identified with PD or prodromal PD, compared to nonfrail individuals, but reverse causality cannot be rejected. Thus, it could be hypothesized that nonmotor and motor symptoms in PD may cause frailty and participants diagnosed with PD or prodromal PD may bear more possibilities to develop frailty. Moreover, it is possible that frailty and PD/prodromal PD symptoms are possibly co-occurring, triggered by the gradual multisystem decline of aging pathology. Future follow-up will permit us to further explore the direction of the relationship between frailty and prodromal PD probability or PD. Prospective studies are necessary in order to investigate the overlap and specific interaction between the 2 states.
Another limitation of the current study refers to the fact that data on certain MDS prodromal markers, for example, olfactory loss and a few MDS risk markers, such as occupational solvent exposure and substantia nigra hyperechogenicity on transcranial sonography or dopaminergic system positron emission tomography/single photon emission computed tomography were not available in the current study. However, we had information on 13 of 17 markers (8 of 10 prodromal markers), and thus, we believe that prodromal PD probability is accurate. Moreover, the prevalence of prodromal PD found in the current study was similar to that reported in other cohorts of older adults (45).
On the other hand, a strength of this study is the large and representative sample of the older population in Greece, including both urban and nonurban inhabitants. The assessment of frailty with definitions belonging both to the phenotypic and multidomain approach is another major strength. The large amount of data gathered in the HELIAD study allowed us to calculate the prodromal PD probability score including most of the criteria proposed by MDS. Moreover, the markers related to prodromal PD probability were assessed by certified neurologists using both objective and subjective measures of functioning, mobility, and physical and psychological condition, increasing the accuracy of our measurements. Finally, consensus diagnostic meetings of the research team most likely ensured the accurate identification of participants with PD.
Conclusions
In summary, the present study is the first to examine the association between frailty and prodromal PD probability that contributes substantial information to the growing literature demonstrating the common characteristics between frailty and neurological diseases. The findings of the current study have clinical and research implications. Thus, it is important for clinicians to be aware of the increased prevalence of frailty when planning treatment not only in PD, but also in prodromal PD stages. As research is concerned, it would be important to further investigate the underlying biologic pathways of the association between frailty and prodromal PD and even search for potential biological causal links between the 2 conditions.
Funding
This study was supported by the grants IIRG-09133014 (Alzheimer’s Association), 189 10,276/8/9/2011 (ESPA-EU program Excellence Grant, ARISTEIA, co-funded by the European Social Fund and Greek National resources), and DY2b/oik.51657/14.4.2009 (Ministry for Health and Social Solidarity, Greece).
Conflict of Interest
E.N., M.M., M.Y., M.S., G.X., M.H.K., E.D., G.H., P.S., A.N.G., K.P., S.Chat., S.Char., and L.S. report no disclosures relevant to the manuscript. N.S. reports personal fees from Merck Consumer Health, Eisai, and NIH unrelated to this manuscript.
Author Contributions
E.N. and M.M.: data analysis, statistical analysis, and manuscript writing. M.Y., M.S., G.X., M.H.K., E.D., G.H., P.S., A.N.G., K.P., S.Chat., S.Char., and L.S.: critical revision of the manuscript and final approval of the version to be published. N.S.: study design, critical revision of the manuscript and final approval of the version to be published, and study supervision.
References
Author notes
E. Ntanasi and M. Maraki contributed equally to this work.

