


Abstract
Genome-centric analysis of metagenomic samples is a powerful method for understanding the function of microbial communities. Calculating read coverage is a central part of analysis, enabling differential coverage binning for recovery of genomes and estimation of microbial community composition. Coverage is determined by processing read alignments to reference sequences of either contigs or genomes. Per-reference coverage is typically calculated in an ad-hoc manner, with each software package providing its own implementation and specific definition of coverage. Here we present a unified software package CoverM which calculates several coverage statistics for contigs and genomes in an ergonomic and flexible manner. It uses “Mosdepth arrays” for computational efficiency and avoids unnecessary I/O overhead by calculating coverage statistics from streamed read alignment results.
CoverM is free software available at https://github.com/wwood/coverm. CoverM is implemented in Rust, with Python (https://github.com/apcamargo/pycoverm) and Julia (https://github.com/JuliaBinaryWrappers/CoverM_jll.jl) interfaces.
1 Introduction
Microbial communities significantly impact the health of our planet and ourselves personally. Through the advent of genome-centric metagenomics, it has become possible to recover complete or near-complete genomes from these populations through deep sequencing of community DNA. Piecing together sequencing reads into metagenome assembled genomes (MAGs) has become increasingly common and high-throughput, with recovery of tens to hundreds of thousands of genomes from a diverse array of environments (Pasolli et al. 2019, Almeida et al. 2021, Nishimura and Yoshizawa 2022, Schmidt et al. 2024).
A key step in MAG recovery is binning, where assembled contigs are partitioned into groups representing putative genomes. Commonly, contig abundances across samples are calculated based on alignments of reads to contigs. Contigs with similar abundances across many samples are likely to be from the same genome, enabling improved, sequence-agnostic genome recovery (differential coverage binning) (Albertsen et al. 2013). However, the specific algorithms metagenomic binning tools use to derive coverage statistics from read alignments [BAM files (Li et al. 2010)] vary substantially. For instance, some use the number of aligned reads divided by contig length (Wu et al. 2014, Nissen et al. 2021, Pan et al. 2022, 2023). Others calculate a coverage based on the number of reads aligned to each reference position, taking the mean or trimmed mean across all bases in a contig (Imelfort et al. 2014, Kang et al. 2015). Still others find approximate coverage using a k-mer counting approach eschewing the alignment step altogether for faster calculation (Shaw and Yu 2024).
The backend data structure used for coverage calculation can also vary. Notably, “Mosdepth arrays” were shown to be two times faster than naive methods for exact calculation of mean coverage (Pedersen and Quinlan 2018). Mosdepth arrays record the change in the number of mapped segments at each position, such that coverage at a given position can be calculated by summing all preceding values.
Recovered MAGs can be used to estimate the community composition by aligning reads to their contigs and calculating coverage statistics across the genome. For example, calculating the mean coverage for a genome is achieved by summing the number of aligning bases across all contigs in a genome and dividing by their total length. Researchers may also opt to apply filters to prevent genomes being deemed present (i.e. having non-zero coverage) on the basis of a small number of positions having aligned reads (Castro et al. 2018).
Despite the differences between per-contig and per-genome coverage statistics, they are conceptually similar enough to motivate a single tool that calculates both. Here, we present CoverM, which uses Mosdepth arrays to efficiently calculate a number of per-contig and per-genome coverage statistics.
2 Software implementation
CoverM is a software tool for calculating coverage statistics of contigs or genomes with reads derived from metagenomes or microbial isolates (Fig. 1). It is written in the Rust programming language, relying on independent tools for genome dereplication (Aroney et al. 2024) and read alignment (Li 2013, 2018, Sahlin 2022). It makes substantial use of rust-htslib (Köster 2016), which provides Rust bindings to HTSlib (Bonfield et al. 2021) for parsing intermediate alignment (BAM) files.
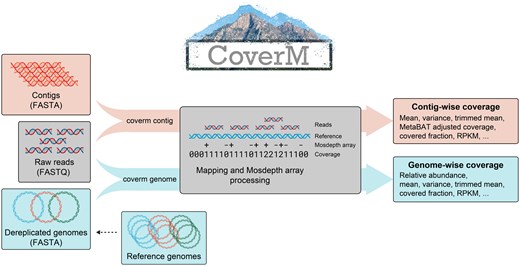
CoverM operation. In “contig” mode, reads are aligned to contigs, alignments are sorted by reference position, a “Mosdepth array” is constructed and then coverage statistics are calculated for each contig. In “genome” mode, a Mosdepth array is similarly constructed for each contig in the genome, and then coverage statistics are reported for each genome.
CoverM can be compiled locally using the standard cargo method in the Rust ecosystem, by downloading the source code from the repository directly or by downloading a version statically compiled with musl libc from https://github.com/wwood/coverm/releases. Apart from the standard command line version, Python and Julia interfaces to CoverM are also available.
The inputs to CoverM are metagenomic reads (or precalculated BAM files) and reference sequences: either contigs or genomes. Since aligning against multiple near-identical reference genomes can distort read alignments, CoverM uses Galah (Aroney et al. 2024) to dereplicate input genomes, interpreting ANI calculated by skani (Shaw and Yu 2023), FastANI (Jain et al. 2018), or Dashing (Baker and Langmead 2019).
Next, the reads are aligned to the reference sequences using Strobealign (Sahlin 2022), Minimap2 (Li 2018), or BWA (Li 2013). Spurious alignments can be filtered on the basis of identity, alignment length, or percent of the read aligned. Paired reads can be filtered independently or together with their mate. The filtered alignments are then processed using Mosdepth arrays to calculate a range of coverage statistics (Table 1). The coverage of a genome is aggregated by considering all bases in the genome together. As an additional filtering step, to account for off-target alignment in conserved regions, by default CoverM requires that at least 10% of a genome’s length is covered by at least one read before assigning non-zero coverage.
Overview of calculation methods available in CoverM.a
| Metric | Description |
|---|---|
| Mean (default contig mode) | Average coverage of each base, after excluding the ends of contigs. For genome mode, the average of contigs in each genome is calculated, weighting each contig by its length. |
| Relative abundance (default genome mode) | Per-genome community profile percentage. See Equation (1). Genome mode only. |
| Variance | Variance of each base’s coverage, after excluding the ends of contigs. For genome mode, the variance is of all bases in the genome. |
| MetaBAT adjusted coverage | Identical output to the MetaBAT (Kang et al. 2015) coverage calculation tool. |
| Trimmed mean | Mean coverage after removing the most covered and least covered bases (default 5%). For genome mode, all bases in the genome are considered together. |
| Covered fraction | Fraction of bases covered by at least one read, after excluding the ends of contigs. For genome mode, all bases in the genome are considered together. |
| Covered bases | Number of bases covered by at least one read, after excluding the ends of contigs. For genome mode, all bases in the genome are considered together. |
| Length | Length of each reference in base pairs. |
| Count | Number of reads aligned. |
| Reads per base | Number of reads aligned divided by reference length. |
| RPKM | Reads aligned to reference per kilobase per million reads aligned (Mortazavi et al. 2008). |
| TPM | Reads aligned to reference per million reads aligned (Li et al. 2010). |
The “reference” referred to in the description is either a contig or a set of contigs constituting a genome. The “ends of contigs” refers to the initial and final 75 bp of the contigs as per MetaBAT (Kang et al. 2015).
In Equation (1), is the estimated relative abundance of the lineage as a percentage, is the calculated mean coverage of that lineage, is the sum of the mean coverage of all genomes, is the number of reads aligning to any genome, and is the total number of reads in the sequencing library. Implicitly, this formula assumes that (i) the average genome size of community members is the same between genomes in the reference set and those that are missing, and (ii) species with reference genomes are roughly complete and uncontaminated.
3 Conclusion
CoverM provides an efficient calculation method for several coverage metrics applicable to contig-based (metagenomic binning) and genome-based (community profiling) tasks. The implementation is flexible, with >50 arguments and options for controlling input/output formats, alignment, filtering, dereplication, and coverage metric.
Conflict of interest: None declared.
Funding
This work was supported by the EMERGE National Science Foundation (NSF) Biology Integration Institute [2022070]; Genomic Science Program of the United States Department of Energy (DOE) Office of Biological and Environmental Research (BER) [DE-SC0004632, DE-SC0010580, and DE-SC0016440]; Australian Research Council [DE160100248 to B.J.W. and FT210100521 to B.J.W.]; and the São Paulo Research Foundation (FAPESP) [process number 2018/04240-0 to A.P.C.]. The work conducted by the US Department of Energy Joint Genome Institute (https://ror.org/04xm1d337) is supported by the US Department of Energy Office of Science user facilities, operated under contract no. DE-AC02-05CH11231.

