


Abstract
With the rapid growth of genetic data linked to electronic health record (EHR) data in huge cohorts, large-scale phenome-wide association study (PheWAS) have become powerful discovery tools in biomedical research. PheWAS is an analysis method to study phenotype associations utilizing longitudinal EHR data. Previous PheWAS packages were developed mostly with smaller datasets and with earlier PheWAS approaches. PheTK was designed to simplify analysis and efficiently handle biobank-scale data. PheTK uses multithreading and supports a full PheWAS workflow including extraction of data from OMOP databases and Hail matrix tables as well as PheWAS analysis for both phecode version 1.2 and phecodeX. Benchmarking results showed PheTK took 64% less time than the R PheWAS package to complete the same workflow. PheTK can be run locally or on cloud platforms such as the All of Us Researcher Workbench (All of Us) or the UK Biobank (UKB) Research Analysis Platform (RAP).
The PheTK package is freely available on the Python Package Index, on GitHub under GNU General Public License (GPL-3) at https://github.com/nhgritctran/PheTK, and on Zenodo, DOI 10.5281/zenodo.14217954, at https://doi.org/10.5281/zenodo.14217954. PheTK is implemented in Python and platform independent.
1 Introduction
Since the introduction of phenome-wide association studies (PheWAS) over a decade ago, it has become a powerful technique to study the association of genetic variants and phenotypic variations across human populations (Denny et al. 2010, Bastarache et al. 2022). A PubMed search in December 2023, using the search terms of “PheWAS” or “phenome-wide association” in Title/Abstract field, returned 679 publications, from only 3 publications in 2010 to 159 publications in 2023, conducted in many biobanks and countries, including All of Us (USA), UK Biobank (UKB), BioBank Japan, and many others (Millwood et al. 2016, Rao et al. 2018, Dofuku et al. 2023, Schlueter et al. 2023). PheWAS has been used to address different scientific objectives, such as refining results in conjunction with genome-wide association studies (GWAS), studying comorbidities and precision subsets of disease, and evaluating potential repurposing of medications and predicting adverse drug reactions (Bastarache et al. 2022).
The rapid development in sequencing technology, computational power, and cloud infrastructure has led to significant increase in genetic and phenotype data in major biobanks worldwide. In 2023, UKB released whole genome sequencing (WGS) data on nearly 500 000 participants linked to decades of health record data (Callaway 2023), and All of Us increased their WGS data to ∼245 000 participants and 40+ years of health record data (Ginsburg et al. 2023). This enormous amount of available data can create a barrier for researchers due to the potential costs and time-consuming nature of analysis. Moreover, data are often organized in different formats, e.g. VCF, Plink or Hail formats for genetic data and Observational Medical Outcome Partnership (OMOP) for health data, which require specific technical knowledge to utilize effectively.
Many packages have been developed for PheWAS, such as the R PheWAS package (Carroll et al. 2014), PHESANT (Millard et al. 2018), or pyPheWAS (Kerley et al. 2022). However, these packages face certain limitations, including utilizing single-threaded computational approaches, lacking support for common data models, tools to assist with major steps in a PheWAS workflow, and/or lacking newer phecodeX implementation, which expands the number of phecodes to >3600. To address these limitations, we developed PheTK, an efficient Python package supporting end-to-end standard PheWAS analyses.
2 Materials and methods
2.1 General PheWAS workflow and PheTK main functionalities
PheTK was developed to handle large datasets quickly, utilizing specific optimizations and multithreading. Moreover, PheTK supports routine procedures such as extraction of variant data from Hail Matrix tables, a scalable data storage format (Hail Team 2008), and phenotype data from OMOP databases. The package is currently structured into four main modules—Cohort, Phecode, PheWAS, and Plot—which assist users with various steps of a complete PheWAS analysis pipeline (Fig. 1; Supplementary Table S1). Users have the option to use their own data or utilize PheTK’s modules for these tasks. In addition, we created Demo module to help new users familiar with PheWAS.
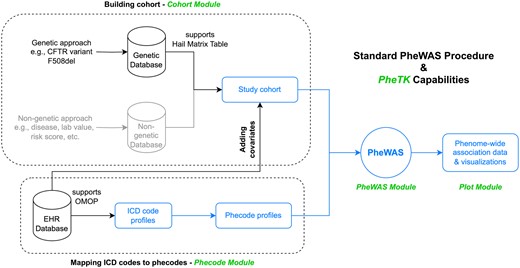
Standard PheWAS procedure and PheTK capabilities. Components in black and blue colors (all components except building cohort from a non-genetic database) are supported by PheTK. The blue components (processing data and running PheWAS from a study cohort and ICD code profiles of the cohort) were assessed in benchmark test against the R PheWAS package. PheTK module names are in green.
2.2 Building a cohort
The PheTK Cohort module gathers independent variables for PheWAS, including the genetic variant and/or supported covariates. It includes a function to easily extract genetic data stored in Hail MatrixTables, a widely used data storage format for biobank level databases including All of Us. By providing chromosome, genomic position, alleles, and how to encode them, the function takes a MatrixTable input and returns a cohort with participants and their encoded genotype status. In addition, the Cohort module supports generation of common covariates, such as age at last event, sex at birth, EHR (electronic health record) length, and others from OMOP databases, which is widely adopted in the field of health informatics and usually requires knowledge of SQL to query data. For All of Us users, PheTK can also extract All of Us pre-calculated genetic principal components (PCs) to be used as covariates. PheTK uses a combination of SQL queries and subsequent data processing to obtain covariate data based on user inputs.
2.3 Phecode mapping
A core component of a PheWAS analysis workflow is mapping International Classification of Disease (ICD) codes to phecodes. The Phecode module retrieves ICD codes (supporting ICD versions 9-CM, 10, and 10-CM) from compatible OMOP databases and subsequently maps and aggregates ICD codes to phecodes, currently supporting both version 1.2 and the recently released phecodeX 1.0 (Shuey et al. 2023). Users can also provide their own ICD code data, or their own ICD to phecode map, as an input into the phecode mapping function within the Phecode module to generate phecode counts.
2.4 Statistical analysis
With PheTK, users can customize settings for their analysis, such as the minimum phecode count required to define a case, the minimum number of cases to study, and whether to apply phecode exclusion criteria, as in the R PheWAS package (Carroll et al. 2014). The PheWAS module accepts cohort data and phenotype data either generated by the Cohort and Phecode modules or provided directly by users as inputs. For each phecode, the input data is processed and divided into case/control groups which are then used in logistic regression as described in the R PheWAS package (Carroll et al. 2014). In phecode regression of a standard PheWAS, status of having a phecode is the dependent variable, and the variable of interest and other covariates are independent variables. Parallel processing through multithreading allows for efficient execution of these regressions. The module provides summary statistics for each phecode, including the number of cases and controls, P-value, beta coefficient, confidence intervals, odds ratio, and Bonferroni correction threshold of the independent variable of interest.
2.5 Visualization
The Plot module offers support for Manhattan and volcano plots for PheWAS result visualization. This module comes with multiple customization options, such as labeling specific phenotypes or certain categories, labeling by order of P-values or beta coefficients, changing label colors, marker sizes, figure resolution, and more. This module was built on top of Python matplotlib library (Hunter 2007), which could be used for further customizations.
2.6 Application examples and performance benchmarking
To demonstrate the package, we performed a PheWAS for one genetic and one nongenetic phenotype in All of Us. Our evaluation included a benchmarking test comparing PheTK with the R PheWAS package, which also supports multithreading. We assessed PheTK’s performance across various working environments, including All of Us, UKB Research Analysis Platform (RAP), and a laptop, utilizing both phecode 1.2 and phecodeX to demonstrate its flexibility.
A genetic cohort consisting of 181 776 participants was selected from the All of Us database based on the presence or absence of the most common pathogenic variant causing cystic fibrosis, CFTR F508del or rs113993960 (Lukacs and Verkman 2012). This variant was identified as chr7-117559590-ATCT-A using All of Us genomic data browser. Phenotype profiles of all cohort participants were generated, and PheWAS was performed using an additive model adjusted for age at last event, sex at birth, and 10 PCs provided by All of Us.
In addition, a uric acid study cohort of 9170 participants was created to demonstrate a PheWAS analysis with a nongenetic cohort using a continuous variable. Urate (mass/volume) in serum or plasma measurements with proper unit and values were retrieved from the All of Us OMOP database using custom SQL queries. Participants with at least three urate measurements were selected and all-time average urate values were calculated and used as variable of interest. PheWAS was performed adjusted for age at last event, sex at birth, and 10 PCs. To demonstrate PheTK’s compatibility with different phecode versions, phecode 1.2 was used for the CFTR PheWAS and phecodeX was used for the uric acid PheWAS.
We used the CFTR study as a test case for benchmarking PheTK performance compared to the R PheWAS package. The test environment, setup on the All of Us, was a standard virtual machine (VM) with 96 CPUs and 360 GB RAM. Both packages were set to use 64 CPUs to ensure sufficient computing power for background tasks, if any. We benchmarked the same processes, which included mapping ICD codes to phecodes, subsequent case/control processing for each phecode, and logistic regressions of qualified phecodes (minimum case number = 20, minimum phecode count = 2; Fig. 1). All component times were combined to get the total runtime of each package.
To demonstrate package compatibility with other platforms, we performed a similar CFTR F508del PheWAS study on UKB RAP. We generated Hail matrix table from UKB whole exome sequencing (WES) pVCF data and used the Cohort module to create F508del cohort from the matrix table. We used phecode 1.2 for this cohort of 469 007 participants adjusted for age at recruitment, sex, and 10 PCs. VM configuration was 96 CPUs and 375 GB RAM with number of CPUs used set to 64 in PheTK settings. Finally, we ran PheWAS analysis of the same UKB CFTR cohort on a MacBook Pro M2 Pro 12 CPU cores 32 GB RAM using phecodeX, which had nearly twice as many phecodes than phecode 1.2.
3 Results and discussion
3.1 Application examples
PheWAS is a powerful yet complex discovery tool with multiple steps that deal with different types of data in different formats. PheTK can accelerate scientific discoveries by providing tools for quickly tackling common technical tasks with support for common data formats. As expected, the CFTR PheWAS demonstration PheWAS in All of Us found highly significant associations with cystic fibrosis (P-value = 1.3 × 10−51, OR = 26.8) and other related phenotypes (Supplementary Fig. S1A and B). Every step was performed exclusively by calling PheTK modules without the need to write custom scripts, with no knowledge of Hail, OMOP, or SQL required. Total runtime was <15 min, from generating a cohort to result visualization.
The UKB CFTR PheWAS on RAP completed successfully in 11.9 min using phecode 1.2. While having a significantly larger cohort size than the All of Us test cohort (469 007 versus 181 776 participants), there were only 1423/1624 phecodes that met count thresholds versus 1765/1816 phecodes in the All of Us CFTR PheWAS. As with the All of Us analysis, cystic fibrosis (P-value = 1.9 × 10⁻¹⁰, OR = 10.38) was associated with CFTR F508del (Supplementary Fig. S1C).
In the nongenetic approach demonstration, the uric acid PheWAS with phecodeX workflow executed by PheTK modules took 5 min to complete with expected associations found between high plasma/serum urate concentration and gout (P-value = 2.2 × 10−184, OR = 1.83) and chronic kidney disease (P-value = 2.2 × 10−165, OR = 1.64). These results are visualized using the Manhattan and volcano plotting options (Fig. 2). Except for custom SQL queries to generate the cohort from lab measurement data, all other steps were performed by calling PheTK modules.
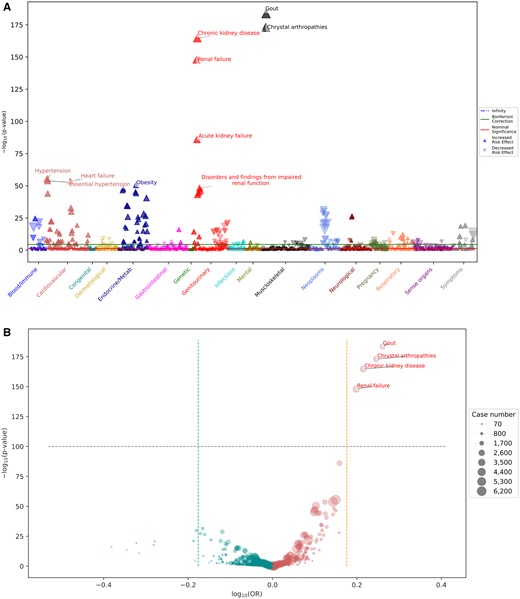
Uric acid PheWAS analysis with phecodeX. (A) Manhattan plot displays significant positive associations between uric acid level and various phenotypes, including gout, chronic kidney disease, and others. (B) Volcano plot highlights the significant phenotypes with large effect sizes, such as gout, crystal arthropathies, chronic kidney disease, and renal failure.
3.2 Benchmarking and other performance tests
In the benchmark test, PheTK took 64% less time than the R PheWAS package to finish the same workflow (9.9 min compared to 27.3 min). Based on the cost of the test environment of $4.65 per hour, the test workflow cost $0.77 and $2.12 for PheTK and the R PheWAS, respectively. It should be noted that this VM configuration was chosen to avoid bottlenecks due to insufficient computing resources, and cheaper configurations could also be used.
We then tested PheTK performance in limited computing resources of a MacBook Pro M2 Pro laptop by running PheWAS regressions with phecodeX using the largest dataset in this publication (469 007 UKB CFTR cohort). PheTK successfully completed the analysis in ∼81 min with 2192/2721 phecodes tested, with cystic fibrosis as most significant phenotype (Supplementary Fig. S1D).
3.3 Further discussion
PheTK currently supports logistic regression. While this is a common statistical analysis method in PheWAS, it also has limitations. A common challenge is case–control imbalance for rarer phenotypes or genetic variants. This can be addressed by alternative methods such as saddle point approximation (Daniels 1954) or Firth regression (Firth 1993), which we are evaluating for future implementation in PheTK.
Another consideration in running PheWAS analysis is genetic similarity and sample relatedness. This is a well-known challenge in GWAS (Kang et al. 2008) which could cause inflated false positive rates, and it could have a similar effect in PheWAS. Biobanks, such as All of Us, often provide users with pre-calculated PCs and sample kinship relatedness data from genetic data. We encourage users to consider utilizing such resources to improve PheWAS accuracy. Currently, PheTK supports extracting All of Us’ pre-calculated PCs data to use as covariates.
To provide users with further information on PheTK performance, we ran additional tests with on synthetic datasets and using different VM configurations on the All of Us researcher workbench or standard GCP machines (Supplementary Fig. S2). We demonstrated that PheTK could run PheWAS for a one million participant cohort on a machine with as low as 4 CPU cores, allowing users to work with large datasets on limited computing resources; on the other hand, having access to more computing cores or newer hardware noticeably improved PheTK performance and reduced runtime, thanks to the multithreading approach and newer hardware efficiency.
4 Conclusion
PheTK provides scalable performance across large datasets on different platforms. The software can be installed via PyPi and run on any Python environment, including cloud VMs, institutional HPCs, or local workstations or laptops. While applicable to any ICD and genetic data, PheTK has been optimized to simplify the steps for All of Us and other biobanks with similar data structures. We plan to add support for other platforms, standard data formats, and additional analysis methods over time. This would also improve PheTK’s performance in studies with small cohort sizes.
Acknowledgements
We would like to express our gratitude to internal and external collaborators, including all Denny lab members, the Cohort Analytics Core at the National Human Genome Research Institute (NHGRI), and Dr Jason Karnes and Dr Kiana Martinez from University of Arizona, who kindly tested the package and provided essential feedback, greatly improving this work. We would like to extend our gratitude to Dr Tracey Ferrara (NHGRI) for helping with manuscript review and administrative assistance. We would also like to thank all the participants of the All of Us Research Program and UK Biobank, without whom such large-scale research would not be possible.
Supplementary data
Supplementary data are available at Bioinformatics online.
Conflict of interest
None declared.
Funding
This work was supported by the NHGRI Intramural Research Program [ZIA HG200417].
Data availability
The data underlying this article are available on the All of Us Researcher Workbench and the UK Biobank Research Analysis Platform following their guidelines.
References
Hail Team. Hail 0.2. 2008. https://github.com/hail-is/hail

