


Abstract
Estimating genome size using k-mer frequencies, which plays a fundamental role in designing genome sequencing and analysis projects, has remained challenging for polyploid species, i.e., ploidy p > 2. To address this, we introduce “findGSEP,” which is designed based on iterative curve fitting of k-mer frequencies. Precisely, it first disentangles up to p normal distributions by analyzing k-mer frequencies in whole genome sequencing of the focal species. Second, it computes the sizes of genomic regions related to 1∼p (homologous) chromosome(s) using each respective curve fitting, from which it infers the full polyploid and average haploid genome size. “findGSEP” can handle any level of ploidy p, and infer more accurate genome size than other well-known tools, as shown by tests using simulated and real genomic sequencing data of various species including octoploids.
“findGSEP” was implemented as a web server, which is freely available at http://146.56.237.198:3838/findGSEP/. Also, “findGSEP” was implemented as an R package for parallel processing of multiple samples. Source code and tutorial on its installation and usage is available at https://github.com/sperfu/findGSEP.
1 Introduction
Many economically important species are polyploids, such as hexaploid wheat (Triticum aestivum), tetraploid potato (Solanum tuberosum spp. tuberosum), and octoploid strawberry (Fragaria × ananassa) (Hirakawa et al. 2014, Zimin et al. 2017, Sun et al. 2022), contributing to human diets worldwide. To understand the genome evolution of such species, a cost-effective sequencing project is required nowadays, where a key step is to estimate the genome size.
Genome size is used to be estimated by wet-lab techniques, such as flow cytometry and Feulgen microdensitometry, which deliver relative genome size as compared to an internal or external reference standard (McKinnon 2018). Therefore, the accuracy in estimates is highly depending on the reference (Dixon and Stead 1977, Doležel et al. 1998). Thanks to the advancement in genome sequencing technologies with decreasing costs, k-mer frequency analysis has become a popular way for estimating genome size, where a k-mer is substring of length k extracted from a longer DNA sequence or sequencing reads. Each k-mer can be associated with a coverage value, which is its occurrence within the sequencing reads (Pflug et al. 2020). By counting how many k-mers (i.e. frequency or count fi) occurring at a coverage of ci, a k-mer frequency distribution histogram, i.e. (ci, fi), i = 1,2,3,…, can be built up (Al-Qurainy et al. 2021). When examining the k-mer frequency distribution plot for a homozygous species, the distribution of k-mer frequencies tends to resemble a “Poisson” distribution with the peak centered on the average k-mer sequencing depth of the genome, while there is another peak next to y-axis representing sequence errors (Li and Waterman 2003). For heterozygous species, multiple peaks can occur depending on the heterozygosity and ploidy of the genome (Supplementary Figs S1–S14).
Several k-mer analysis tools, such as “CoVest” (Hozza et al. 2015), “Kmergenie” (Chikhi and Medvedev 2014), “findGSE” (Sun et al. 2018), and “GenomeScope” and “GenomeScope” v2.0 (Vurture et al. 2017, Ranallo-Benavidez et al. 2020), have been developed for genome size estimation. However, “findGSE” is only capable of estimating genome size for diploid species due to that its curve fitting is generally performed three times (around heterozygous peak, homozygous peak, and repeats), while only “GenomeScope” v2.0, which uses a mixture modeling approach, can deal with polyploid genomes, but the ploidy is restricted up to six.
Here, we introduce “findGSEP,” which is an upgraded version of “findGSE” with two enhanced features. First, it employs a curve-fitting approach to estimate genome size using k-mer frequencies, which is the same as “findGSE” but with p iterations. Within each iteration, it determines the size of genomes shared by 1, 2, 3, …, p homologous chromsomes, which delivers more insights into the polyploid genome regarding haplotype sharing than “findGSE.” In short, “findGSEP” is capable of handling species with any ploidy, from diploid to polyploid species, including octoploids, while “findGSE” only works for diploid species. Second, it is implemented in both a web application and a standalone R package, making it more accessible for different user preferences. The performance of “findGSEP” was evaluated on both simulated and real datasets, as compared with the popular tool “GenomeScope” v2.0 (referred to as “GenomeScope” afterwards). Tests on real data demonstrated that “findGSEP” had better performance across a diverse array of diploid and polyploid species than “GenomeScope,” especially for those with larger genomes or higher ploidy. Simulated data with true genome size showed that “findGSEP” can deliver highly accurate estimations.
2 Implementation
“findGSEP” was implemented as an open-source command-line R package and a user-friendly web interface built on the “shiny” framework (https://github.com/sperfu/findGSEP-web). Source code, installation and usage of the R package are given at GitHub: https://github.com/sperfu/findGSEP. We have also provided a complete vignette with example data in the R package for users to test. The usage of CLI (command-line interface) follows the same pipeline as the web service. Here, for simplicity, we choose the web platform for the introduction of the overall pipeline (Fig. 1A), with the interface shown in Fig. 1B.
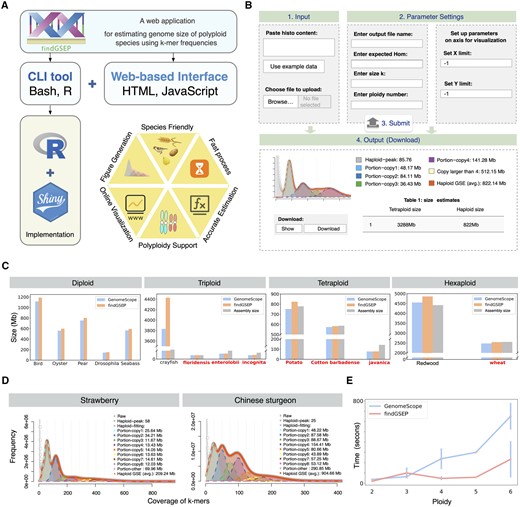
Overview of ‘findGSEP’ and its performance evaluation. (A) ‘findGSEP’ offers a command-line R package and a web-based platform built up using ‘Shiny’, ‘HTML’, and ‘JavaScript’. (B) The online web server requires only four simple steps. First, enter k-mer frequency histogram or upload the respective file. Second, specify parameters on the genome of the species as well as visualization, i.e. value of k, k-mer coverage, ploidy of species, and range of x/y axis to draw plots. Third, submit the job, where the backend server will subsequently generate estimated genome sizes along with fitted curve plots. Fourth, download the result in a pdf file. (C) Performance evaluation of ‘findGSEP’ using species with diverse ploidy levels from diploid to hexaploidy, as compared with estimates given by ‘GenomeScope’ and the respective genome assembly sizes. In most cases (seven out of nine), ‘findGSEP’ generally provides estimation that are relatively closer to the assembly size than ‘GenomeScope’, as colored in red. (D) Specifically, for species with ploidy larger than six, e.g. for the octoploid strawberry and Chinese sturgeon, only ‘findGSEP’ can deliver an accurate estimate. (E) Time efficiency: ‘findGSEP’ was running faster than ‘GenomeScope’, where the error bar represents measurements taken from multiple species having the same ploidy.
The major requirement for “findGSEP” is a histogram file, which can be generated using “jellyfish” (Marçais and Kingsford 2011) or other k-mer counting tools like “kmc” (Kokot et al. 2017) (usage of both k-mer counting tools provided at GitHub repository). The histogram file is composed of a number of tab-separated lines, where for each line, the first number gives the k-mer coverage (ci), while the second gives the frequency or count (fi) of k-mers occurring ci times, i = 1,2,3…. The overall pipeline of “findGSEP” is outlined in Algorithm 1 (with more details in Supplementary Note). Note, the idea underlying “findGSEP” is the same as “findGSE”; however, a minimum of p iterations of curve fittings around Chet, 2*Chet, …, p*Chet are performed, where Chet is the observed k-mer coverage per haplotype chromosome according to the k-mer counting histogram. This can reveal the sizes of genomic regions shared by 1,2,…,p homologous chromosomes.
2.1 Input of “findGSEP”
To run “findGSEP” web server, a minimum set of three input parameters need to be provided at the “Home” page, i.e., the (file of) k-mer counting histogram for the species under consideration, the k-mer coverage C (any value satisfying 2×Chet < C < 3 × Chet), and the ploidy p of the species. For scaling the visualization area of the curve of the k-mer frequencies, the limits on x/y axis can also be set up by users. After clicking the “Submit” button, the server runs in the background to generate the genome size estimates, and visualize the observed and fitted k-mer frequencies.
2.2 Output of “findGSEP”
Outputs can be found at the “Download” page. The size estimates include the average haploid genome size (G), the full genome size (G*p), the sizes of genomic regions being unique to one chromosome, those common to 2∼p homologous chromosomes, as well as repeats. All outputs can be downloaded as a PDF file.
As introduced earlier, most existing tools for genome size estimation are challenged by polyploid genomes with p > 2. “GenomeScope” extends its capability in handling species with p up to six. While “findGSEP” was implemented without such a limitation and thus can be featured by its capability of handling species with any ploidy (Table 1).
Feature of various tools for genome size estimation.
| Functions | findGSEP | GenomeScope | CoVest | Kmergenie |
|---|---|---|---|---|
| CLI tool | Yes | Yes | Yes | Yes |
| Online server | Yes | Yes | / | / |
| Histogram upload | Yes | Yes | / | / |
| Histogram type-in | Yes | / | / | / |
| No ploidy limit | Yes | / | / | / |
| Functions | findGSEP | GenomeScope | CoVest | Kmergenie |
|---|---|---|---|---|
| CLI tool | Yes | Yes | Yes | Yes |
| Online server | Yes | Yes | / | / |
| Histogram upload | Yes | Yes | / | / |
| Histogram type-in | Yes | / | / | / |
| No ploidy limit | Yes | / | / | / |
findGSEP
Input: p, C, and a file of k-mer count/frequency generated from whole-genome sequencing data of the species of interest
Output: average haploid genome size G
1: For i in 1: p
2: *Scale raw k-mer counts to smaller values according to C
3: *Fill in missing data using an approximate interpolation method
4: Fit k-mer counts shared by i homologous chromosomes following a normal distribution model (Sun et al. 2018)
5: *Scale k-mer counts from curve fitting to the level of raw counts
6: If (i == 1)//get k-mer coverage per haplotype chromosome
7: Chet = k-mer coverage at the peak of the curve
8: End If
9. Estimate region size as gi = sum(fitted k-mer counts)/(p*Chet)
10: End for
11: Estimate repeat size gp+1, where gp+1 = sum(the remaining k-mer counts after the last k-mer fitting)/(p*Chet)
12. Visualize the raw and fitted k-mer counts
13: Return genome size G as sum(gi | i = 1: (p + 1))
*Note 1, for “scale,” “fill” operation, see Supplementary note
3 Results
To demonstrate the performance of “findGSEP”, we carried out assessment by comparing it to another tool, “GenomeScope”, across a diverse set of real polyploid species and simulated data. All the histogram files and corresponding accession numbers are available in (Supplementary Table S1). We executed the CLI versions of both tools. All the parameter settings for “findGSEP” is shown in Supplementary Table S1, while “GenomeScope” was run with default parameter settings.
We first tested “findGSEP” on simulated genomes with various ploidy, using Arabidopsis thaliana sequences (∼135 Mb each) recently assembled by Lian et al. (2024). Genomes with ploidy levels ranging from 3 to 8 were simulated by combining different Arabidopsis genomes, where the total sequence length (divided by the ploidy number) was taken as the true genome size, each with three replicates. Short reads were then simulated from these polyploid genomes using the pirs (Hu et al. 2012). “Jellyfish” was used to generate k-mer frequency histogram files from the simulated short reads. These histograms were then taken by “findGSEP” to predict the genome size. The estimated sizes were highly consistent to the true sizes, as shown in Supplementary Fig. S15 and Supplementary Table S2, demonstrating that our method accurately predicts genome sizes for polyploid genomes, particularly in comparison with “GenomeScope,” which cannot achieve accurate estimations for species with ploidy over six (Supplementary Fig. S16).
We then analyse on the real data for various species. Results showed that “findGSEP” tends to produce larger size estimates than “GenomeScope” (Fig. 1C), where the differences can be significant, e.g. for crayfish, up to 1000 Mb. The size estimates given “GenomeScope” were sometimes even lower than the assembly sizes (e.g. for potato), which indicated that it might have underestimated the genome size. In contrast, the estimates of “findGSEP” were closer to the assembly sizes than “GenomeScope,” for seven out of nine species (Fig. 1C, with name of species in red). On the other hand, the assembly sizes of enterolobii, incognita, and javanica were larger than the estimates by both tools, probably indicating that there were a high percentage of haplotype-resolved contigs. Particularly, for octoploid strawberry and Chinese sturgeon (Wang et al. 2024), only “findGSEP” was able to deliver an accurate estimation of 207 and 905 Mb, while “GenomeScope” gave 667 and 586 Mb (Fig. 1D and Supplementary Fig. S17).
Also, we evaluated time-efficiency of both methods with the genome sequencing data of diploid, polyploid species (p from 2 to 6). “findGSEP” showed higher efficiency with respective to ploidy values than “GenomeScope” (Fig. 1E and Supplementary Table S3).
4 Discussion
“findGSEP” was developed to provide an easy-to-use interactive tool for estimating genome size using k-mer frequencies. The tool works for species with any ploidy, and as far as we know, it is the only tool that can perform the task for species with ploidy higher than six. “findGSEP” offers flexibility in usage, either through a standalone version of the R package or an online web server, and produces publication-quality figures. Currently, it still requires a user to input a ploidy estimate. To leave out this requirement, one related project is ongoing, aiming to further enhance the tool with automatic ploidy number estimation.
Author contributions
Laiyi Fu (Conceptualization, Methodology, Software, Investigation, Visualization, Writing—original draft, Writing—review & editing), Yanxin Xie (Investigation, Writing—original draft, Writing—review & editing), Shunkang Ling (Software, Investigation, Writing—review & editing), Ying Wang (Investigation, Writing—review & editing), Binzhong Wang (Data curation, Writing—review & editing), Hejun Du (Data curation, Writing—review & editing), Qinke Peng (Supervision, Writing—review & editing), Hequan Sun (Conceptualization, Methodology, Supervision, Investigation, Visualization, Writing—original draft, Writing—review & editing).
Supplementary data
Supplementary data are available at Bioinformatics online.
Conflict of interest
None declared.
Funding
This research was supported by Zhejiang Provincial Natural Science Foundation of China (grant number LQ23F020018 to L.F.), National Natural Science Foundation of China (grant number 62303372 to L.F.), Natural Science Basic Research Program of Shaanxi (program number 2023-JC-QN-0737 to L.F.), Natural Science Foundation of Sichuan, China (number 2023NSFSC1416 to L.F.), Young Talent Fund of Xi’an Association for Science and Technology (number 959202313033 to L.F.), the Fundamental Research Funds for the Central Universities (xzy012024091 to L.F.), project funded by China Postdoctoral Science Foundation (number 2023M742794 to L.F.) and Postdoctoral Research Project in Shaanxi Province (to L.F.), Research Fund for Young Talent Plans of Xi’an Jiaotong University (number KZ6J007 to H.S.), and the National Natural Science Foundation of China (number GYKP034 to H.S.).
References
Hozza M, Vinař T, and Brejová B. How big is that genome? Estimating genome size and coverage from k-mer abundance spectra. In: String Processing and Information Retrieval: 22nd International Symposium, SPIRE 2015, London, UK, September 1–4, 2015, Proceedings 22. Springer International Publishing, 2015, 199–209.

