


Abstract
Model quality assessment is a crucial part of protein structure prediction and a gateway to proper usage of models in biomedical applications. Many methods have been proposed for assessing the quality of structural models of protein monomers, but few methods for evaluating protein complex models. As protein complex structure prediction becomes a new challenge, there is an urgent need for model quality assessment methods that can accurately assess the accuracy of interface residues of complex structures.
Here, we present DeepUMQA3, a web server for evaluating the accuracy of interface residues of protein complex structures using deep neural networks. For an input complex structure, features are extracted from three levels of overall complex, intra-monomer, and inter-monomer, and an improved deep residual neural network is used to predict per-residue lDDT and interface residue accuracy. DeepUMQA3 ranks first in the blind test of interface residue accuracy estimation in CASP15, with Pearson, Spearman, and AUC of 0.564, 0.535, and 0.755 under the lDDT measurement, which are 17.6%, 23.6%, and 10.9% higher than the second best method, respectively. DeepUMQA3 can also assess the accuracy of all residues in the entire complex and distinguish high- and low-precision residues.
The web sever of DeepUMQA3 are freely available at http://zhanglab-bioinf.com/DeepUMQA_server/.
1 Introduction
Predicting the three-dimensional structure of proteins is one of the major basic research issues in the field of bioinformatics, and it is important for understanding protein functions, innovative drug development, and disease treatment (Senior et al. 2020, Baek et al. 2021). Structural prediction methods typically generate many alternative models, which are then evaluated using model quality assessment procedures to select the best model and/or further guide model refinement (Liu et al. 2020, Zheng et al. 2021). Estimation of model accuracy has been an independent prediction category for CASP since 2007 (Kwon et al. 2021). According to the number of models used, model quality assessment (MQA) or estimation of model accuracy (EMA) methods can be divided into single-model methods (Cao et al. 2017, Olechnovič and Venclovas 2017, Uziela et al. 2017, Shuvo et al. 2020) and multi-model (consensus) methods (Cheng et al. 2019, McGuffin et al. 2021, Ye et al. 2021). The multi-model methods usually takes a model pool as the input and use information from other protein models in the model pool to evaluate the accuracy of the current model, and its performance depends largely on the number and diversity of protein models in the input model pool. The single model methods directly evaluate a single model without dependence on other models, so it has received more and more attention and research (Pages̀ et al. 2019, Baldassarre et al. 2021, Hiranuma et al. 2021).
In our previous work on the single-model method DeepUMQA (Guo et al. 2022), we designed residue-level Ultrafast Shape Recognition (USR) to effectively capture the relationship between residues and protein topology, and utilized convolutional neural networks to predict the accuracy of local residues. DeepUMQA2 (Liu et al. 2023b) further integrates co-evolution-based sequence features and template-based structural features to complement the shared properties between different models of the same protein, and uses an improved neural network to predict the accuracy of local residues. . As the protein monomer structure prediction problem has been largely solved, the structure prediction of protein complexes has become the new challenge (Jumper et al. 2021). Therefore, methods that can accurately assess the structural quality of complexes are needed (Kwon et al. 2021). In CASP15, the EMA category was changed from protein monomer assessment to protein complex assessment.
In this work, we proposed DeepUMQA3 web server to provide fast and accurate interface residue and per-residue accuracy prediction services for protein complexes. On the basis of previous versions, new features were designed for complex structures, and the accuracy of each residue and interface residues were predicted using an deep neural network. DeepUMQA3 ranked first in the accuracy estimation of protein complex interface residues in CASP15.
2 Materials and methods
The flowchart of DeepUMQA3 is shown in Fig. 1. DeepUMQA3 describes the protein complex structures from three levels: overall complex level, intra-monomer level, and inter-monomer level. At the level of overall complex, the protein complex is regarded as a whole, and features independent of residue order were extracted, including overall USR, residue voxelization (Pages̀ et al. 2019), inter-residue distance and orientations (Yang et al. 2020), and amino acid properties (Henikoff and Henikoff 1992, Meiler et al. 2001). At the level of intra-monomer, the features of each monomer are extracted separately, including the sequence embedding generated by ESM-1b (Lin et al. 2023), secondary structure (Kabsch and Sander 1983), and Rosetta energy terms (Leaver-Fay et al. 2011). At the inter-monomer level, the attention map of the inter-monomer paired sequence (Lin et al. 2023) was used to describe the sequence relationship between monomers. In addition, inter-monomer USR is designed to describe the relationship between residues in one monomer and topologies of other monomers. The features of these three levels were fed into a convolutional neural network coupled with triangular update and axial attention to predict the per-residue lDDT (Mariani et al. 2013) and interface residues accuracy. A detailed description of the method can be found in the invited paper for CASP15 (Liu et al. 2023a).
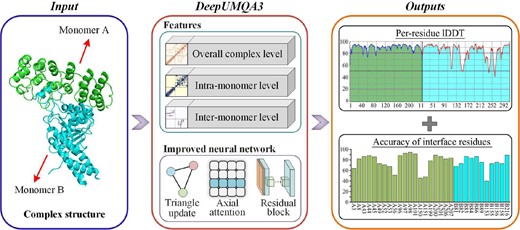
The flowchart of DeepUMQA3. For the input complex structure, it is described from three aspects: overall complex features, intra-monomer features, and inter-monomer features. Then, the extracted features are fed into a residual neural network coupled with triangle update and axial attention to predict the lDDT of each residue and the accuracy of the interface residues.
3 Results
3.1 Performance of DeepUMQA3
DeepUMQA3 (Group name: GuijunLab-RocketX) participated in the blind test of the EMA of CASP15 and ranked first in the accuracy estimation of interface residues (see Supplementary Fig. S1). The performance of the participating methods of interface residue accuracy estimation in CASP15 is shown in Table 1.
The performance of different MQA methods in the interface residues accuracy estimation blind test of CASP15.a,b
| Method | lDDT | CAD | ||||
|---|---|---|---|---|---|---|
| Pearson | Spearman | AUC | Pearson | Spearman | AUC | |
| DeepUMQA3 | 0.564 | 0.535 | 0.755 | 0.505 | 0.456 | 0.714 |
| ModFOLDdockS | 0.455 | 0.416 | 0.674 | 0.420 | 0.379 | 0.660 |
| ModFOLDdockR | 0.476 | 0.433 | 0.681 | 0.411 | 0.369 | 0.651 |
| VoroIF | 0.333 | 0.339 | 0.664 | 0.272 | 0.271 | 0.619 |
| Venclovas | 0.332 | 0.338 | 0.664 | 0.271 | 0.271 | 0.619 |
| FoldEver | 0.277 | 0.279 | 0.625 | 0.217 | 0.194 | 0.583 |
| ModFOLDdock | 0.243 | 0.227 | 0.584 | 0.209 | 0.200 | 0.572 |
| APOLLO | 0.192 | 0.213 | 0.565 | 0.156 | 0.159 | 0.549 |
| MULTICOM_deep | 0.091 | 0.094 | 0.538 | 0.082 | 0.091 | 0.534 |
| Manifold | 0.180 | 0.176 | 0.542 | 0.153 | 0.149 | 0.529 |
| DLA-Ranker | 0.100 | 0.112 | 0.529 | 0.093 | 0.095 | 0.526 |
| MASS | 0.151 | 0.172 | 0.527 | 0.141 | 0.152 | 0.521 |
| LAW | 0.169 | 0.168 | 0.525 | 0.143 | 0.133 | 0.513 |
The methods of ModFOLDdock series refer to Edmunds et al. (2023), the method of VoroIF refer to Olechnovič and Venclovas (2023), the method of MULTICOM_deep refer to Roy et al. (2023), and the other methods refer to the abstract of CASP15 (https://predictioncenter.org/casp15/doc/CASP15_Abstracts.pdf).
Pearson and Spearman indicated the correlation between the accuracy of predicted interface residues and the real lDDT/CAD of interface residues. AUC is used to measure the ability of the MQA methods to distinguish high-/low-precision interface residues.
The bold line are the performances of our method.
DeepUMQA3’s Pearson correlation coefficient, Spearman correlation coefficient, and the area under the receiver operating characteristic curve (AUC) on lDDT (Mariani et al. 2013) and CAD (Olechnovič et al. 2013) measurements are significantly much better than those of other participating methods (see Supplementary Fig. S2). For the measurement of lDDT, DeepUMQA3’s Pearson correlation coefficient (0.564) and Spearman correlation coefficient (0.535) were 17.6% and 23.6% higher than the second ranked method, respectively, which was the only method exceeding 0.5. The AUC (0.755) of DeepUMQA3 is 10.9% higher than that of the second ranked method, indicating that DeepUMQA3 is easier to distinguish between high-/low-precision interface residues. DeepUMQA3 achieved the best performance (with highest Pearson correlation coefficient of lDDT) among the top 5 methods in 25 out of 39 targets, three of which were missed at submission and evaluated against the procedures provided by the assessor (see Supplementary Fig. S3). The performance of DeepUMQA3 on homomers and heteromers are also the best among all methods (see Supplementary Table S1). DeepUMQA3 achieved the best performance on four out of five nanobody-antigen complex targets and all three antibody–antigen complex targets, the best among all methods (see Supplementary Table S2 and Supplementary Fig. S4). DeepUMQA3 can not only assess the accuracy of interface residues, but also predict the accuracy of all residues in the entire complex, and can distinguish high-low-precision residues, which may provide important information for future structure refinement (see Supplementary Tables S3, S4 and Supplementary Fig. S4). Supplementary Figure S5 presents an example of DeepUMQA3 evaluating model accuracy on one structural model of the target T1170. It can be found that the predicted lDDT of the interface residues is very close to the real one, and the Pearson correlation coefficient, average residue-wise S-score error (ASE) (Kwon et al. 2021) and AUC are 0.771, 0.941 and 0.872, respectively. For all residues in the complex, the predicted lDDT can accurately capture the changing of residue accuracy, and can easily distinguish high quality and low quality regions from the overall structure. The performance of DeepUMQA3 in the overall accuracy assessment of protein complexes in CASP15 is shown in Supplementary Table S5. The DeepUMQA3 web server is suitable for interface residue accuracy assessment in protein complexes. Although the DeepUMQA3 web server provides global lDDT as a reference, methods such as MULTICOM_qa (Roy et al. 2023), ModFOLDdock (Edmunds et al. 2023), and GraphGPSM (He et al. 2023) are more suitable for global accuracy assessment of protein complexes.
3.2 The web server of DeepUMQA3
The submission page of the web server is shown in Supplementary Fig. S6. The only mandatory input is the query protein complex structure information in PDB format. Users have the option to either input complex structure data in the designated text box, or upload the PDB file of the complex structure. Additionally, they can add multiple complex structures using the “Add model” option, or upload all complex structures that need to be evaluated in a single zip file. For the complex structures submitted by users, DeepUMQA3 first extracts features, then utilizes pretrained network models to predict the accuracy of per-residue lDDT and interface residues, and finally generates a result page. If the user provides an email address, they will receive a task confirmation email after submitting the task and an email with evaluation results and web page when the task is completed. Supplementary Figure S7 demonstrates an example result web page. For each complex structure submitted by the user, the result web page will display the 3D structure, a graph of the per-residue lDDT, and the accuracy of the interface residues for each chain. Users can download each result individually, or download a compressed package of all results. Supplementary Figure S8 shows the runtime of the DeepUMQA3 web server (CPU only) on the 35 CASP15 protein complexes with a length of <3000 amino acids. Supplementary Figure S9 shows the throughput test results of the DeepUMQA3 web server.
Supplementary data
Supplementary data are available at Bioinformatics online.
Conflict of interest
None declared.
Funding
This work was supported by the National Key R&D Program of China [2022ZD0115103], the National Nature Science Foundation of China [62173304], and the Key Project of Zhejiang Provincial Natural Science Foundation of China [LZ20F030002].

