


Abstract
Whole-genome duplication events have long been discovered throughout the evolution of eukaryotes, contributing to genome complexity and biodiversity and leaving traces in the descending organisms. Therefore, an accurate and rapid phylogenomic method is needed to identify the retained duplicated genes on various lineages across the target taxonomy.
Here, we present Tree2GD, an integrated method to identify large-scale gene duplication events by automatically perform multiple procedures, including sequence alignment, recognition of homolog, gene tree/species tree reconciliation, Ks distribution of gene duplicates and synteny analyses. Application of Tree2GD on 2 datasets, 12 metazoan genomes and 68 angiosperms, successfully identifies all reported whole-genome duplication events exhibited by these species, showing effectiveness and efficiency of Tree2GD on phylogenomic analyses of large-scale gene duplications.
Tree2GD is written in Python and C++ and is available at https://github.com/Dee-chen/Tree2gd
Supplementary data are available at Bioinformatics online.
1 Introduction
Whole-genome duplication (WGD), also referred to as polyploidization (Ohno, 1970), is commonly found in histories of diverse eukaryotes (Li et al., 2018; Ren et al., 2018; Van de Peer et al., 2009) including yeast, animals and plants. Recent phylogenomic/phylotranscriptomic analyses in the OneKP study have identified 244 ancient WGDs across Viridiplantae (Leebens-Mack et al., 2019). Gene duplicates yielded from WGDs provide genome complexities and evolutionary novelties that contribute to (Leebens-Mack et al., 2019) the speciation, diversification and biodiversity (Jiao, 2018; Ren et al., 2018; Soltis and Soltis, 2016; Van de Peer et al., 2017).
WGD doubles the chromosomal environment of the genome, creating an additional copy for each gene. These duplicated genes with redundant functions undergo rapid and continuous loss events and gene order rearrangement subsequent to the duplication (Cheng et al., 2018). Nevertheless, the number of the retained gene duplicates (GDs), the scale of conserved gene orders, together with the distribution of divergence time of paralogs provide sufficient evidence to trace the occurrence of WGD events (e.g. Jiao et al., 2011; Leebens-Mack et al., 2019; Ren et al., 2018; Tiley et al., 2018; Vanneste et al., 2013; Yuan et al., 2018; Zhang et al., 2020; Zwaenepoel and Van de Peer, 2019). The synteny analysis strategy has been applied to detect WGD events in many studies, but the detection of synteny blocks requires high-quality genome assembly and gene annotation. Moreover, it has a disadvantage of estimating ancient WGDs with fewer retained synteny blocks, especially when multiple rounds of genome rearrangements occurred and fractionations accumulated during evolution (see an example in Albert et al., 2013). Therefore, it is inevitable to rely on Ks and phylogenomic approaches to detect signals for ancient WGDs (e.g. the angiosperm WGD; Jiao et al., 2011; Leebens-Mack et al., 2019) (Supplementary Table S1).
Phylogenomic approaches, which detect potential duplicated lineages on gene-trees by reconciliation with a species-tree, have been widely applied to identify WGD events in plant genomes (Barker et al., 2016; Cai et al., 2019; Devos et al., 2016; Godden et al., 2019; Guo et al., 2020; Huang et al., 2016, 2020; Jiao et al., 2011; Leebens-Mack et al., 2019; Li and Barker, 2020; Li et al., 2015, 2019a; Ren et al., 2018; Unruh et al., 2018; Xiang et al., 2017; Yang et al., 2015; Zhang et al., 2020; Zwaenepoel and Van de Peer, 2019). Although many tools detecting GDs from phylogenetic trees are currently available, including NOTUNG (Stolzer et al., 2012), MAPS (Li et al., 2015, 2018), PUG (Unruh et al., 2018) and others (Yang et al., 2015), more efforts need to be made by integrating information of multiple features, including Ks distribution of paralogs of different taxonomic levels, conserved gene orders in chromosomes from synteny analysis and reconciliation of species-tree and gene-trees, on the procedures of GD detection and evaluation.
Here, we report a phylogenomic tool, Tree2GD, to discover GDs from multiple genomes automatically by gene-tree/species-tree reconciliation. The method has been applied on the identification of WGDs from both genome and transcriptome data of large plant lineages, e.g. in the studies of Asteraceae (Huang et al., 2016), Rosaceae (Xiang et al., 2017), Cucurbitaceae (Guo et al., 2020), Fabaceae (Zhao et al., 2021), Asterids (Zhang et al., 2022), Angiosperms (Ren et al., 2018) and Ferns (Huang et al., 2020). The results of these studies suggest Tree2GD can successfully detect large-scale GD events when the majority of species in these studies exhibit transcript sequences assembled from transcriptomic data. The Tree2GD pipeline employs a five-step strategy: large-scale all-against-all gene alignment, clustering of gene families (hierarchical orthologous groups), gene-tree and species-tree reconciliation, evaluation of WGDs by a Support Vector Machine (SVM) model based on remained GD number and Ks distribution, and verification by conserved gene orders from synteny analysis. Detected GDs on each clade of a species tree are output for visualization for further phylogenomic analyses (Fig. 1). The python version can be downloaded from https://github.com/Dee-chen/Tree2gd or installed directly through PyPI.
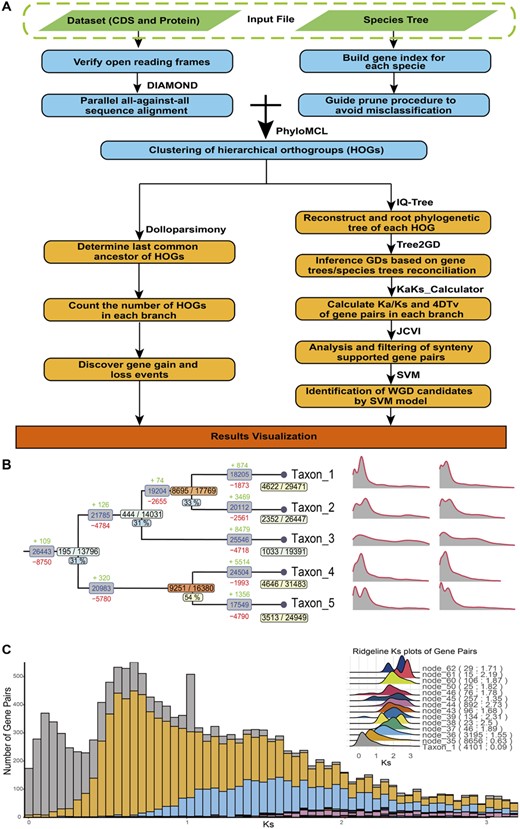
Illustration of the workflow of Tree2GD. (A) Detailed process of Tree2GD detecting gene duplicates (GDs). (B) The summary plot of the software example output, including GDs ratio, HOGs gain/loss, Ks and 4DTv which were mapped on the corresponding position of the species tree. (C) The Ks histogram of the software example output, different colors represent GD gene pairs on different branches
2 Materials and methods
2.1 Large-scale all-against-all sequence alignment
Given annotated genomes for a set of species, the Tree2GD pipeline adopts SeqKit (Wei et al., 2016) to examine the consistency of sequence lengths between proteins and coding sequences (CDS). The Diamond alignment tool (Buchfink et al., 2015) is then employed to build index and performs all-against-all protein alignment for each pair of species. Multi-process is used to perform sequence alignment to reduce computation time, e.g. it took 5 h to compare 2 281 583 protein sequences of 68 plant genomes and enable more sensitive mode using parallel computing. Alignments with e-value larger than 1e−10 are ignored from further analyses by default.
2.2 Identification of HOGs and construction of phylogenetic gene trees
Tree2GD predicts hierarchical ortholog groups (HOG) by using PhyloMCL (Zhou et al., 2020), in which a species tree is adopted to guide the clustering procedure. To reduce the cost of time, HOGs with species number higher than three (default parameter) are used to find gene trees carrying potential gene duplication events shared by two or more species. Alternative thresholds can be applied to infer GDs on clades with abundant taxa. Multiple protein alignment for each HOG is obtained using MUSCLE (Edgar, 2004). Each phylogenetic gene tree is reconstructed using IQ-TREE2 (Minh et al., 2020) with default parameters (‘HKY’ model for CDS trees, ‘LG’ model for protein trees) and an option for ultrafast bootstrap (Hoang et al., 2018) (default: 1000 times) to reduce computation time. It is worth noting that model selection may affect the quality of reconstructed gene trees, and ModelFinder (Kalyaanamoorthy et al., 2017) is employed in Tree2GD pipeline to facilitate measuring the best-fit model for each gene family automatically.
2.3 GD detection by gene-tree and species-tree reconciliation
To detect retained GDs on various lineages, gene trees are reconciled with a reference species tree by using Tree2GD with default parameters. First, each gene tree is rooted according to the topology of the species tree as described in OrthoFinder (Emms and Kelly, 2015), i.e. searching of a bipartition of the gene tree with the best scores measuring either the priority of ancient duplication to species divergence or the correctness of distinguishing of ingroup species from outgroup species. Second, the last common ancestor (LCA) is assigned for each clade on a gene tree determined by the phylogenetic distribution of species carrying the genes. This procedure assigns a ‘taxonomic level’ to each branch. Third, the topology of each branch is examined to discover potential GDs when the two sub-branches of the node share genes from the same species. A GD candidate is then counted when the following requirements are met: (i) the node on the gene tree has a bootstrap value higher than 50%; (ii) the LCAs of the two sub-branches have depths with a difference of zero, i.e. with topology as ((A, B), (A, B)) or a difference of one, i.e. with topology as ((A, B), B) when one of the two sub-branches has suffered gene loss. Here, the depth is calculated by the number of steps it takes to travel from the current node to the root on the species tree; (iii) at least one of the two sub-branches has two or more species to avoid detection of species-specific GDs; and (iv) Numbers of gene duplications are summarized on the species tree by iterating all single gene family trees (Fig. 1B), as described in previous studies (e.g. Ren et al., 2018; Zhang et al., 2020).
2.4 Identification of WGD candidates by SVM based on GD number and Ks distribution
To identify candidates of WGD event of different lineages, Ks values of paralogs were analyzed as described in Ren et al. (2018). Tree2GD classifies paralogous on each gene tree into different groups according to the taxonomic level of duplication event, determined by shared species between sub-clades. For each species, CDS sequences of paralogous are aligned by using MUSCLE (Edgar, 2004) and pal2nal, and KaKs_calculator (Zhang et al., 2006) is adopted to calculate Ka and Ks values (Supplementary Fig. S1). Ks distribution of paralogs of each species on each branch are counted automatically and are graphically presented in output files of Tree2GD. To distinguish WGDs and small-scale duplications (SSDs) based on their differences on observed GD number and Ks value, a Support Vector Machine (SVM) model is applied on the 67 nodes on the angiosperm tree (Supplementary Fig. S2) using the ‘svm’ function of R package ‘e1071’. A 5-fold cross validation is then performed by random classification of the 67 nodes into five groups, among which four groups for training the SVM model and the other for validation on each time (Supplementary Fig. S3). The SVM model based on full data is adopted as the default parameters in Tree2GD to provide a metric for inferring WGDs in plants, and can be determined by the labeled known WGDs in studies.
Although our study is designed to identify the GDs shared by two or more species, species-specific GDs with information of synteny blocks can be detected by Ks analyses [e.g. a burst of 6361 GDs from Nelumbo nucifera, which 4093 were supported by the syntenic gene results, with a median Ks value of 0.53 (Supplementary Fig. S2) corresponding to the median Ks value of 0.54 of lotus syntenic gene pairs (Ming et al., 2013), represents the Nelumbo nucifera specific WGD event (Gui et al., 2018; Ming et al., 2013)].
To further evaluate predicted WGD candidates, we examine the GDs detected by reconciliation of species-tree and gene trees by comparing paralogs with conserved gene order by synteny analysis: (i) synteny blocks are predicted by using the JCVI method based on CDS alignment results and genome annotations; (ii) gene pairs in the list of high quality synteny blocks (named *.lifted.anchors) are adopted for comparison with the gene duplicates detected by Tree2GD; and (iii) gene duplications supported by both synteny and reconciliation are adopted for counting GD number, ratio, Ks counting for further evaluation of WGD candidates.
Tree2GD provides both detailed information for detected GDs (e.g. retention type and taxon coverage to facilitate further analysis) and graphical presentation to manually examine scale and age of GD events. The ggtree v2.2.4 (Yu et al., 2017) is employed to integrate the GD information, Ks peaks, 4DTv peaks and species-tree (see a sample in Supplementary Fig. S2). The detailed Ks results of gene pairs in 26 WGD node are illustrated as histograms (Supplementary Figs. S4–S29), and Ks of each species is presented with HTML format.
3 Results
To test the performance of Tree2GD on GD detection, we apply the phylogenomic approach on an analysis of 204 159 genes of 12 metazoan genomes (Huerta-Cepas et al., 2019). Reconciliation of 12 261 gene trees with the species tree discovers 3247 GDs on the clade before diversification of nine vertebrates (node #7 in Fig. 2A), consisting with previous studies that the ancestor of vertebrates exhibits two successive WGDs (referred to as 1R–2R WGDs) (Sacerdot et al., 2018). Another GD burst (2426 GDs, #6 in Fig. 2A) is found to be shared by two teleost species, and is known as teleost-specific WGD (referred to as Ts3R) (Jaillon et al., 2004). These results suggest that the reconciliation strategy employed by Tree2GD accurately recognize large-scale GDs retained in the 12 metazoan genomes after 1R–2R and Ts3R WGDs.
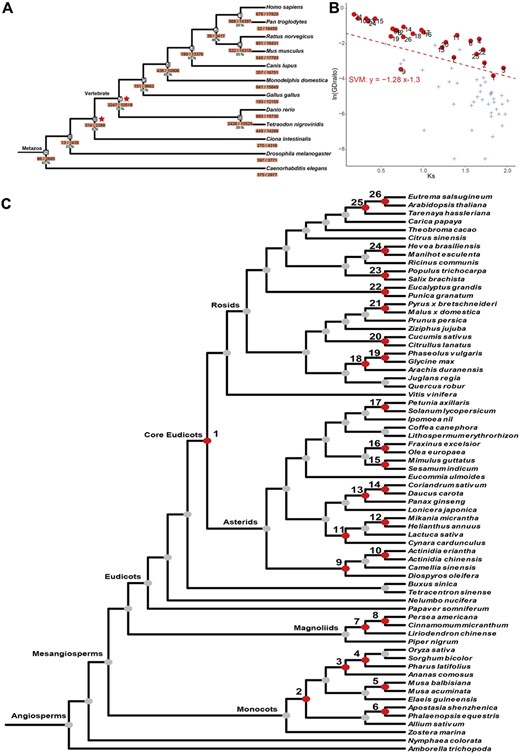
Summary of GD events across 12 Metazoans and 68 angiosperm species detected by Tree2GD. (A) Illustration of GDs discovered in 12 Metazoan genomes with two known WGDs labeled on the species tree. (B) Dot-plot of observed GD numbers and Ks values of all nodes on the angiosperm tree with 68 genomes. Dots denote 26 previously reported WGDs and crosses for SSDs on the other nodes. The dashed line denotes for the separation maximizes the difference between WGDs and SSDs by using a SVM model. A 5-fold cross validation is presented in Supplementary Figure S3. (C) Presentation of large-scale GD events inferred from 68 angiosperm genomes. The 26 known WGD events (red dots) are labeled with #1 to #26 on the tree
Angiosperms have undergone multiple rounds of WGD events, promoting species diversity and the adaptation to environmental changes. We then apply Tree2GD on the analysis of 68 angiosperm genomes, including 51 eudicots, 11 monocots, 4 magnoliids and 2 early-diverging angiosperms (Fig. 2C, Supplementary Table S2). The corresponding species tree of the 68 angiosperms (see the species tree in Fig. 2C) is obtained from the Astral-tree in the 1KP study (Leebens-Mack et al., 2019). A total of 2 281 583 proteins are clustered into 312 261 HOGs for the reconstruction of phylogenetic trees. Gene trees/species tree comparison by Tree2GD reveals 469 095 GDs on clades of different taxonomic levels (Fig. 2C). Among the 67 branches on the species tree, 26 of them are reported to have undergone polyploidization events. Consistently, most of WGDs and small-scale duplications (SSDs) can be distinguished based on their differences on observed GD number and Ks value by using a Support Vector Machine (SVM) model (Fig. 2B). To test the performance of Tree2GD on WGD inference, we employ a 5-fold cross validation and find that the SVM model reaches up to 92% and 88% on recall and precision, respectively, for WGD inference (Supplementary Fig. S3, Supplementary Table S3). Thus, we adopt the model based on full data as the default parameters in Tree2GD to provide a metric for inferring WGDs in plants. For example, 2596 GDs are detected on the last common ancestor of the 3 species of Poaceae (Oryza sativa, Pharus latifolius and Sorghum bicolor) with a median Ks of 1.67, significantly higher than the GD number of SSDs with the similar Ks value. In addition, the pattern of GD retention yielded by Tree2GD can be considered as a measurement for identification of WGD events. Among the 2596 GDs, 1636 of them (62%) retain both two duplicates, providing further evidence for the WGD events experienced on the ancestor of Poaceae. These results suggest that Tree2GD has an excellent potential to discover large-scale GDs accurately from plant genomes with the complex scenario of polyploidization.
Within mesangiosperms, the gamma (#1 in Fig. 2C), tau (#2 in Fig. 2C) and lambda (#7 in Fig. 2C) events are considered to have contributed in a species radiation of core eudicots, monocots and magnoliids (Magnoliales-Laurales), respectively (Landis et al., 2018; Murat et al., 2017; Van de Peer et al., 2017; Zhang et al., 2020). A total of 498 GDs retained in ABAB type after the gamma and 318 ones after the Tau (Supplementary Fig. S1), suggesting these polyploidy events are well supported by gene tree/species tree reconciliation method. However, these clades have undergone dynamic lineage-specific gene loss after polyploidization (Fig. 2C). Detection of the Ka/Ks values of retained gene duplicates suggested most genes underwent strong purifying selection (Ka/Ks1, Supplementary Fig. S1).
Among the WGD events in monocots, two WGD events at the family level, #4 on the LCA of Poaceae (Tang et al., 2010) and #6 on LCA of Orchidaceae (Zhang et al., 2017), and one at the genus level (#5) shared by Musa species (D'Hont et al., 2012), exhibit 2596, 1460 and 17 622 GDs discovered by Tree2GD. In Magnoliids, the WGD on Lauraceae (Chaw et al., 2019; Leebens-Mack et al., 2019) owes 3795 retained GDs (#8, Fig. 2C) shared by Persea americana and Cinnamomum micranthum, with a median Ks value of 0.69 (Supplementary Fig. S22). Among nine large-scale GD events (>300 GDs) detected in asterids, eight of them (#9–17, Fig. 2C) are confirmed as the results of WGDs in previous studies (Badouin et al., 2017; Bombarely et al., 2016; Kim et al., 2018; Leebens-Mack et al., 2019; Li et al., 2019,b; Zhang et al., 2020). Nine WGDs (#18–26, Fig. 2C) in rosids were also identified, including five events in familial/sub-familial level [#18–19 in Fabaceae (Cannon et al., 2015), #20 at Cucurbitaceae (Guo et al., 2020), #21 in Rosaceae (Xiang et al., 2017), #25–26 in Brassicaceae, #23 at Salicaceae (Tuskan et al., 2006)], one in superfamilal level (#22 at Myrtales) (Yuan et al., 2018) and the other (#24) shared by Hevea and Manihot (Cai et al., 2019).
As limited eukaryotes have whole genome sequences available at present, prediction of GDs from annotated gene sequences based on reconciliation and Ks analyses are adopted in many studies, especially for discovering ancient GDs. The Tree2GD detection method we provide has been successfully applied on many studies of various lineages for WGD identification, including Asteraceae (Huang et al., 2016), Rosaceae (Li et al., 2019a; Xiang et al., 2017), Cucurbitaceae (Guo et al., 2020), Asterids (Zhang et al., 2020), Angiosperms (Ren et al., 2018) and Ferns (Huang et al., 2020). The Tree2GD method provides a user-friendly way to infer GDs efficiently and effectively, by integrating multiple steps of phylogenomic analyses, from sequence alignment, homolog clustering, phylogenetic tree reconstruction to gene tree/species tree reconciliation, into one pipeline.
Funding
This work was supported by funds from the National Natural Science Foundation of China [32070247 to J.Q.]; China Postdoctoral Science Foundation [2019M661344 to T.Z.]; and the State Key Laboratory of Genetic Engineering and Ministry of Education Key Laboratory of Biodiversity Science and Ecological Engineering in Fudan University.
Conflict of Interest: none declared.
References
Author notes
The authors wish it to be known that, in their opinion, Duoyuan Chen and Taikui Zhang should be regarded as Joint First Authors.

