


Abstract
Understanding how antibodies specifically interact with their antigens can enable better drug and vaccine design, as well as provide insights into natural immunity. Experimental structural characterization can detail the ‘ground truth’ of antibody–antigen interactions, but computational methods are required to efficiently scale to large-scale studies. To increase prediction accuracy as well as to provide a means to gain new biological insights into these interactions, we have developed a unified deep learning-based framework to predict binding interfaces on both antibodies and antigens.
Our framework leverages three key aspects of antibody–antigen interactions to learn predictive structural representations: (i) since interfaces are formed from multiple residues in spatial proximity, we employ graph convolutions to aggregate properties across local regions in a protein; (ii) since interactions are specific between antibody–antigen pairs, we employ an attention layer to explicitly encode the context of the partner; (iii) since more data are available for general protein–protein interactions, we employ transfer learning to leverage this data as a prior for the specific case of antibody–antigen interactions. We show that this single framework achieves state-of-the-art performance at predicting binding interfaces on both antibodies and antigens, and that each of its three aspects drives additional improvement in the performance. We further show that the attention layer not only improves performance, but also provides a biologically interpretable perspective into the mode of interaction.
The source code is freely available on github at https://github.com/vamships/PECAN.git.
1 Introduction
As one of its mechanisms to combat disease, the immune system develops B cells that secrete antibodies to specifically recognize and either neutralize or help drive functional responses against a pathogen. An antibody recognizes a particular region, called its epitope, on a particular part of the pathogen, called its antigen; the region of the antibody directly involved in the recognition is called its paratope. The interface between an epitope and paratope is crucial to the affinity and specificity of an antibody–antigen interaction, and thus the antibody’s function. Characterizing antibody–antigen interactions at the epitope–paratope resolution can thus reveal mechanisms of immune recognition, and, over a set of antibodies, can even provide insights into the development of the immune response. For example, recent studies have revealed new insights into antibody evolution (Mishra and Mariuzza, 2018; Sok et al., 2013), and have shown that those insights could be used for guiding the affinity maturation process using appropriate immunogens (Briney et al., 2016). Such characterization can also benefit the development of therapeutics and vaccines. For example, therapeutic antibodies are being used to treat many different diseases (Carter, 2006; Holliger and Hudson, 2005), and early development processes typically yield large arrays of candidate antibodies from which to select. Understanding their different recognition mechanisms can aid selection and subsequent development. Similarly, subunit vaccines are being developed to train the immune system against a pathogen by mimicking an important part but without causing actual infection (Briney et al., 2016; Delany et al., 2014; Doria-Rose and Joyce, 2015). Understanding the recognition processes driving beneficial responses, as well as those that are not helpful, can guide the development of these vaccines so as to ensure the desired immune targeting.
Experimental structure determination methods, namely X-ray crystallography, nuclear magnetic resonance spectroscopy and cryoelectron microscopy, provide the gold standard for characterizing antibody–antigen binding modes (Bai et al., 2015; Lee et al., 2015). Unfortunately, they remain expensive and time consuming, and cannot feasibly keep up with the exploding amount of antibody sequence data for which it is desirable to understand antigen recognition, e.g. the millions of sequences obtained from analysis of an immune repertoire (Miho et al., 2018; Truck et al., 2015; Zhu et al., 2013). Alternative experimental methods like H–D exchange mass spectrometry (Gallagher and Hudgens, 2016) and alanine scanning (Weiss et al., 2000) are faster and cheaper, and of lower resolution/confidence, but still require substantial experimental effort per target. Higher-throughput methods such as multiplexed surface plasmon resonance can characterize many interactions simultaneously but do not provide direct localization information (Brooks et al., 2014; Safsten, 2009). Computational methods thus have the most promise to scale to characterization of large numbers of possible epitope–paratope interactions, but it is necessary to ensure that predictions provide sufficient grounds to support further investigations, in terms of overall accuracy as well as the underlying reasoning for a prediction.
Prediction of antibody–antigen binding interfaces can be seen as a special case of predicting protein–protein binding interfaces. However, as discussed above these particular interactions are of significant importance, and the interfaces have their own special characteristics (Esmaielbeiki et al., 2016; Kunik and Ofran, 2013) (as does each different class of protein–protein interaction), specific methods have been developed for epitope prediction and others for paratope prediction. Many methods make predictions based on amino acid sequence alone, e.g. predicting epitopes based on neural networks (Saha and Raghava, 2006), support vector machines (SVMs) (El-Manzalawy et al., 2008; Singh et al., 2013), hidden Markov models (Zhao et al., 2011) and random forests (Jespersen et al., 2017), and paratopes using long short-term memory networks (Deac et al., 2019; Liberis et al., 2018) and random forests (Olimpieri et al., 2013). Though sequence-based methods can perform well on paratope prediction, most sequence-based epitope predictions are limited to the special case of a sequentially contiguous epitope (Yao et al., 2013), whereas in contrast, most epitopes are found to be conformational (distal in sequence, but close in 3D structure) (Regenmortel, 1996; Walter, 1986). Thus we and others focus on structure-based methods that leverage geometric information in making predictions. Fortunately, while the complex structure is not known, in most common scenarios, the structure of the antigen by itself is available, and antibody structure prediction techniques enable confident prediction of most of the antibody’s structure (Sircar, 2012; Sircar et al., 2009). We thus briefly review this body of most closely related work on structure-based prediction of epitopes and paratopes.
Docking: Many structure-based methods for epitope and paratope predictions rely on computational docking techniques, which estimate the most likely conformations of a complex based on complementarity (geometric, chemical, energetic) between the individual proteins in many possible poses (Chen et al., 2003; Schneidman-Duhovny et al., 2005; Sircar and Gray, 2010). The resulting docking models may be ranked using a scoring function incorporating many different geometric and physicochemical parameters; defining a good scoring function is a challenging task that typically relies on domain expertise (Pedotti et al., 2011), and has been specialized for antibody–antigen docking (Brenke et al., 2012). From the top-ranked conformations, regions on one protein that are close to the partner protein can be identified as binding interfaces. Thus antibody–antigen docking can simultaneously predict epitopes and paratopes. While docking achieves a fairly high recall rate (fraction of true interface residues that are computationally identified) if enough docking models are considered, the corresponding precision rate (fraction of computationally identified residues that are truly in the interface) is then fairly low. This has prompted the development of methods that design targeted mutagenesis experiments so as to evaluate predicted docking models and improve precision (Hua et al., 2017).
Epitope prediction: Some approaches, e.g. PEPITO (Sweredoski and Baldi, 2008), ElliPro (Ponomarenko et al., 2008), EPSVR (Liang et al., 2010) and DiscoTope (Kringelum et al., 2012), apply machine learning methods to structural features of the antigen’s residues. These methods can be considered antibody-agnostic as they do not use information from the partner antibody, and thus just reveal parts of the antigen generally amenable to antibody binding (Sela-Culang et al., 2015). For prediction of an epitope targeted by a particular antibody, the context of which residues are likely to be involved in the interaction can improve the prediction performance, as well as distinguish specificity differences among different antibodies. This aspect of antibody–antigen interactions was leveraged by the antibody-specific prediction method EpiPred (Krawczyk et al., 2014) to achieve state-of-the-art performance. EpiPred first performs geometric matching of patches (e.g. based on docking models) and then scores residues on the antigen with a customized binding potential specific for antibodies and antigens.
Paratope prediction: Many paratope predictors focus on special regions on antibodies called complementarity determining regions (CDRs), as they are well-defined from sequence and constitute the majority of the paratope and the majority of the differences among antibodies driving antigen-specific recognition. In the nonparametric method Paratome (Kunik et al., 2012), the query antibody’s structure and sequence are compared against a nonredundant dataset of antibodies, and paratopes are predicted based on resemblance to those on the closest matching antibody. Antibody i-Patch (Krawczyk et al., 2013) uses a scoring function derived from an analysis of antibody–antigen interactions in a nonredundant training set. Recently, Daberdaku and Ferrari (2019) achieved state-of-the-art performance with a method that applies SVMs to classify patches extracted from the surface of the antibody, based on rototranslationally invariant shape descriptors and other physicochemical properties representing the patches.
A common drawback of current structure-based methods for epitope and paratope predictions is the use of fixed representations, which can be limited by the extent of available domain knowledge. Furthermore, epitope and paratope predictions are treated as two separate tasks, leading to the use of different representations and prediction methods for antigens and antibodies. Sequence-based methods, Parapred (Liberis et al., 2018) and AG-Parapred (Deac et al., 2019), demonstrate the utility of learning representations for better paratope prediction. However, there are currently no methods to learn structural representations for either epitope or paratope prediction tasks. Recently, a spatial graph convolution network was proposed to learn structural representations of proteins for interface prediction in general protein–protein interactions (Fout et al., 2017). While graph convolution networks can encode structural representations of residues with information from their spatial neighborhood, they do not encode the context of the target protein. As shown by current methods, embedding the correct context of the target protein can improve the prediction performance (Krawczyk et al., 2013, 2014). Therefore, there is a need to develop methods for learning context-aware structural representations for epitope and paratope predictions.
In this work, we present a unified deep learning-based framework for learning context-aware structural representations of antigens and antibodies to predict their binding interfaces. Our framework consists of a novel combination of graph convolution networks, attention and transfer learning to capture several desired aspects of antibody–antigen interactions. We show that the models trained on our framework can overcome the limitations of current computational methods and achieve state-of-the-art performance on both epitope and paratope prediction tasks. We also show that the prediction performance of these networks is only marginally affected when using homology models of antibodies compared to that when using their crystallized structures. Using the attention layer, we demonstrate the ability of our framework to reveal the mode of interaction between antigens and antibodies, enabling a deeper study of the biological factors driving their interactions. Therefore, our framework improves prediction accuracy and provides interpretable results to expedite the process of large-scale antibody–antigen characterization.
2 Materials and methods
We propose a novel deep learning framework, PECAN, Paratope and Epitope AQ5prediction with graph Convolution Attention Network (Fig. 1), to learn the structural representations of antigens and antibodies to predict their binding interfaces (i.e. antigen epitopes and antibody paratopes). Our framework comprises three components to leverage biological insights: (i) graph convolutions to capture the spatial relationships of the interfaces, (ii) an attention layer to enable each protein’s interface predictions to account for the potential binding context provided by its partner and (iii) transfer learning to leverage the larger set of data available for general protein–protein interactions to provide a baseline model to be fine-tuned with antibody–antigen data.
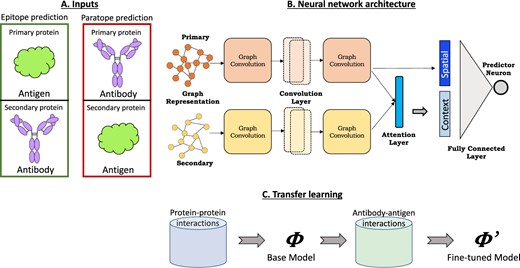
Schematic overview of PECAN, Paratope and Epitope prediction with graph Convolution Attention Network. (A) The antibody and antigen protein structures are ordered as primary and secondary according to the task. (B) Graph representations of the two proteins are input to the neural network consisting of graph convolution, attention and fully connected layers. (C) For transfer learning, a base network trained on general proteins is used as initialization for training epitope and paratope prediction networks
We use this general framework to train two separate networks for the two prediction tasks: (i) an epitope prediction network in which the antigen is the primary protein on which we want to predict the interface (epitope) and the antibody is the secondary protein providing the context for a suitable interface; (ii) a paratope prediction network with the antibody as primary for interface prediction (paratope) and the antigen secondary providing the context. We note that in both tasks, the interface labels of the secondary protein are hidden during training and prediction phases, forcing the attention layer to learn the correct context of the secondary protein in an unsupervised fashion.
Problem statement: The objective is to assign a label, either interface (positive class) or non-interface (negative class), to each residue of the primary protein.
A. Input representation: Each protein structure is represented as a graph, with nodes for the amino acid residues and edges between residues with Cβ–Cβ distance less than 10 Å. For Gly residues, which lack a β carbon, Cα was used. Associated with each node is a 62-dimension feature vector encoding important sequence and structural properties as used in Fout et al. (2017): (i) a one-hot encoding of the amino acid type (d = 20); (ii) a conservation profile for that position across a set of homologous proteins returned by PSI-BLAST (Altschul et al., 1997) (d = 20); (iii) the absolute and relative solvent accessible surface area of the residue as computed by STRIDE (Heinig and Frishman, 2004) (d = 2); (iv) a local amino acid profile indicating the number of times each amino acid type appears within 8 Å of the residue (d = 20). The structure-based features (iii and iv) were calculated for each protein in isolation from its partner.
As antibody CDRs drive antigen-specific recognition and the rest of the antibody framework is quite similar across all antibodies, nodes in the antibody graph are limited to ‘CDR clouds’ as follows: (i) identify the six CDRs using the IMGT annotation tool (Lefranc et al., 2003); (ii) for each CDR, consider two sequentially adjacent residues; (iii) further extend these sets to include all residues within 6 Å in the structure (the maximum of the minimum Cβ–Cβ distance between any two CDR residues in the training sets).
B. Neural network: The neural network consists of graph convolution, attention and fully connected layers. Given two input graphs, primary and secondary , the network assigns to each node a probability of belonging to the positive class (i.e. binding interface).
Multiple layers can be stacked to produce high-level representations for each node. Each convolution layer has two weight-shared graph convolution modules, one for the primary graph and one for the secondary graph.
C. Transfer learning: A base network for interface prediction is learned for a relatively larger set of general protein–protein interactions. The learned weights from the base model are then used to initialize weights for training the two task-specific networks, essentially fine-tuning the general base network for epitope and paratope predictions using antibody–antigen data.
2.1 Implementation details
The framework was implemented in TensorFlow (Abadi et al., 2015). Validation sets were used to find the optimal set of network training parameters for final evaluation. A grid search was performed over the following parameters: (i) Optimizer: Stochastic gradient descent, Momentum (Sutskever et al., 2013), Adagrad (Duchi et al., 2011) or Adam (Kingma and Ba, 2015); (ii) learning rates: 0.0001, 0.001, 0.005, 0.01, 0.05 or 0.1; (iii) batch size: 32, 64 or 128 and (iv) dropout: 0.5 or 0.8. For each combination, networks were trained until the performance on the validation set stopped improving or for a maximum of 250 epochs. For both epitope and paratope predictions, the best validation set performance was achieved when training till 120 epochs using the Momentum optimizer with Nesterov accelerated gradients (Su et al., 2016) at a learning rate of 0.001, with batch size of 32 and 50% dropout rate. Training was carried out by minimizing the weighted cross-entropy loss function as in Fout et al. (2017). The same network settings were used for training on general protein–protein complexes, but the fine-tuning was carried out on antibody–antigen complexes for half the original time (i.e. 60 epochs). The graph convolution layers were set to have 32 filters and the latent space dimension for attention was also set to 32. All weight matrices were initialized as in He et al. (2015) and biases set to zero. For graph convolution, the receptive field (spatial neighborhood) for each node was set to include the 15 nearest nodes in the graph.
2.2 Datasets
For benchmarking purposes, we use the datasets provided with the state-of-the-art epitope predictor, EpiPred (Krawczyk et al., 2014) and the state-of-the-art paratope predictor, by Daberdaku and Ferrari (2019), and compare the performance against these predictors. We note that the datasets were already curated to avoid overlap (too much similarity in antibodies or antigens) between testing and training.
Epitope prediction: The dataset from EpiPred (Krawczyk et al., 2014) consists of 148 antibody–antigen complexes, 118 for training and 30 for testing, filtered to ensure that antigens shared no more than 90% pairwise sequence identity. As a separate validation set was not used, we constructed one from the antibody–antigen complexes in the Docking Benchmarking Dataset (DBD) v5 (Vreven et al., 2015), ensuring that antigens in the validation set had no more than 25% pairwise sequence identity to those in the test set. This yielded 103 complexes for training, 29 for validation and 30 for testing. To test on homology models of the antibodies, in addition to the crystal structures provided in the EpiPred comparison, the PIGS server (Marcatili et al., 2014) was used to generate homology models. In homology modeling, we ensured that structures of the same or closely related antibodies were not used as templates for modeling by considering only those antibody structures with less than 95% sequence identity to the query sequence (on heavy and light chains). The definition of the true epitope was still taken from the cocrystal structures. In addition, we compiled from SabDab (Krawczyk et al., 2014) a new, distinct epitope prediction test set of 53 Ab:Ag complexes (Supplementary Table S1). In this new dataset, we ensured that no antigen had more than 50% sequence similarity with any antigen in this set and in the Epipred dataset (which used a cutoff of 80% sequence identity).
Paratope prediction: The dataset from Daberdaku and Ferrari (2019) consists of 471 antibody–antigen complexes, with 213 complexes for training, 106 for validation and 152 for testing, filtered to ensure that antibodies shared no more than 95% pairwise sequence identity. As our framework accepts only proteins, we discarded complexes with nonprotein antigens (e.g. DNA), resulting in 205 complexes for training, 103 for validation and 152 for testing. For evaluation on homology modeled structures, we used the same antibody models provided in the dataset, which had been built using the ABodyBuilder server (Leem et al., 2016).
Transfer learning: To facilitate unbiased transfer learning, the DBD v5 dataset (Vreven et al., 2015) was processed to discard complexes that were categorized as antibody–antigen, resulting in a dataset of 191 protein–protein complexes.
Following the previous studies (Daberdaku and Ferrari, 2019; Krawczyk et al., 2014), residues were labeled as part of the interface if they had any non-hydrogen atoms within 4.5 Å of any non-hydrogen atoms of residues on the other protein.
Table 1 summarizes the percentage of residues that form the interface in training, validation and test sets for epitope and paratope prediction tasks.
Summary of datasets used for training, validation and testing
| Epitope prediction dataset | ||
| Data split | # complexes | % epitopes |
| Training | 103 | 8.9% |
| Validation | 29 | 8.7% |
| Test | 30 | 7.8% |
| Paratope prediction dataset | ||
| Data split | # complexes | % paratopes |
| Training | 205 | 8.8% |
| Validation | 103 | 8.9% |
| Test | 152 | 9.4% |
3 Results
We evaluate our approach in head-to-head benchmark comparisons against state-of-the-art epitope and paratope predictors, showing that our unified framework outperforms approaches specifically targeted to each. Furthermore, we elaborate general precision and recall trends in the full architecture, as well as versions enabling characterization of the contributions of convolution, attention and transfer learning. Finally, we explore the ability of the attention layer to provide insights into the basis for the model’s predictions.
3.1 Evaluation
Epitope and paratope prediction networks were trained using the validation-set optimized hyperparameters from above. Per-protein prediction performance was measured on the test sets by comparing predicted scores against ground truth labels.
While our networks output a probability for each residue, to enable a direct comparison to other epitope prediction methods we computed precision and recall by predicting as interface residues those with probability above 0.5. To further elaborate precision-recall trade-offs, we considered all such classification thresholds and computed the area under the precision recall curve (AUC-PR). Though some previous methods have used the area under the receiver operating characteristics curve (AUC-ROC) metric, AUC-PR is more suitable here as the emphasis is on predicting binding interfaces (positive class) and the negative class constitutes roughly 90% of the samples. To summarize the performance, AUC-PR was averaged over all proteins in the test set. To provide robust estimates of performance, the training and testing procedures were repeated five times, and the mean and standard error reported. As results from the previous studies were reported as single numbers, from either one evaluation or an average of multiple evaluations, the statistical significance of the difference between our performance and those single values was evaluated by way of a tail probability, the fraction of times our networks performed worse than the reported values.
Our evaluations included two learning schema: task-specific learning (i.e. just using antibody–antigen data) and transfer learning (i.e. fine tuning from a model trained with general protein–protein data). For each schema, five networks were evaluated: one network with a single fully connected layer (no convolution), one with a single graph convolution layer (Conv1-layer) and one with two (Conv2-layer), and likewise one network with the attention layer following a single graph convolution layer (Conv1-layer+Attn) and one following two convolution layers (Conv2-layer+Attn). Two-sided Wilcoxon-Mann-Whitney tests were performed to estimate the statistical significance of the performance differences between different models.
3.2 Epitope prediction
Figure 2 summarizes the epitope test set prediction performance for our different neural network implementations along with the state-of-the-art Epipred (Krawczyk et al., 2014) and DiscoTope (Kringelum et al., 2012). Our networks all perform better than Epipred and DiscoTope in terms of precision and recall (substantially stronger on recall alone) at the 0.5 cutoff (Fig. 2A) (tail probability P < 0.001). Elaborating performance for a range of cut-offs via AUC-PR in Figure 2B enables further comparison among our architecture implementations (these numbers are not available for the other methods). The network with an attention layer after two convolution layers achieves the best performance, confirming the utility of embedding the context of the target antibody into the representation of antigen’s residues in addition to information from their spatial neighbors. The models predicting epitopes without the context of the antibody can be considered as predicting general hotspots on the antigens, which succeeds to a certain extent, as is the basis for generic (not antibody-specific) ‘B cell epitope prediction’ methods. The Conv2-layer+Attn network achieves similar prediction performance on the additional epitope prediction test set (Supplementary Fig. S7) as on the Epipred dataset, thus confirming our results on this completely separate dataset.
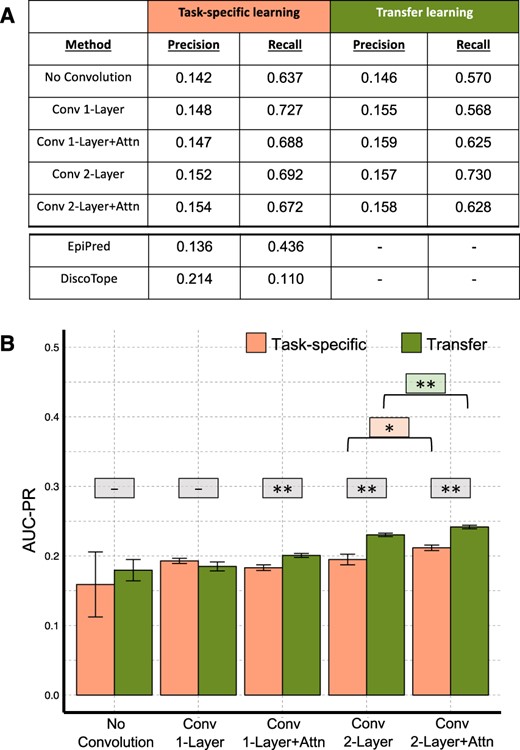
Epitope prediction networks performance summary. (A) Precision and recall metrics obtained at decision boundary of 0.5. The measures for EpiPred (Krawczyk et al., 2014) and DiscoTope (Kringelum et al., 2012) were taken from Krawczyk et al. (2014). (B) AUC-PR measures obtained over a range of cutoffs. (Wilcoxon–Mann–Whitney P-values: **P < 0.01, *P < 0.05, -not significant)
Furthermore, the improvements in performance of all models after transfer learning illustrates the benefits of leveraging data from general protein–protein interactions to establish a base model that can be fine-tuned with antibody–antigen data. The networks trained on general protein–protein interactions, however, show poor prediction performance compared to the task-specific and transfer learning networks (Supplementary Fig. S1A), demonstrating that these base models only served as good initialization points to networks that were trained for predicting epitopes.
To identify most importance features for prediction, networks were trained independently on each of the four feature types. Feature-specific networks did not perform as well as those networks trained on all features together (Supplementary Fig. S2A), thus showing that features extracted from both sequence and structure are necessary for better epitope prediction. We also show that we avoid overfitting to the training dataset by limiting our training runs to 120 epochs, after which the prediction performance on the validation set starts to worsen (Supplementary Fig. S8).
Similar prediction performance can be observed when homology modeled structures of antibodies, instead of their crystal structures, are used to predict epitopes on corresponding antigens (Supplementary Fig. S3A). Interestingly, networks performed slightly better when using homology models compared to the crystal structures, which may be due to some relaxation of the structure during the modeling process. However, we found no significant correlation between the change in performance and the root mean squared distance between the models and crystal structures of CDR-H3 loops (Supplementary Fig. S3C).
3.3 Paratope prediction
Figure 3 summarizes the paratope test set prediction performance of our different neural networks, and state-of-the-art structure-based methods (Daberdaku and Ferrari 2019) and antibody i-Patch (Krawczyk et al., 2013). To enable a direct comparison to previous studies, we predict for the entire structure of the antibody Fv region instead of just the CDR clouds, as described in our methods. Our networks perform better than the other methods on both AUC-PR and AUC-ROC (Supplementary Fig. S4) (tail probability P < 0.001), establishing the superior performance of learned features over predefined features as used by Daberdaku and Ferrari (2019). The no-convolution network performs equivalently to Daberdaku and Ferrari (2019) (tail probability P = 0.4), and the addition of convolution adds a statistically significant boost. The network with a single layer of convolution and attention achieves the best performance, but the attention layer provides only a small performance improvement over convolution. We hypothesize that since paratopes are mostly localized to regions around the CDRs, the context of the antigen may not provide much more information regarding exact paratope location than the structural properties already captured by convolution. Nonetheless, as we show in the next section, the attention layer offers the benefit of making the network interpretable, which can be a difficult task for convolution layers alone.
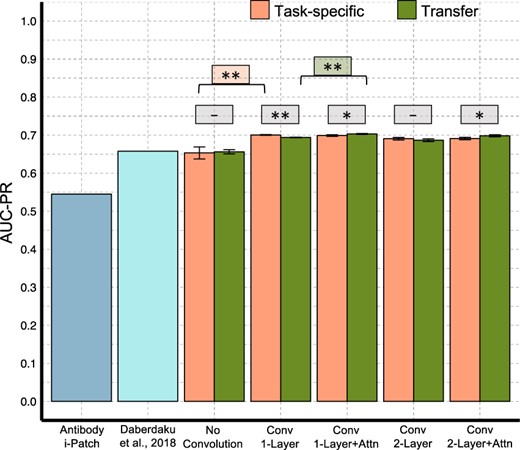
Paratope prediction networks performance summary. Performance measures of Antibody i-Patch (Krawczyk et al., 2013) and Daberdaku and Ferrari (2019) were taken from Daberdaku and Ferrari (2019). (Wilcoxon–Mann–Whitney P-values: **P < 0.01, *P < 0.05, -not significant)
As was done in the case of epitope prediction, feature-specific networks were trained to identify most important feature types for paratope prediction. Interestingly, networks trained on conservation profile alone performed nearly as well as networks trained with all features (Supplementary Fig. S2B), thus showing that features extracted from sequence played a significant role in paratope prediction.
While we observe a minor drop in prediction performance when predicting on homology models compared to that obtained using crystal structures, our networks perform better than Daberdaku and Ferrari (2019) (Supplementary Fig. S5).
3.4 Assessing the contributions of attention
The attention layer provides the opportunity to study the mode of interaction by revealing the learned context of the target protein without requiring additional inference techniques. The attention score between every pair of residues can be visualized as a matrix, as Figure 4A illustrates for the complex on which our epitope prediction network performed best. In this heatmap, epitopes have a substantially distinct attention profile compared to other residues on the antigen, which results in improved epitope prediction (AUC-PR: 0.8) compared to convolution alone (AUC-PR: 0.48). These attention scores can further be projected onto the structures (Fig. 4B) by taking for each residue the maximum of its scores with partner residues. This projection shows that attention is high between residues in and around the actual interface region, suggesting that the attention layer encodes the correct context (i.e. paratopes) of the antibody for epitopes. The same pattern of high attention scores near the interface regions was also observed for other antibody–antigen complexes (Fig. 4C–F illustrate the next four top performers).
![Attention visualization (A) Heatmap of the attention score matrix for an antibody in complex with vascular endothelial growth factor A (VEGFA) (PDB ID 1TZH). The scores were normalized to have zero mean and unit variance, and truncated to the range [-6,6]. (B–E) Projection of max-pooled attention scores onto structures of example antigen and antibody complexes in the test set. Structural visualizations made using PyMOL (Schrödinger, 2015)](https://oup.silverchair-cdn.com/oup/backfile/Content_public/Journal/bioinformatics/36/13/10.1093_bioinformatics_btaa263/5/m_bioinformatics_36_13_3996_f4.jpeg?Expires=1750223270&Signature=ojg0hKFqinWzbQZn~8jwYBvtwFv0grF1~75PZaPNv2fbAwRlcittQSnCQeqHgQN4FFAC2dKTWZgpLvE83M~lKTqs1cYRERov9NLw9nlwYX9EVAmlZUU6WjzTUVkYZcQ~V4yaX3rZFBu4bhiHcFOI7VTsqXMqkrRILgj8V-1eg~5qezRbJkOBGwNKulxQ7nEkHZQM4Oow89W9sVdyykDzJjOpk83iPubFCkHoW1m3gy8tNXkm~2MHggJ3KqrgUXNYayqnLOFRi76Jgq8IwkHhghB9KgYuhTApeKvPpTnM~SJaOCc85hEXxdcA9-J0KA1CiYIGxWbzZd9trT0yKUZr7w__&Key-Pair-Id=APKAIE5G5CRDK6RD3PGA)
Attention visualization (A) Heatmap of the attention score matrix for an antibody in complex with vascular endothelial growth factor A (VEGFA) (PDB ID 1TZH). The scores were normalized to have zero mean and unit variance, and truncated to the range [-6,6]. (B–E) Projection of max-pooled attention scores onto structures of example antigen and antibody complexes in the test set. Structural visualizations made using PyMOL (Schrödinger, 2015)
Intrigued by the attention layer’s ability to localize the appropriate context during epitope prediction, we hypothesized that the same ability could benefit paratope prediction. We thus performed a ‘cross-task evaluation’, in which a network was trained to predict epitopes using the antigens in the epitope prediction training set. This epitope prediction network was then evaluated for its performance at also predicting paratopes for the antibodies in the paratope prediction test set—the reciprocal task to that for which it was trained. For reference, paratope prediction networks were trained on the antibodies from the epitope prediction training set and applied (as normal) to the CDR clouds of antibodies in the paratope prediction test set. Figure 5 summarizes the prediction performance of our different neural networks on the cross-task evaluation. As expected, the paratope prediction networks perform significantly better at predicting epitopes than do the networks trained to predict epitopes. However, the results from cross-task evaluation show that even though none of the networks were trained to predict paratopes, those with an attention layer perform better than convolution-only networks. This suggests that the attention layer is indeed able to better capture the specificity of antibody–antigen interactions, thereby also benefiting paratope prediction.
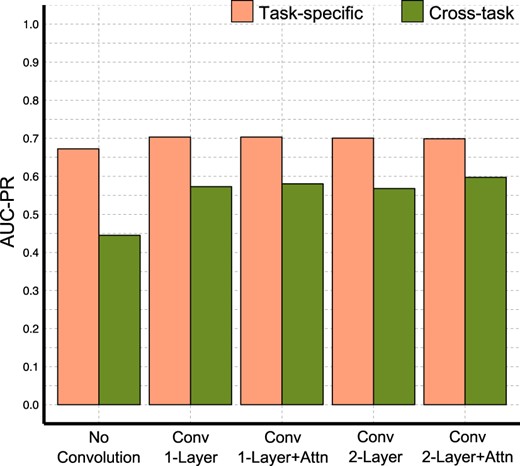
Performance summary from ‘cross-task evaluation’, predicting paratopes using networks trained only for predicting epitopes
4 Conclusion
We have presented a unified deep learning framework for predicting binding interfaces on antibodies and antigens. Our results demonstrate that the networks learn structural representations that capture many desired aspects of antibody–antigen interactions and simultaneously achieve state-of-the-art performance on both epitope and paratope prediction tasks. We also show that the attention layer successfully encodes the context of partner proteins, improving prediction performance and providing an interpretable view of the mode of interaction. Future work includes including additional residue features while imposing sparsity constraints on the attention matrix, applying the same framework to other large protein families with specific recognition modes, and using predictions to focus docking as well as experimental evaluation.
Acknowledgements
The authors thank Margie Ackerman, Karl Griswold and members of the Bailey-Kellogg lab for helpful comments, and Casey Hua for sharing antibody art.
Funding
This research was supported in part by National Institutes of Health grant 2R01GM098977, with computational support from the anthill and discovery clusters at Dartmouth.
Conflict of Interest: none declared.
References

