


Abstract
Motivation: Discovering patterns in networks of protein–protein interactions (PPIs) is a central problem in systems biology. Alignments between these networks aid functional understanding as they uncover important information, such as evolutionary conserved pathways, protein complexes and functional orthologs. However, the complexity of the multiple network alignment problem grows exponentially with the number of networks being aligned and designing a multiple network aligner that is both scalable and that produces biologically relevant alignments is a challenging task that has not been fully addressed. The objective of multiple network alignment is to create clusters of nodes that are evolutionarily and functionally conserved across all networks. Unfortunately, the alignment methods proposed thus far do not meet this objective as they are guided by pairwise scores that do not utilize the entire functional and evolutionary information across all networks.
Results: To overcome this weakness, we propose Fuse, a new multiple network alignment algorithm that works in two steps. First, it computes our novel protein functional similarity scores by fusing information from wiring patterns of all aligned PPI networks and sequence similarities between their proteins. This is in contrast with the previous tools that are all based on protein similarities in pairs of networks being aligned. Our comprehensive new protein similarity scores are computed by Non-negative Matrix Tri-Factorization (NMTF) method that predicts associations between proteins whose homology (from sequences) and functioning similarity (from wiring patterns) are supported by all networks. Using the five largest and most complete PPI networks from BioGRID, we show that NMTF predicts a large number protein pairs that are biologically consistent. Second, to identify clusters of aligned proteins over all networks, Fuse uses our novel maximum weight k-partite matching approximation algorithm. We compare Fuse with the state of the art multiple network aligners and show that (i) by using only sequence alignment scores, Fuse already outperforms other aligners and produces a larger number of biologically consistent clusters that cover all aligned PPI networks and (ii) using both sequence alignments and topological NMTF-predicted scores leads to the best multiple network alignments thus far.
Availability and implementation: Our dataset and software are freely available from the web site: http://bio-nets.doc.ic.ac.uk/Fuse/.
Contact: [email protected]
Supplementary information: Supplementary data are available at Bioinformatics online.
1 Introduction
Understanding the patterns in molecular interaction networks is of foremost importance in systems biology, as it is instrumental to understanding the functioning of the cell (Ryan et al., 2013). A large number of studies focused on understanding the topology of these networks (Mitra et al., 2013; Pržulj, 2011). Network alignment started as a pairwise problem: given two networks, aligning them means finding a node-to-node mapping (called an alignment) between the networks that groups together evolutionarily or functionally related proteins between the networks. These methods uncovered valuable information, such as evolutionarily conserved pathways and protein complexes (Kelley et al., 2003; Kuchaiev et al., 2010), and functional orthologs (Bandyopadhyay et al., 2006). Finding these allows transfer of information across species, such as performing Herpes viral experiments in yeast or fly and then applying the insights towards understanding the mechanisms of human diseases (Uetz et al., 2006).
The pairwise network alignment problem is computationally intractable due to NP-completeness of the underlying sub-graph isomorphism problem (Cook, 1971). Hence, several pairwise network alignment heuristics have been proposed. Early methods, called local network aligners, search for small, but highly conserved sub-networks (Flannick et al., 2006; Kelley et al., 2004; Koyutürk et al., 2006). As such sub-networks can be duplicated, local network aligners often produce one-to-many or many-to-many mappings, in which a node from a given network can be mapped to several nodes of the other network. While these multiple mappings can indicate gene duplications, they are often biologically implausible (Singh et al., 2007). Hence, global network aligners, which perform an overall comparison of the input networks and produce one-to-one mappings between the nodes of the two networks have been introduced [see Clark and Kalita (2014) for the most recent comparison of pairwise network aligners].
The number of known protein–protein interactions (PPIs) increased dramatically over the last 2 decades thanks to the technological advances in high-throughput interaction detection techniques, such as yeast two-hybrid (Ito et al., 2000; Uetz et al., 2000) and affinity purification coupled to mass spectrometry (Ho et al., 2002). With the availability of PPI networks of multiple species came the multiple network alignment problem, where given k networks, aligning them means to group together the proteins that are evolutionarily or functionally conserved between the networks. Similar to pairwise network alignment, multiple network alignment can be local or global, with node mappings one-to-one or many-to-many. As the complexity of the problem grows exponentially with the number of networks to be aligned, the proposed multiple network alignment algorithms use simple and scalable alignment schemes. The pioneering multiple network alignment algorithm is NetworkBLAST (Kalaev et al., 2008; Sharan et al., 2005), which greedily searches for highly conserved local regions in the alignment graph constructed from the pairwise protein sequence similarities. Graemlin (Flannick et al., 2006) produces local multiple network alignments using a progressive alignment scheme, by successively performing pairwise alignments of the closest network pairs. IsoRank (Singh et al., 2008) and its successor IsoRankN (Liao et al., 2009) are the first multiple network aligners that do not only use pairwise sequence similarity to guide their alignment processes but they also take into account the topology (i.e. wiring patterns) around the two nodes in their corresponding networks to build up global many-to-many multiple network alignments, using a derivative of Google’s PageRank algorithm. Smetana (Sahraeian and Yoon, 2013) also produces global many-to-many multiple network alignments using both pairwise sequence scores and pairwise topological scores, which are derived from a semi-Markov random walk model. While NetCoffee (Hu et al., 2013) does not use topological information to build its global one-to-one alignment, it is the first multiple network aligner in which the score for mapping two nodes does not only depend on the scores in pairs of networks but also on their conservation across all PPI networks being aligned, by using a triplet approach similar to the multiple sequence aligner, T-Coffee (Notredame et al., 2000). Beams (Alkan and Erten, 2014) is a fast heuristics that constructs global many-to-many multiple network alignments from the pairwise sequence similarities of the nodes by using a backbone (seed) extraction and merge strategy. CSRW (Jeong and Yoon, 2015) follows the Smetana methodology but uses a context-sensitive random walk model. Finally, Node-Handprinting (NH) (Radu and Charleston, 2015) produces global many-to-many multiple network alignments from topological information only, by using a progressive alignment heuristic. In the aforementioned aligners, most of the node mapping scores are local, in the sense that they only consider the sequence similarity or the topological similarity of the nodes. The only exception is NetCoffee, but its global scores are only based on sequence similarity and do not take into account the topology of the networks.
To overcome these limitations, we propose Fuse, a novel multiple network alignment method that consists of two parts. In the first part, we compute novel similarity (association) scores between proteins by fusing sequence similarities and network wiring patterns over all proteins in all PPI networks being aligned. Our objective is to link together proteins whose homology (from their sequence similarity) and functioning similarity (from their wiring patterns in PPI networks) are supported by all networks. We do this by using non-negative matrix tri-factorization (NMTF) technique (Wang et al., 2011), initially used for co-clustering heterogeneous data but recently proposed as a data fusion technique as well. NMTF has demonstrated a great potential in addressing various biological problems, such as drug-induced liver injuries prediction (Žitnik and Župan, 2014a), disease association prediction (Žitnik et al., 2013), PPI prediction (Wang et al., 2013) and gene function prediction (Gligorijević et al., 2014; Žitnik and Župan, 2014b). We apply NMTF on the PPI networks of the five species that have the largest and the most complete sets of PPIs in BioGRID database (Chatr-Aryamontri et al., 2013). On this dataset, the fusion process changes the values of sequence similarities between proteins based on network topologies, so that some of the sequence similarities that existed before the fusion disappear (about 40% in our experiments), while a large set of new ones is created by the matrix completion property of NMTF (Koren et al., 2009). This new set of similar protein pairs is 13 times larger than the set of sequence-similar protein pairs due to fusion of sequence information with network topology. Moreover, the new set of protein pairs has a higher functional consistency (i.e. shared GO terms across the pairs) than the set of protein pairs found to be similar by sequence alignment. To control the contribution of topology versus sequence, our final functional similarity score for a pair of proteins is a weighted sum of their sequence similarity and their similarity predicted by NMTF based on their wiring and sequence similarity with proteins in all networks being aligned.
In the second part of Fuse, to construct a global one-to-one multiple network alignment, first we construct an edge-weighted k-partite graph, with the proteins of each of the k PPI networks being partitions of its node set and the above described functional similarity scores being edge weights. To construct a multiple network alignment, we find a maximum weight k-partite matching in this graph. As finding a maximum weight k-partite matching is NP-hard (Karp, 1972), and because NMTF predicts a large number of similarities in the Fuse’s k-partite graph, we propose a novel k-partite matching heuristic algorithm.
We evaluate the performance of Fuse against other state of the art multiple network aligners and show that Fuse produces the largest number of functionally consistent clusters that map proteins over all aligned networks. Unlike other aligners, Fuse is able to predict functional associations between proteins that are not sequence related (i.e. whose sequence similarity is not significant). These associations can contribute to the identification of functionally consistent clusters that cannot be identified by the previous aligners, as the previous aligners cannot predict new protein associations that are not sequence based. Furthermore, these predicted clusters could be used for transfer of annotations across proteins of different species that are not sequence related. Moreover, we show that Fuse is scalable and computationally more efficient than all of the previous aligners except Smetana (but Smetana’s aligned proteins are not as functionally consistent as Fuse’s; detailed below). Specifically, the data-fusion step is the most time consuming in Fuse with the time complexity of , where n is the total number of proteins in all PPI networks being aligned, while the alignment step has a smaller time complexity of , where k is the number of networks and e is the number of functional associations (similarity scores) between the proteins in them.
2 Approach
The PPI of each species i is represented by a graph (network), , where the nodes in Vi represent proteins and where two proteins are connected by an edge in Ei if they interact. Our multiple network alignment strategy consists of two steps. In the next two paragraphs, we give a short overview of these steps, before giving the full details of the methodology.
First, we use all PPI networks to be aligned and all the protein sequence similarities between them, as inputs into the NMTF-based data fusion technique to compute new protein similarity scores between the proteins of the networks. Considering the obtained normal distribution of similarity scores for aligning the five PPI networks described above, we define as significant the scores that are in top 5%. We combine significant scores with the original sequence similarities to derive the final functional scores between pairs of proteins for the reasons explained in Section 4.1. We construct an edge-weighted k-partite graph , where the node set is the union of the nodes sets (proteins) Vi of the input PPI networks; two nodes , are connected by an edge (u, v) in E if their functional score is greater than zero; the corresponding edge weight in W is their functional score. No edge exists between nodes coming from the same subset Vi by definition of a k-partite graph.
Second, we construct a one-to-one global multiple network alignment by using an approximate maximum weight k-partite matching solver on G.
2.1 Datasets
From BioGRID (v3.2.111, April 25, 2014) (Chatr-Aryamontri et al., 2013), we obtained the PPI networks of the five organisms having the largest and the most complete sets of physical PPIs: Homo sapiens, Saccharomyces cerevisiae, Drosophila melanogaster, Mus musculus and Caenorhabditis elegans. We retrieved the corresponding protein sequences from NCBI’s Entrez Gene database (Maglott et al., 2005) and computed their pairwise similarities using BLAST (Altschul et al., 1990). We also retrieved from NCBI’s Entrez Gene database the Gene Ontology (GO) annotations of the proteins. Note that we only used experimentally validated GO annotations (i.e. excluding the annotations from computational analysis evidence such as sequence similarity) and that we additionally excluded annotations derived from PPI experiments (code IPI). To standardize the GO annotations of proteins, similar to the evaluation methods of Singh et al. (2008), Liao et al. (2009) and Alkan and Erten (2014), we restrict the protein annotations to the fifth level of the GO-directed acyclic graph by ignoring the higher-level annotations and replacing the deeper-level annotations with their ancestors at the restricted level. The network statistics are detailed in Table 1.
The five PPI networks considered in this study
| Id | No. nodes | BP Ann. (%) | MF Ann. (%) | CC Ann. (%) | No. edges |
|---|---|---|---|---|---|
| Homo sapiens | 14 164 | 37.2 | 23.2 | 9.6 | 127 907 |
| Saccharomyces cerevisiae | 6004 | 65.0 | 41.7 | 17.4 | 223 008 |
| Drosophila melanogaster | 8125 | 36.1 | 13.4 | 6.3 | 38 892 |
| Mus musculus | 5100 | 53.3 | 23.9 | 10.6 | 11 061 |
| Caenorhabditis elegans | 3841 | 35.0 | 7.3 | 4.2 | 7726 |
For each PPI network (row), the table presents its Id (column 1), its number of nodes (column 2), its percentage of nodes that are annotated with at least one GO term from BP category (BP, column 3), MF category (MF, column 4) or cellular component (CC, column 5) and finally, its number of edges (column 6).
3 Methods
3.1 Non-negative matrix tri-factorization
NMTF is a machine learning technique initially designed for co-clustering of multi-type relational data (Wang et al., 2008, 2011). In this article, we consider proteins belonging to different species as different data types. In the case of two species, i and j, the sequence similarity scores between their proteins are recorded in the high-dimensional relation matrix, , where ni is the number of proteins in the species i and nj is the number of proteins in the species j. Entries in the relation matrix are e values of the protein sequence alignments computed by using BLAST. Specifically, we use (for ) as a measure of association between protein pairs. NMTF estimates the high-dimensional matrix, as a product of low-dimensional non-negative matrix factors: , where, and correspond to the cluster indicator matrices of proteins in the first and the second species, respectively, and is a low-dimensional, compressed version of , where the choice of rank parameters, , provides dimensionality reduction. The close connection between non-negative matrix factorization problem and the clustering problem is well established (Ding et al., 2005, 2006; Wang et al., 2011).
We incorporate PPI network topology as constraints into our optimization problem; violation of these constraints causes penalties to our objective function. This is motivated by the co-clustering problem which uses networks as prior information to cluster proteins. Namely, the aim is to allow proteins interacting within a PPI network to belong to the same cluster. Interactions between proteins in PPI network, i, are represented by a graph Laplacian matrix, , where is the adjacency matrix of network i and is the diagonal degree matrix of i (i.e. diagonal entries in are row sums of ). For all five of our PPI networks, we construct a Laplacian matrix, resulting in the set: .
The optimization problem (Equation 2) is solved by applying the algorithm following multiplicative update rules used to compute matrices G and S and under which the objective function, J, is non-increasing (Wang et al., 2008). These update rules are derived by minimizing the Lagrangian function, , constructed from the objective function and all additional constraints, including positivity of matrix factors G, as in article by Wang et al. (2008). The update rule for S is obtained by fixing the other matrix factor, G, and finding the roots of the equation: . A similar procedure is followed for obtaining the update rule for matrix factor G. The multiplicative update rules, their derivation and the proof of their convergence can be found in Wang et al. (2008).
The central idea of the NMTF-based data fusion approach lies in the fact that the relation matrices are not factorized separately, but instead are coupled by the same low-dimensional matrix factors, , which participate in their simultaneous decomposition (Žitnik et al., 2013) (see Fig. 1 for an illustration). This corresponds to the intermediate data fusion approach (which keeps the structure of the data while inferring a model) that has been shown to be the most accurate from all data fusion approaches (Gevaert et al., 2006; Lanckriet et al., 2004; Žitnik et al., 2013).
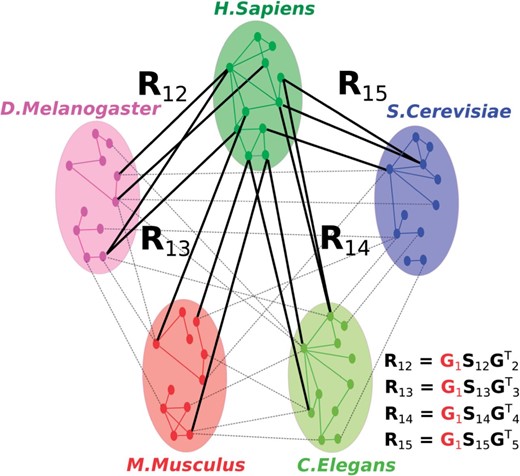
An illustration of the basic principle of NMTF-based data fusion of 5 PPI networks. Low-dimensional matrix factor , shown in red, is shared in the decompositions of data sets represented by relation matrices: . Therefore, the decomposition of depends on the other relation matrices through the shared matrix
In our study, we use the following values of parameters for NMTF: (i) factorization ranks, and , which we estimated by computing principal components of relation matrices by using principal component analysis (Jolliffe, 2005) and (ii) we chose the regularization parameter, , since it gives the best biological quality of the predicted associations. Namely, for each value of , we compute the functional consistency of the NMTF-predicted protein similarities. We find that the highest number of highly associated and biologically consistent protein pairs is obtained when , which highlights the importance of incorporating the network topology in the factorization scheme (see Supplementary Section S1 for details).
After the convergence of NMTF, we compute the reconstructed relation matrices over all pairs of networks, i and j: . Further, we threshold the matrices by keeping only the top 5% of all associations of each protein of each species. This thresholding strategy leads to better biological results than sampling strategies based on statistical significance (see Supplementary Section S4).
3.2 Approximate maximum weight k-partite matching
Using the weighted k-partite graph representation described above, we globally align multiple networks by finding a maximum weight k-partite matching in G (defined above). The maximum weight k-partite matching problem is known to be NP-hard for (Karp, 1972; Papadimitriou, 1994). Given the large number of links between the proteins across the networks produced by NMTF, we must use a heuristic for finding an approximate solution.
To handle this large number of link and to achieve a better approximation of the maximum weight k-partite matching problem, we propose a novel maximum weight k-partite matching heuristic, which we base on the clique clustering algorithm proposed by He et al. (2000) that has a low time-complexity. To this aim, we define the following graph merge operation. Let be an edge-weighted k-partite graph, and be the edge-weighted bi-partite subgraph of G that is induced by the two subsets of nodes Vi and Vj. Let = be a matching of , where means that node is matched with node . We merge Vi with Vj into Vij by identifying the mapped nodes and by creating a corresponding merged node. These merged nodes inherit the edges from their parent nodes, and multiple edges are replaced by a single edge with the sum of weights of the multiple edges as the new weight of the edge. We also move into Vij the nodes of Vi and Vj that are not matched. The new weighted graph Gij is called the merge of Vj to Vi from G along . We note that Gij is an edge-weighted partite graph.
Our approximated maximum weight k-partite matching algorithm can be seen as a progressive aligner which first maps and merges the two first networks and then successively adds into the ‘merge graph’ the remaining networks (see Algorithm 1).
The performance of our algorithm depends on the order in which the networks (i.e. the partitions in the k-partite graph) are merged. We tested two different ordering strategies: merging starting from the smaller towards the larger networks and merging networks according to the phylogenetic tree constructed from the weights of the maximum weight bi-partite matchings between the networks (i.e. merging the most similar networks first). In the rest of this article, we only report the alignments obtained by merging from the smaller network to the larger one, as it leads to the best multiple network alignment results (the comparison of the multiple network alignments that are obtained using each strategy is presented in Supplementary Fig. S5).
Algorithm 1. Approximate maximum weight k-partite matching.
Input
for do
Find maximum weight bipartite matching of
Construct , the merge of V1 and Vi from G along
Set and relabel as V1
for each merged node u in V1do
Cluster Cu is the set of nodes that are merged into u
Add Cu to C
Output C
The main operation in Algorithm 1 is finding a maximum weight matching in an induced bi-partite graph, which takes time (Bondy and Murty, 1976; Lovász and Plummer, 1986), when the k-partite graph has n nodes and e edges. There are k – 1 such operations, hence Algorithm 1 computes an approximate solution for the maximum weight k-partite matching problem in time.
4 Results and discussion
4.1 Biological assessment of NMTF-predicted protein similarities
The input data consist of 1 477 372 sequence similarities between all proteins in the PPI networks of the five species. Using these similarities as input along with topologies of the five PPI networks, NMTF outputs 19 175 378 significant similarities (i.e. those obtained by keeping the top 5% of the associations of each protein that are obtained from the reconstructed relation matrices). These associations, resulting from NMTF, cover 60% of the input sequence similarities (reconstructed), while the remaining associations resulting from NMTF are predicted.
To estimate the impact of PPI network topology on prediction of protein associations and to understand why 40% of the initial sequence similarities are not reconstructed through factorization process, we perform the following experiment: for each reconstructed, predicted and non-reconstructed protein pair, we count the number of sequence similarities between their neighbours in the corresponding PPI networks. For the protein pairs with reconstructed sequence similarities, we find that their neighbours share the highest number of sequence similarities, 20.4 on average. We also find that protein pairs with predicted associations share 12.1 sequence similarities between neighbouring proteins on average. In contrast, a much smaller number of sequence similar neighbours, 8.6 on average, is observed for the protein pairs with non-reconstructed similarities. This means that NMTF induces new and reconstructs existing associations between proteins that have many sequence similar neighbours in the corresponding PPI networks. Hence, the sequence similarity of protein pairs without many sequence similar neighbours in their PPI networks will be lost in NMTF process.
To assess the functional consistency of NMTF’s protein associations, we compute the cumulative number of associations between annotated proteins and the percentage of them sharing GO term (we considered BP and MF annotations separately). Compared with input sequence similar annotated proteins, NMTF achieve both larger numbers of functionally consistent paired proteins and higher functional consistency for the top-scoring pairs (Fig. 2). This higher functional consistency is very important in the context of clustering and alignment, where the highest associations are considered first. Also, the best NMTF scores are obtained with . This means that topologies of PPI networks contribute to functional coherence of protein pairs predicted to be similar by NMTF.
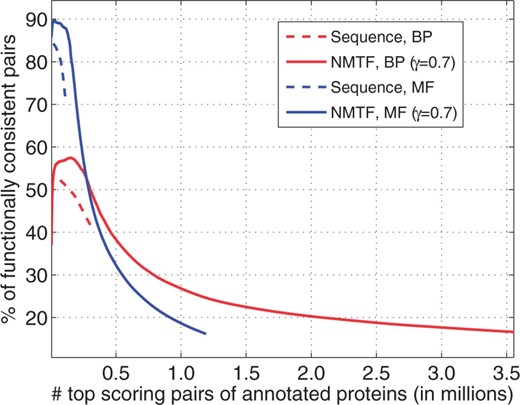
Functional consistency of NMTF associations. For both NMTF associations and sequence similarity of protein pairs, we plot the cumulative number of protein pairs with both proteins annotated (x-axis) against the percentages of them sharing GO terms (y-axis). BP and MF annotations are considered separately.
To illustrate the cases where NMTF predicts functionally consistent proteins that cannot be identified by using only sequence similarity, we extracted from the NMTF’s predictions the pairs of proteins such that (i) their sequence similarity is not significant (i.e. e value 1) and (ii) that share at least one level 5 molecular function (MF) GO annotation. We investigated the top scoring such pairs and found that these new associations are relevant. For example, the five highest scoring pairs are CTK1 (yeast) and MAP3K7 (mouse), SGV1 (yeast) and MAP3K7 (mouse), MEK1 (yeast) and MEK2 (worm), MAP3K7 (human) and CTK1 (yeast) and SVG1 (yeast) and MAP3K7 (human). All these proteins are kinases that catalyse phosphorylation reactions.
4.2 Fuse-ing PPI networks
We Fuse the five PPI networks and assess its results against state-of-the-art multiple network aligners: Beams (Alkan and Erten, 2014), Smetana (Sahraeian and Yoon, 2013), CSRW (Jeong and Yoon, 2015) and NH (Radu and Charleston, 2015). We tried to obtain alignments from IsorankN (Liao et al., 2009) and NetCoffee (Hu et al., 2013), but the computations did not finish after more than 1 week. We use BLAST e values as input sequence scores for all methods, using as the similarity measure. Both Fuse and Beams use parameter to balance the amount of input protein sequence similarity versus network topology. For these methods, we sample α from 0 to 1, in increments of 0.1. We left the other parameters of Beams and all the parameters of Smetana, CSRW and NH at their default values.
4.2.1 Evaluation based on coverage
First, we compare the network alignment methods on their ability to form protein clusters that cover all five of the input PPI networks. We refer to these clusters as ‘good’ clusters, as opposed to ‘bad’ clusters that cover proteins from fewer than 5 PPI networks. The k-coverage is the number of clusters containing proteins from k different PPI networks. Because the number of proteins per cluster may vary, the k-coverage is also expressed in terms of the number of proteins that are in these clusters. The total coverage considers all clusters containing proteins from at least two networks. The coverage statistics of the alignments are summarised in Figure 3.
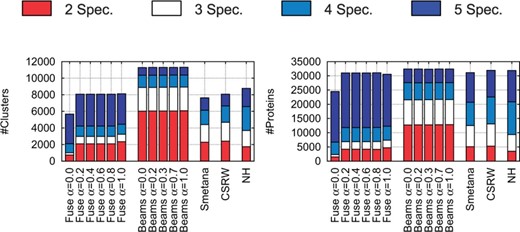
Coverage analysis. Left: for each alignment produced by the compared alignment methods (for a specific value of α for Fuse and Beams), the bar chart shows the number of clusters containing proteins from k species (see the colour coding on the top). Right: the figure shows the same but in terms of the number of proteins in these clusters
Fuse produces a larger number of good clusters (i.e. containing proteins from all five species; in dark blue in Fig. 3), producing 3841 of such clusters. Beams achieves the highest total coverage (with up to 11 302 clusters containing proteins from two to five species), but it does so by producing the largest number of bad clusters (i.e. containing proteins from only two species; in red in Fig. 3), producing up to 6046 of such clusters and the smallest number of good ones (937 clusters containing 4803 proteins).
When the coverage is expressed in terms of number of protein in the clusters (right panel of Fig. 3), the total coverages of all methods are similar. However, Fuse outperforms all other methods by putting the largest number of proteins (19 205) in good clusters.
Interestingly, when Fuse uses sequence information only (i.e. when α = 1), it already outperforms all the other approaches, which demonstrates the superiority of our alignment heuristic (Fig. 3). Moreover, Fuse achieves the best coverage for , when the functional similarity between the proteins is a combination of their sequence similarity and of their NMTF predicted similarity, which shows the complementarity of network topology and protein sequence as sources of biological information.
4.2.2 Evaluation based on functional consistency
We assess functional homogeneity of the clusters obtained by each method. We say that a cluster is annotated if at least two of its proteins are annotated by a GO term. We say that an annotated cluster is consistent if all of its annotated proteins have at least one common GO term. The ratio of all consistent clusters to all annotated clusters we call specificity. Another consistency measure that is used in previous studies (Alkan and Erten, 2014; Liao et al., 2009; Sahraeian and Yoon, 2013) is the mean normalized entropy (MNE). The normalized entropy of an annotated cluster c is defined as , where pi is the fraction of proteins in c with the annotation GOi and d represents the number of different GO annotations in c. MNE is the average of the normalized entropy of all annotated clusters. We compare Fuse, Beams, Smetana, CSRW and NH on their ability to uncover functionally conserved proteins across all input networks, by measuring the consistency, specificity and MNE of their clusters that contain proteins from all five networks (Fig. 4 and Table 2). We consider GO annotations from biological process (BP) and MF separately and do not consider cellular component (CC) annotations, as CC only annotate 9.7% of the proteins in the five networks.
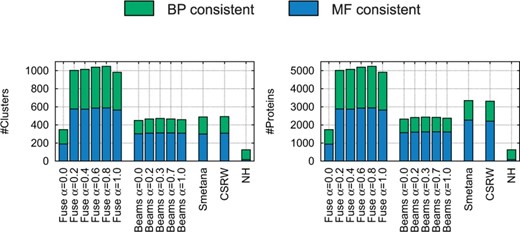
Functional consistency analysis. Left: for each alignment produced by the compared alignment methods (for a specific value of α for Fuse and Beams), the bar chart shows the number of clusters that contain proteins from all five species and that are BP consistent (in green) or MF consistent (in blue). Right: the figure shows the same, but in terms of the number of proteins in these clusters
Functional consistency analysis
| Fuse | Beams | Smetana | CSRW | NH | ||||||||||
|---|---|---|---|---|---|---|---|---|---|---|---|---|---|---|
| 0 | 0.4 | 0.6 | 0.8 | 1 | α = 0 | 0.2 | 0.3 | 0.7 | 1 | |||||
| BP | #C | 159 | 439 | 452 | 459 | 418 | 147 | 158 | 159 | 154 | 149 | 188 | 185 | 108 |
| #P | 795 | 2195 | 2260 | 2295 | 2090 | 751 | 809 | 815 | 790 | 762 | 1086 | 1103 | 540 | |
| Spec. | 6.7% | 14.3% | 14.8% | 14.9% | 14.2% | 18.3% | 19.2% | 19.4% | 18.8% | 18.2% | 14.7% | 15.3% | 6.3% | |
| MNE | 1.97 | 2.05 | 2.05 | 2.05 | 2.07 | 1.97 | 2.19 | 2.22 | 2.22 | 1.97 | 2.16 | 2.06 | 2.04 | |
| MF | #C | 189 | 575 | 586 | 588 | 564 | 303 | 308 | 312 | 312 | 309 | 300 | 308 | 17 |
| #P | 945 | 2875 | 2930 | 2940 | 2820 | 1573 | 1601 | 1619 | 1628 | 1610 | 2262 | 2205 | 85 | |
| Spec. | 21.0% | 40.7% | 41.1% | 41.3% | 41.8% | 66.4% | 65.8% | 66.0% | 68.3% | 68.2% | 42.1% | 45.8% | 2.4% | |
| MNE | 0.91 | 0.85 | 0.83 | 0.84 | 0.84 | 0.73 | 0.72 | 0.75 | 0.73 | 0.73 | 0.80 | 0.79 | 0.95 | |
Each column represents one of the compared alignment methods (for a specific value of α for Fuse and Beams). Numbers in cell report (from top to bottom): the number of consistent clusters (#C), the number of proteins in consistent clusters (#P), the specificity (Spec.) and the MNE. In each row, the highest value is shown in bold.
When using sequence information only (i.e. α = 1), Fuse already outperforms other aligners, by creating a larger number of functionally consistent clusters that consist of a larger number of proteins than previous methods (Fig. 4). Fuse creates 418 clusters that are functionally consistent with respect to GO BP (containing jointly 2090 proteins), while the best competing method, Smetana, produces only 188 BP consistent clusters (containing jointly 1086 proteins). Fuse also creates 564 functionally consistent clusters with respect to GO MF (containing jointly 2820 proteins), while the best competing method, CSRW, produces only 308 MF consistent clusters (containing jointly 2205 proteins).
Fuse obtains the best results when it uses a combination of sequence similarities and NMTF predicted similarities. Including predicted similarities () allows for finding up to 9% more of BP consistent clusters and for up to 4% more of MF consistent clusters than when using sequence similarity alone (α = 1). Also, we note that these larger numbers of consistent clusters and proteins in them are not obtained at the cost of specificity or of MNE (Table 2).
Because Fuse produces almost twice as many consistent clusters as the competing approaches, comparing methods’ outputs directly may not be fair. To this end, first we score each cluster produced by Fuse with the sum of its proteins’ pairwise similarity scores. Then, we sort Fuse’s clusters by decreasing scores (i.e. from the cluster whose proteins are the most similar to the cluster whose proteins are the least similar) and consider the number of consistent clusters in that ordering. To compare Fuse against other methods, but on the same number of clusters that other methods produce, we take from Fuse’s output the same number of clusters as produced by other methods, that are top scoring in Fuse. For example, Smetana outputs 1279 BP annotated clusters out of which 188 are functionally consistent (note that Fuse outputs 3080 BP annotated clusters out of which 459 are functionally consistent). When we take from Fuse’s output the 1279 BP highest scoring annotated clusters, we get 247 that are BP functionally consistent (in contrast to the 188 that are BP consistent by Smetana). Similarly, Fuse outperforms Smetana, CSRW and NH in both BP and MF consistent clusters (Supplementary Fig. S3) and it outperforms Beams in BP consistent clusters. For MF, Beams achieves a slightly larger number of MF consistent clusters, 312 of them out of 457 MF annotated clusters, as opposed to Fuse’s 299 clusters that are MF consistent (out of the 457 top scoring Fuse’s MF annotated clusters, Supplementary Fig. S3). However, the number of proteins in the 312 of Beam’s MF consistent clusters is only 1628, while Fuse produces in total 588 MF consistent clusters that contain in total 2940 proteins.
Another advantage of Fuse over other aligners is that in the NMTF step, it can predict new associations between proteins whose sequence similarity is not significant (i.e. e value ). These associations can contribute to the identification of functionally consistent clusters that cannot be identified by other aligners. For example, Fuse can identify a cluster of five proteins (across five species) where only a subset of them have similar sequences (e value ), while others are predicted to be related based on the NMTF scores. In this case, the other aligners cannot identify five-protein clusters because their performance is based only on sequence similarity scores, and they cannot predict new protein associations. We identify 18 clusters covering all 5 species (see Supplementary Section S5). One of them includes proteins: HPS6 (human), HPS6 (mouse), SEC72 (yeast), ABU-1 (worm) and NIMC2 (fly); since the first three and the last two proteins have similar sequences, if the alignment was based only on sequence similarity, it would have resulted in two clusters covering three and two species, respectively. However, because of the predicted association between HPS6 (mouse) and ABU-1 (worm), Fuse was able to identify a cluster of related proteins in all 5 species. These proteins are all involved in the immune response and also the first four proteins are located in the endoplasmic reticulum (details are in Supplementary Section S5).
Fuse is also computationally efficient and scalable. The matrix factorization step is an time operation, where n is the total number of proteins in all PPI networks. On our dataset, the matrix factorization step is the most time consuming and requires 10 h to complete. The alignment step has a smaller time complexity of , where n is the number nodes in Fuse’s k-partite graph (i.e. the total number of proteins in all PPI networks), and e is the total number of edges in Fuse’s k-partite graph and on our dataset, the alignment process requires less than 15 min. The time complexity of Beams is , where d is the maximum degree of a node in Beams’ k-partite graph. Beams complexity becomes larger than Fuse’s one when its k-partite graph becomes denser (i.e. when d tends to n). Aligning our PPI networks with Beams requires 78 h. NH also has a large time complexity, , although on our dataset it takes a short running times of 1 h. Finally, Smetana and CSRW have the smallest time complexities of and on our dataset their computations require 1 h for Smetana and 3 h for CSRW.
5 Conclusions
In this article, we propose Fuse, a novel global multiple network alignment algorithm which can efficiently align even the largest currently available PPI networks. Fuse computes novel similarity scores between the proteins in PPI networks by fusing all PPI network topologies and their protein sequence similarities by using NMTF. We show that these new similarities complement solely sequence-based ones: NMTF predicts as similar 13 times more protein pairs than sequence alone does and these predicted protein pairs are functionally consistent. This demonstrates the power of data integration and contribution of network topology to sequence-based methods for finding functionally consistent proteins in different species.
We define new functional similarity scores between the proteins by combining the similarity scores obtained by NMTF with the sequence-based ones using a user-defined balancing parameter α to either favour one or the other. Fuse uses these functional scores to construct global one-to-one multiple network alignment by using a novel maximum weight k-partite matching heuristic algorithm.
We compare the alignments of Fuse to the ones of the state-of-the art aligners, Beams, Smetana, CSRW and NH. We find that even when using solely protein sequence similarity, Fuse already outperforms all other network aligners by producing a larger number of functionally homogeneous clusters that cover all aligned networks. This shows the superiority of our k-partite matching heuristic to produce biologically meaningful multiple network alignments. Additionally, we find that the results of Fuse are even better when functional similarity scores are created from both sequence and NMTF scores (when ) rather than when using sequence information only (when α = 1). This again demonstrates complementarity of sequence and network topology in carrying biological information.
Funding
This work was supported by the European Research Council (ERC) Starting Independent Researcher Grant 278212, the National Science Foundation (NSF) Cyber-Enabled Discovery and Innovation (CDI) OIA-1028394, the ARRS project J1-5454 and the Serbian Ministry of Education and Science Project III44006.
Conflict of Interest: none declared.
References
Author notes
†The authors wish it to be known that, in their opinion, the first two authors should be regarded as Joint First Authors.
Associate Editor: Igor Jurisica and Alfonso Valencia

