


Abstract
Motivation: Gene ontology (GO) is a widely used resource to describe the attributes for gene products. However, automatic GO maintenance remains to be difficult because of the complex logical reasoning and the need of biological knowledge that are not explicitly represented in the GO. The existing studies either construct whole GO based on network data or only infer the relations between existing GO terms. None is purposed to add new terms automatically to the existing GO.
Results: We proposed a new algorithm ‘GOExtender’ to efficiently identify all the connected gene pairs labeled by the same parent GO terms. GOExtender is used to predict new GO terms with biological network data, and connect them to the existing GO. Evaluation tests on biological process and cellular component categories of different GO releases showed that GOExtender can extend new GO terms automatically based on the biological network. Furthermore, we applied GOExtender to the recent release of GO and discovered new GO terms with strong support from literature.
Availability and implementation: Software and supplementary document are available at www.msu.edu/%7Ejinchen/GOExtender
Contact: [email protected] or [email protected]
Supplementary information: Supplementary data are available at Bioinformatics online.
1 Introduction
Gene ontology (GO) has been widely used to capture the functional information and attributes for gene products, such as predicting gene functional associations (Gene Ontology Consortium, 2001; Vafaee et al., 2013), inferring gene functions in genome-wide association studies (Holmans et al., 2009), predicting protein functions (Pandey et al., 2006; Radivojac et al., 2013) and predicting subcellular localizations (Lu and Hunter, 2005). GO consists of three independent categories: biological process, molecular function, and cellular component. In each category, GO terms are organized in a directed acyclic graph (DAG) to represent a complex hierarchy of biological events, functions or locations (Gene Ontology Consortium, 2000; Škunca et al., 2012).
Till September 2014, GO has represented a total of 41 775 terms and 4 185 487 gene annotations from more than 80 species (Gene Ontology Consortium, 2015). However, despite the rapid increase of the GO content, the GO structure is still manually curated by teams of domain experts of the participating databases (Gene Ontology Consortium, 2015), regardless of continually growing and improving requests for new ontological terms (Dietze et al., 2014).
Manual construction of ontology, as a complex and time-consuming process, has encountered a series of problems that are becoming increasingly difficult to solve (Dietze et al., 2014; Dutkowski et al., 2013; Gligorijević et al., 2014). First, given the large volume of biological papers published in every year, it has been difficult to maintain consistency in how literature and domain expertise can be translated to terms and relationships in GO even with stringent curation standards (Dutkowski et al., 2013). Second, although knowledge can be effectively retrieved from the literature using advanced text-mining tools, the gap between biological knowledge and new GO terms and relationships still has not been met (Gligorijević et al., 2014). Finally, there has been a strong bias in coverage within GO toward well-studied processes, resulting in the lack of coverage problem (Kramer et al., 2014).
During the last decade, tools have been developed to define new ontology terms and to discover new relationships between existing GO terms using natural language processing, graph mining, and data integration methods (Cimiano and Völker, 2005; Drymonas et al., 2010; Gherasim et al., 2013; Jaimes and Smith, 2003; Savova et al., 2003; Wong et al., 2012). These tools aim to facilitate the effective expansion of GO while ensuring validity, uniqueness and proper relationships to the existing GO. However, automatic GO maintenance remains to be a difficult task because of the complex logical reasoning and the need of biological knowledge that are not explicitly represented in the GO (Gene Ontology Consortium, 2001). Furthermore, the complicated GO structure, which allows for multiple ancestors and multiple descendants for new GO terms, increase the level of difficulty for GO update. For example, statistics shows that, in the 1980 new biological process terms that have been added to the GO between 2008 and 2013, 992 new terms share at least 25% gene annotations with the existing terms (without gene annotation prorogation), indicating that it is necessary to fully consider the complex multiparent relationships when adding new terms to the GO.
In this article, we present a new algorithm called GOExtender to automatically identify new GO terms from the existing biological network data, annotate the new GO term with new genes, and connect them to the existing GO structure. Comparing to the existing approaches, GOExtender has the following advantages:
To the best of our knowledge, GOExtender is the first approach to automatically add new terms to the existing GO, rather than generating a new GO structure;
A novel edge-based clustering method is developed to effectively connect new GO terms with multiple parent terms;
Experiments on both biological process and cellular component show that GOExtender is able to identify novel GO terms from biological networks;
Applying GOExtender to recent release of GO has discovered new GO terms with solid supports from literature.
We expect that applying GOExtender on the newest version of GO can help curators rapidly generate new terms and connect them to the GO structure, to fill the gap between massive biological data and the biological knowledge represented in GO.
2 Background
Tools to define new ontology terms and to discover relationships between them can be classified into three categories.
First, text mining methods that can handle the natural ambiguity and subjectivity of natural language have been adopted to construct new ontologies. For instance, a semiautomatic text-based approach has been proposed to construct multimedia ontologies based on the textual data available in video collection, which successfully discovers relationships between terms manually selected by users (Jaimes and Smith, 2003). However, it is difficult to apply these methods to directly identify new GO terms and connect them to the existing GO terms, because GO terms appear in textual data with a low frequency (Shah et al., 2012).
Next, algorithms have been presented to synthesize data-driven ontologies by incorporating both extant terms and the connections between genes in biological networks. DDOnt automatically reconnects the existing GO terms based on a biological network, which brings new insights into sets of genes across microarray experiments (Costello et al., 2009). In parallel, a data integration method has been presented to add new relationships to connect the existing GO terms using biological networks (Gligorijević et al., 2014). These algorithms indicate that biological networks, such as YeastNet (Kim et al., 2014) and AraNet (Lee et al., 2010), are critical for novel systems biology applications (Costello et al., 2009; Kim et al., 2014; Lee et al., 2010).
Finally, algorithm NEXO has been developed to construct high-quality ontological structure directly from biological networks (Dutkowski et al., 2013, 2014). The ontology inferred from the large networks of gene and protein interactions in yeast shows that its coverage and power are equivalent to those of the manually curated GO. Again, NEXO indicates that biological networks are valid complementary resources of the GO (Dutkowski et al., 2013). However, to the best of our knowledge, neither NEXO nor the other existing algorithms can add new terms to the existing GO.
In order to automatically add new terms to the existing GO, several existing tools can be utilized. First, hierarchical graph clustering algorithms such as HAC (Park and Bader, 2011) identify graph clusters that represent ‘communities’ in the graph. Specifically, given a gene network, HAC builds a binary dendrogram, in which each leaf node represents a gene and a non-leaf node represents a gene cluster that includes all its descendant leaf nodes. We can extend the GO by running HAC on every GO term to extend. However, it is technically difficult to manually specify appropriate dendrogram thresholds for all the network clustering results. Second, we can extend the current GO by applying NEXO on every GO term to extend (Dutkowski et al., 2013). On each run of NEXO, a DAG will be generated, in which each non-leaf node represents a new term. We can further predict new terms with multiple parents by merging the identical terms predicted under different parent terms. While the aforementioned methods are optimized to identify new terms with single parent term, we can use the concept of gene overlap for multiparent GO term extension. The idea of GeneOverlap is to identify the overlapped gene sets among multiple GO terms, where the significantly overlapped gene sets are considered as new terms. For example, given two existing GO terms p1 and p2 containing genes {A, B, C, D, E} and {C, D, E, F, G}, respectively, a new term containing genes {C, D, E} is predicted as the common child term of p1 and p2. A clear disadvantage of GeneOverlap is that it cannot utilize biological networks, which have already been proven to be valid complementary resources of the GO. In the Result section, we compare the performance of all these methods.
3 Methods
We propose a novel algorithm called GOExtender to predict new GO terms and then add them to the existing GO structure. To achieve the goal, GOExtender consists of four steps. First, it selects candidate parent terms from all GO terms, saved in T. Second, it constructs an edge based matrix M using T and biological network G. Third, all the connected maximal submatrices Mc will be identified with a novel matrix partitioning method. Finally, it predicts new GO terms from Mc by adopting a graph clustering algorithm. The diagram of the whole process is shown in Fig. 1.

The workflow of GOExtender. First, candidate parent terms T are selected. Second, an edge based matrix M is generated using biological network G and T. Third, all the connected maximal submatrices of M are identified and are saved in Mc. Finally, new GO terms are predicted from Mc by adopting a graph clustering algorithm
3.1 Identifying candidate parent terms
In order to effectively reduce the search space for finding new GO terms, we identify all the extendable terms t based on the GO structure, gene annotations and biological networks by checking two conditions: (i) after gene annotation propagation, whether there is a high amount of genes in the input network annotated to t but not to the dependents of t and (ii) whether the level of the term t in the GO is appropriate. Given a GO and a biological network, the candidate parent term is defined as:
Candidate Parent Term. A GO term t is a candidate parent term if and only if the number of annotated genes of t but not to its dependents is greater than p1, the number of descendants of t is greater than p2, and none of the descendants of t is a candidate parent term.
In Definition 1, p1 and p2 are user given thresholds, which prevent from generating trivial terms. The definition also eliminates the parent–child relationships between candidate parent terms, making the GO term prediction problem more practical. Note that although the GO structure is constant, both the gene annotations and the biological network are specific for each genome. Therefore, the candidate parent terms are genome dependent.
To identify all the candidate parent terms, we start by checking all the leaf terms and then recursively check all the parental terms of t. If a term t is qualified, we output t and skip all its ancestor terms, because according to the definition, none of t’s ancestors can be a candidate parent term. All the candidate parent terms are saved in T.
3.2 Constructing edge-based binary matrix
Given all the candidate parent terms, the most straightforward approach to adding putative new terms for each candidate parent term t is to scan the biological network with the existing term discovery approaches, such as NEXO (Dutkowski et al., 2013). The rationale is that if the genes annotated to t can form a group of graph clusters in the input biological network, and then each gene cluster may represent a new GO term (Dutkowski et al., 2013). However, this approach can only discover new terms for each individual candidate parent term. A comparison between the GO biological process terms in 2008 and 2013 shows that more than 71% of the new terms have multiple parent terms, indicating that simultaneously considering all the candidate parent terms is required.
In this article, we integrate the information contained in all candidate parent terms T and the gene cofunction network G by constructing the edge-based binary matrix M. The procedure is shown in Fig. 2. Mathematically, each column of M is a candidate parent term t; and each row is a pair of genes that are annotated to the same candidate parent term and are connected in the gene co-function network G. A cell M(i, j) is 1 if the corresponding genes in the ith row are both annotated to the candidate parent term in the jth column and are connected in the co-function network, otherwise M(i, j) is 0.
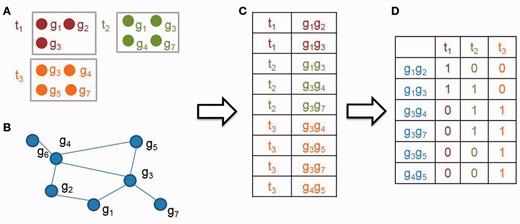
An illustrative example to generate the edge based matrix M. First, an gene pair list (C) is generated based on the list of candidate parent terms and the annotation genes (A) and the gene association network (B). Second, an edge-based binary matrix M (D) is constructed, in which rows and columns represent gene pairs (C) and candidate parent terms (A), respectively. M(i, j) is one or zero, meaning whether the gene pair at the ith row is annotated to the candidate parent term at jth column or not
In an illustrative example, given three candidate parent terms t1, t2 and t3, and a biological network G (Fig. 2A and B), we first label all the gene pairs that satisfy two conditions: (i) both genes are annotated to the same candidate parent term and (ii) the corresponding edge of the gene pair is in G (Fig. 2C). And then, we construct an edge-based binary matrix M, such that each row in M is a gene pair, each column is a candidate parent term, and each cell is one or zero, meaning whether a gene pair is annotated to its corresponding candidate parent term (Fig. 2D).
3.3 Mining connected maximal submatrices
To predict new GO terms that may have multiple parent terms, we identify subsets of M, where each subset consists of a subgraph of G, in which all genes are annotated by the same candidate parent terms. This problem is equivalent to mining from M the submatrices with all values being 1 and the gene pairs (rows) are connected in the given biological network G.
To efficiently solve the problem, we first define Connected Maximal Submatrix in Definition 2, and then describe a new hierarchical partitioning approach based on D-Miner (Besson et al., 2004; Ji et al., 2006).
Connected Maximal Submatrix. Let M(E, T) be a binary matrix with rows and columns, where E is a set of edges, and T is a set of terms. We have matrix be the connected maximal submatrix of M(E, T), if and only if all the four conditions are satisfied:
, and
, there exists such that, and
, there exists such that, and
Edge set ES forms a connected graph.
In Definition 2, requiring for connected submatrices prevents generating numerous disconnected subgraphs thus improves the efficiency of the algorithm. And identifying the maximal submatrices ensures to find all the gene annotations for the new GO terms.
Algorithm 1. Mining connected maximal submatrices
1: procedure SubMatrixMining
Input:
M: edge-based binary matrix
G: biological network
p3: threshold of the minimum number of genes
Output:
O: a set of connected maximal submatrices
2: enqueue(ML, M)
3: while do
4:
5:
6: for allcutterdo
7: n number of genes in Mx cut by h
8: ifn > Maxthen
9:
10: end if
11: end for
12: Ml, Mr▹ split Mx using cutter hmax
13: MS ▹ split Ml by checking graph connectivity
14: MS ▹ split Mr by checking graph connectivity
15: for alldo
16: if number of genes in then
17: skip My
18: end if
19: ifMy is all-”1” submatrix then
20:
21: else
22:
23: end if
24: end for
25: end while
26: end procedure
We develop an efficient algorithm to quickly identify all the connected maximal submatrices. The process begins with the edge-based binary matrix M, and then it iteratively splits the current matrix into multiple submatrices by reducing the number of cells valued 0 row-by-row or column-by-column while keeping the edges in a submatrix forming a connected graph. The partitioning process will stop if one of the following stopping criteria is satisfied: (i) all 0s are removed from all submatrices; (ii) the number of genes containing in a submatrix is smaller than a user-given threshold p3. The process to reduce the number of cells valued 0 is to split the input matrix by using a cutter h, where h is a set of all-‘0’ rows and columns in M, such that the input matrix is split into a left (right) submatrix, when rows (columns) containing ‘0’ are removed (Besson et al., 2004; Ji et al., 2006). Specifically, our matrix partitioning process has the following three steps:
In the initiation step, we generate a set of cutters H for the edge-based binary matrix M. We add M to matrix set ML (line 2 in Algorithm 1).
For each matrix Mx in ML, we remove it from ML and split it with the cutter with the highest amount of valid genes in H. In the matrix splitting process, we adopt the left cutting constraint to avoid submatrix duplication (Besson et al., 2005) (lines 4–12 in Algorithm 1).
The resulting matrices of the previous step are further split using graph connectivity. If a matrix contains less than p3 genes, it will be deleted. If it is all-‘1’ submatrix, it will be outputted, otherwise it will be added back to ML (lines 13–24 in Algorithm 1).
We repeat steps 2 and 3 until ML is empty (lines 3–25 in Algorithm 1). Finally, all the connected maximal submatrices of the input matrix M are identified. The second step ensures that we can obtain all-‘1’ submatrices as soon as possible and therefore efficiently decrease the height of the hierarchical partitioning tree.
The purpose of adopting the left cutting constraint is that when generating the right child submatrix of Mx, we must check that , where HL is the set of cutters associated with the left branches of the path from the root (initial matrix M) to mr.
An illustrative example is shown in Fig. 3. Based on the number of genes, the sorted cutter set H is . In the first iteration, we split m1 into m2 and m3. By checking graph connectivity, m3 is further split into m4 and m5, but m5 is removed since its size is smaller than p3 (). In the end of the first iteration, . In the second iteration, we select the most efficient cutter ()(t3). m6 is pruned because its size is smaller than threshold p3. m8 is outputted, and . After the last iteration, ML is empty and we successfully discover three all-‘1’ submatrices from m1, i.e. m8, m9 and m10.
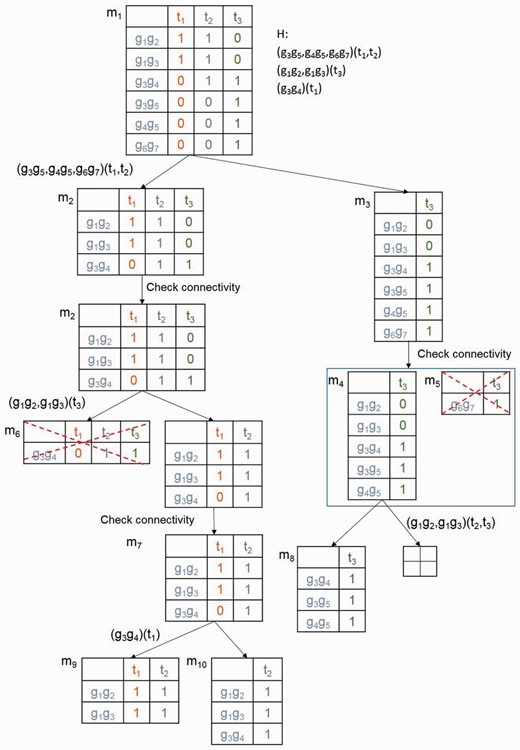
An illustrative example for the process of mining the connected maximal submatrices. mx represents a matrix. Hx is the set of sorted cutters for matrix mx. Hx is decreasing sorted based on the size of genes involved in the rows of mx. m5 and m6 are pruned as its size is smaller than the given threshold. m8, m9 and m10 are the connected maximal submatrices of given m1
The example shows that our approach can not only identify genes that are connected in the biological network, which may lead to new GO term discovery, but also identifies multiple common candidate parent terms.
3.4 Predicting new terms and new term relationships
According to Definition 2, each connected maximal submatrix represents a subgraph , where VS is the set of genes in ES. Hence, predicting new terms from is equivalent to identifying communities in GS, such that a community is considered as a predicted term, and the genes in the community are all annotated to the predicted term. To achieve the goal, we adopt HAC (Park and Bader, 2011), a hierarchical graph clustering algorithm, because HAC outperforms traditional hierarchical graph clustering algorithms in ontology term prediction (Eisen et al., 1998; Dutkowski et al., 2013; Girvan and Newman, 2002; Zhang and Horvath, 2005).
HAC generates a binary dendrogram for each connected maximal submatrix , in which the leaf nodes and the non-leaf nodes represent gene sets and the joining of gene sets in GS, respectively (Park and Bader, 2011). For community detection, we need to specify a threshold to cut the dendrogram. However, given the numerous amount of submatrices, it is impossible to manually determine the dendrogram threshold for every submatrix. Besides, these submatrices are highly overlapped, which may lead to redundant new GO terms. To solve both problems, we propose a new method to simultaneously identify nearly identical communities from the highly overlapped connected maximal submatrices. The rationale is that the dendrogram thresholds should be carefully chosen to maximize the agreement on gene grouping among all the highly overlapped submatrices.
Second, given a group of highly overlapped connected maximal submatrices labeled as , we assign a length-n binary vector for each gene g, where each element in is ‘1’ or ‘0’ representing whether g exists in the corresponding submatrix. To identify (nearly) identical communities from all the submatrices, we cut the dendrograms such that the highly overlapped genes are grouped into the same community.
Given all the dendrograms of a group of highly overlapped maximal connected submatrices, we select the best cutoffs by minimizing the variance calculated with Equation 4. In case that there are no highly overlapped submatrices, we use edge density as the criteria for community detection. Edge density of a gene group X is defined as , where NE(X) is the number of edges between any two genes in X in a biological network G and (Dutkowski et al., 2013). Note that, among all the (nearly) identical communizes in the highly overlapped submatrices, we only retain the one with the highest number of parent terms.
4 Results
4.1 Data preparation
Four versions of GO data (Jan 2007, Jan 2009, Jan 2011 and Jan 2013) were downloaded from www.geneontology.org. For the biological network, we reused the gene association network in NEXO (Dutkowski et al., 2013) (http://www.nature.com/nbt/journal/v31/n1/extref/nbt.2463-S6.xlsx), which integrated four yeast networks from the public databases, i.e. physical protein–protein interactions–BioGRID (Stark et al., 2011), genetic interactions–DRYGIN database (Costanzo et al., 2010), co-expression relationships–Stanford Microarray Database (Hubble et al., 2009) and the integrated functional network–YeastNET (Lee et al., 2007). GOExtender was implemented with Java SDK 7 and the JUNG library (OMadadhain et al., 2005).
4.2 Performance evaluation criteria
We develop a procedure to evaluate the performance of GOExtender on multiple versions of GO and compare it with four existing GO term prediction methods. In this procedure, given each candidate parent term, we identify all its leaf terms having at least p3 genes, where p3 is a user-specified parameter, and add them to the gold-standard term set. All the gold-standard terms are hidden from the GO extension algorithms for performance evaluation.
Using all the aforementioned evaluation methods, we compared the performance of GOExtender with four existing algorithms, i.e. SubMatrix, HAC, NEXO and GeneOverlap. SubMatrix is a component of GOExtender to identify the connected maximal submatrices (see Subsection 3.3). In this method, each maximal connected submatrix, regardless of its topological properties, is considered as a predicted term. The other three methods are introduced in the Background section.
4.3 GOExtender results
GOExtender was tested on the biological process and the cellular component categories of four versions of GO. In each GO version, all the terms that qualify the criteria described in Subsection 3.1 were considered as the candidate parent terms. In our experiments, p1, p2 and p3 were set to 50, 10 and 4, respectively. We applied GOExtender and four existing algorithms, i.e. SubMatrix, HAC, NEXO and GeneOverlap on the same datasets. Note that we did not test GOExtender on the molecular function category of GO because the gene association network used in the evaluation test is not constructed based on sequence similarity (Kim et al., 2014). Also, according to our definition, the number of candidate parent terms is subject to the GO, the biological network and the parameters p1 and p2. Therefore, although there are thousands of existing terms in GO, less than 100 terms were considered as candidate parent terms in each version of GO.
On the biological process category, 38, 50, 68 and 64 candidate parent terms were selected from the GO of 2007, 2009, 2011 and 2013, respectively (Table 1). And 190, 239, 272 and 284 gold-standard terms were hidden from GOExtender. Our method predicted 183, 265, 289 and 282 new terms for the four different GO versions, respectively.
The numbers of candidate parent terms and gold-standard terms generated based on different versions of GO
| Cellular component | Biological process | |||
|---|---|---|---|---|
| GO version | Parent terms | Gold-standard | Parent terms | Gold standard |
| Jan. 2007 | 13 | 86 | 38 | 190 |
| Jan. 2009 | 15 | 90 | 50 | 239 |
| Jan. 2011 | 19 | 117 | 68 | 272 |
| Jan. 2013 | 16 | 113 | 64 | 284 |
| Cellular component | Biological process | |||
|---|---|---|---|---|
| GO version | Parent terms | Gold-standard | Parent terms | Gold standard |
| Jan. 2007 | 13 | 86 | 38 | 190 |
| Jan. 2009 | 15 | 90 | 50 | 239 |
| Jan. 2011 | 19 | 117 | 68 | 272 |
| Jan. 2013 | 16 | 113 | 64 | 284 |
On the cellular component category, we chose 13, 15, 19 and 16 candidate parent terms and hid 190, 239, 272 and 284 gold-standard terms in the GO of 2007, 2009, 2011 and 2013, respectively (Table 1). GOExtender predicted 86, 90, 117 and 113 new terms for the four different GO versions, respectively.
The software is available on our project website. It can process user-specified data with customized parameters. The new GO structure will be saved in OBO format, which can be visualized using ontology visualization tools such as OBO-Edit (see Supplementary Fig. S1) (Day-Richter et al., 2007). The GO annotation file will be extended accordingly by adding all the new annotations to the predicted terms.
4.4 Performance evaluation on biological process
We tested the performance of GOExtender and the other four methods by comparing the predicted terms with the gold standard terms on each of the four versions of GO data in the biological process category. In general, GOExtender has the highest performance in all the tests. On the 2007 version of GO, the CPR and F1 score of GOExtender are 0.17 and 0.21, which are much higher than the second best method HAC (0.13 and 0.18) (Fig. 4A and B, Supplementary Table S1). We also tested the performance of all the five methods on the 2009, 2011 and 2013 versions of GO. On all the tests, GOExtender has the highest CPR scores and the highest F1 scores (Fig. 4A and B, Supplementary Table S1). Specifically, the CPR scores of GOExtender on 2009, 2011 and 2013 are 0.16, 0.15 and 0.16, respectively, which are in average 50% higher than the second best measures (Fig. 4A and B, Supplementary Table S1). The F1 scores of GOExtender on 2009, 2011 and 2013 are 0.19, 0.19 and 0.20, respectively, which are in average 25% higher than the second best measures (Fig. 4A and B, Supplementary Table S1). The CGR of GOExtender, however, is not always the highest, since NEXO has a better recall (Supplementary Fig. S2).
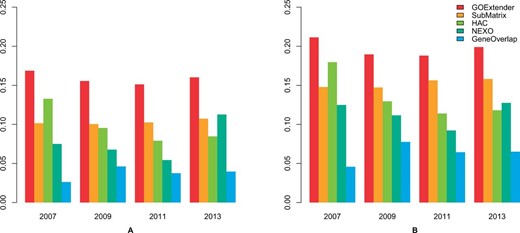
Performance comparison on five GO term prediction methods using biological process. The scores are the correct prediction rate (CPR) (A) and F1 (B) on the GO versions of January 2007, January 2009, January 2011 and January 2013
On the FDR based criteria, both the precision and the recall of GOExtender are the highest among all the five methods (Fig. 6A). In all versions of GO, the precision of GOExtender is 39% higher than that of the second best methods. The only exception is that HAC and GOExtender are equally well on the precision on the 2009 version of GO (Fig. 6A). Note that since we cannot identify a qualified FDR for NEXO on the 2007, 2009, 2013 versions of GO data and HAC on the 2011 version of GO, we chose to report the results with the closest FDR.
Finally, we applied all the five methods on the 2009 version of GO and counted the number of new GO terms in the 2011 and 2013 version of GO that could be correctly predicted. The test shows that GOExtender has the overall highest performance. On the 2011 version of GO, GOExtender has the highest CPR score (0.020, Supplementary Fig. S3A). The F1 of GOExtender and NEXO are very close (0.029 and 0.030, Supplementary Fig. S3B). On the 2013 version of GO, the score of GOExtender is at least 64% higher than the other measures (Supplementary Fig. S3A and Supplementary Data). On the FDR based criteria, GOExtender has the highest precision among all the methods (Supplementary Fig. S4), and its recall is the second best (Supplementary Fig. S4).
4.5 Performance evaluation on cellular component
We tested the performance of GOExtender and the other four methods on the GO cellular component category with the same evaluation methods used in the GO biological process data. In all the tests, GOExtender performed the best and was significantly better than the other four methods. Figure 5 shows the performance of all the five methods on the 2007 version of the GO cellular component category, in which GOExtender achieves the highest F1 score. In addition, the CPR and F1 of GOExtender on the 2009 version of GO are 0.20 and 0.25, respectively, significantly higher than the second best method (0.10 for both CPR and F1) (Fig. 5A and B, Supplementary Table S2). On the 2011 and 2013 versions of GO, the CPR and F1 score of GOExtender are both significantly higher than the second best method NEXO (Fig. 5A and B). The CGR of GOExtender, however, is the second highest (Supplementary Fig. S5), since NEXO has better recall. We compared all the methods using the FDR based criteria on cellular component. In all the tests, the precision of GOExtender is at least 20% higher than the second best method (Fig. 6B). We also found that NEXO had the highest recall in cellular component.
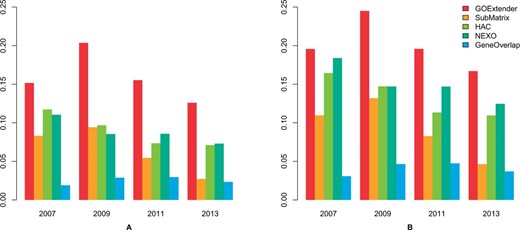
Performance comparison on five GO term prediction methods using cellular component. The scores are the correct prediction rate (CPR) (A) and F1 (B) on the GO versions of January 2007, January 2009, January 2011 and January 2013
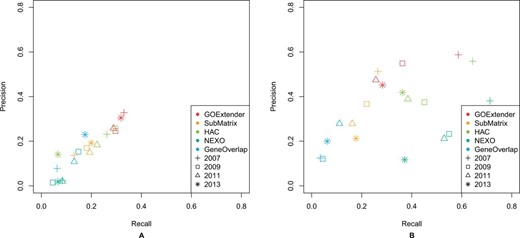
Performance comparison on five GO term prediction methods on biological process (A) and cellular component (B) using FDR based criteria. Different colors in the figures represent different methods and different shapes represent different versions of GO data
4.6 Extending the most recent GO
We applied GOExtender on the most recent GO biological process data (2015 January) and predicted 201 new terms that extend 30 candidate parent terms. The complete list is in Supplementary Table S3. Here, we introduce two of them.
A new term possibly named as ‘DNA repair through recombination or replication’ was identified under three existing terms: DNA recombination (GO:0006310), DNA replication (GO:0006260) and DNA repair (GO:0006281) (Fig. 7). The integrity of genome is under constant threat due to DNA damage that results from a series of endogenous processes and exogenous agents, such as reactive oxygen species, replication defect, UV exposure and other radiation. To maintain genome stability, the network of DNA repair mechanisms is activated in response to DNA damage, thus is considered the surveillance system of the genome (Croteau et al., 2014; Sancar et al., 2004). The intrinsic connection among DNA repair, replication and recombination is tight but complicated. For example, DNA repair requires unwinding of the double strand DNA enabled by essential helicases and their interacting proteins, which are functioning in DNA replication. Importantly, members of DNA helicase family have specific and redundant binding affinity and function to different DNA repair intermediates (Croteau et al., 2014). Besides, DNA homologous recombination is one of the most important mechanisms that repair double-strand breaks (DSBs) (Croteau et al., 2014). The recognition of DSBs by the MRN complex leads to accumulation of RPA proteins, which interacts with all human RecQ helicases, and eventually homologous recombination (Ciccia and Elledge, 2010; Croteau et al., 2014). In addition, the importance of DNA repair and its connection to replication, recombination can also be reflected by diseases and cellular defects that are associated with mutations in essential proteins players.
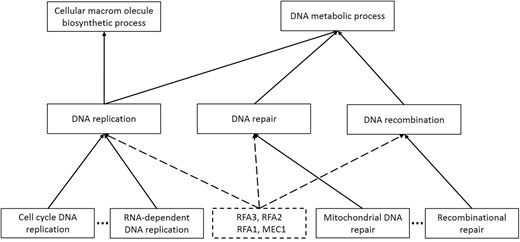
Case study of new term prediction by GOExtender on the most recent GO. The dashed rectangle is the predicted new term. The dashed lines represent the relationship between the predicted term and the existing GO terms
Adding a new term to connect DNA repair, recombination and replication can better represent the intertwined relationship among them and better annotate key proteins. Indeed, we found that four genes RFA3, RFA2, RFA1 and MEC1 participate in the all the three processes and can be annotated to the new term (Bandhu et al., 2014; Nakada et al., 2004, 2005; Wold, 1997; Zou and Elledge, 2003).
Interestingly, another new term predicted by GOExtender is under DNA repair (GO:0006281) and cell division (GO:0051301), which are far from each other in the GO structure. However, the annotated genes to the new term, i.e. RTT101, MMS22 and MMS1, are involved in the same pathway to maintain genomic integrity during DNA replication, probably indicating the latent relationships between distinct biological processes (Wan et al., 2013).
5 Discussion and conclusion
Recently, researchers have started to use omics data to construct GO or to identify new relationships between the existing GO terms. However, there is no existing method to predict new terms for the existing GO. In this article, we proposed a novel algorithm called ‘GOExtender’ to automatically predict new GO terms by using biological networks, and connect them to the existing GO with a new edge-based clustering algorithm. GOExtender has four steps. First, it selects candidate parent terms from all GO terms, saved in T. Second, it constructs an edge based matrix M using T and biological network G. Third, all the connected maximal submatrices (called Mc) of M will be identified by a novel hierarchical partitioning method. Finally, it predicts new GO terms from Mc by adopting a graph clustering algorithm.
Since there are three key parameters p1, p2 and p3 in GOExtender, we tested the effect of each parameter on the 2013 version of GO on the biological process category by varying one parameter while fixing the other two. First, we fixed and , and changed p1 from 25 to 100. Second, we fixed and , and changed p2 from 10 to 40. In both tests, the F1 scores are consistent (Supplementary Table S4 and S5) indicating that the performance of GOExtender is not volatile with the change of p1 and p2. Finally, we fixed and , and varied p3 from 4 to 30. The results show that the F1 score decreases from 0.20 to 0.05, indicating that although GOExtender outperforms the compared methods, it is not suitable to predict general terms (Supplementary Table S6), meaning GOExtender is more suitable to extend the existing GO rather than to build a new ontology structure.
We also found that the number of candidate parent terms and gold-standard terms were strongly affected by the parameters. For example, when fixing and , and varying p1 from 25 to 100, the number of candidate parent terms changes from 41 to 47, 64 and 106 for p1 being 100, 75, 50 and 25, respectively. Note that there are significantly more new terms in the biological process than in cellular component. This is probably because there are more existing GO terms in the biological process. For example, in the 2014 version of GO, the number of terms in the biological process and cellular component categories is 27 284 and 3758, respectively. Since the abundance of the existing terms is different, it is likely that there are more candidate parent terms in the biological process than in cellular component.
We tested the scalability of GOExtender by comparing the execution time of NEXO and GOExtender on different biological networks and GO versions. First, we applied NEXO and GOExtender on the 2013 version of GO biological process category and two biological networks with different sizes. The integrated gene network has 5051 nodes and 29 789 edges, whereas BioGRID, a physical protein–protein interaction network, has 6226 nodes and 319 692 edges (10 times larger). Both GOExtender and NEXO took less than one and half minutes on the smaller network (Supplementary Fig. S6). On the larger network, GOExtender is 50 seconds slower than NEXO. Nevertheless, the total running time of GOExtender still falls within a reasonable range. Second, we applied NEXO and GOExtender on two different versions of GO (i.e. biological process in 2007 and 2013). The 2007 and 2013 GO data have 38 and 64 candidate parent terms, respectively. Supplementary Figure S7 shows that the running time of both GOExtender and NEXO are reasonable and are similar on these datasets. In summary, computational time is not a bottleneck for GOExtender.
To test the importance of the input biological network, we ran GOExtender on the 2013 version of GO (both biological process and cellular component categories) using four biological networks, i.e. the integrated network used in NEXO, YeastNet (Lee et al., 2007), BioGrid (Stark et al., 2011) and Genetic Interaction (Costanzo et al., 2010). The result shows that the integrated network has the best performance on biological process, and the genetic interaction network has resulted in the best performance on the cellular component (Supplementary Fig. S8). The results suggest that user should be cautious when selecting the input biological network.
By comparing GOExtender with four existing approaches, we found that GOExtender outperforms these methods on both the biological process and the cellular component categories of GO in four recent releases. Additionally, new GO terms with strong support from literature were found by applying GOExtender to the most recent version of GO. GOExtender may fill the gap between the massive biological data and the limited biological knowledge represented in GO. In the future work, we will extend GOExtender to enhance the relationships between the existing and predicted terms using unannotated genes (Pinoli et al., 2015).
Funding
Chemical Sciences, Geosciences and Biosciences Division, Office of Basic Energy Sciences, Office of Science, U.S. Department of Energy (award number DEFG02-91ER20021), the Natural Science Foundation of China (Nos: 61173085) and the National High-Tech Research and Development Program (863) of China (Nos: 2012AA020404, 2012AA02A602, 2012AA02A604 and 2014AA021505).
Conflict of Interest: none declared.
References
Author notes
Associate Editor: Igor Jurisica

