


Abstract
Motivation: Collecting millions of genetic variations is feasible with the advanced genotyping technology. With a huge amount of genetic variations data in hand, developing efficient algorithms to carry out the gene–gene interaction analysis in a timely manner has become one of the key problems in genome-wide association studies (GWAS). Boolean operation-based screening and testing (BOOST), a recent work in GWAS, completes gene–gene interaction analysis in 2.5 days on a desktop computer. Compared with central processing units (CPUs), graphic processing units (GPUs) are highly parallel hardware and provide massive computing resources. We are, therefore, motivated to use GPUs to further speed up the analysis of gene–gene interactions.
Results: We implement the BOOST method based on a GPU framework and name it GBOOST. GBOOST achieves a 40-fold speedup compared with BOOST. It completes the analysis of Wellcome Trust Case Control Consortium Type 2 Diabetes (WTCCC T2D) genome data within 1.34 h on a desktop computer equipped with Nvidia GeForce GTX 285 display card.
Availability: GBOOST code is available at http://bioinformatics.ust.hk/BOOST.html#GBOOST.
Contact: [email protected]; [email protected]
Supplementary information: Supplementary data are avaliable at Bioinformatics online.
1 INTRODUCTION
Interaction patterns of single-nucleotide polymorphism (SNP) can be used to interpret genetic disease risks in individuals. With the advances of technologies, the burden of collecting genome-wide DNA sequence variations has been lifted. The burst of genotype data leads to an urge of efficient algorithms to analyze many genome-wide association studies (GWAS) data in a reasonable period of time. A comprehensive review (Cordell, 2009) summarized some popular methods in detecting gene–gene interactions. PLINK was recommended as the most computationally feasible method for detecting gene–gene interactions in genome-wide data. It was reported that PLINK finished the pairwise interaction examination of 89 294 SNPs selected from the WTCCC Crohn disease dataset with ∼5000 samples in 14 days (Cordell, 2009).
Recently, Wan et al. (2010) proposed a fast method, named BOOST, to examine all pairwise interactions in genome-wide case–control studies. BOOST completed the pairwise interaction analysis of human genome data with ∼350 000 SNPs and ∼5000 samples on a computer with 3 GHz central processing unit (CPU) and 4 GB memory in 60 h.
However, we can foresee that the growth of data will overwhelm BOOST in the near future. Ma et al. (2008) suggested that the analysis time in GWAS can be largely reduced by parallel computing. The development of graphical processing units (GPUs) enables modern display cards to have hundreds of cores, providing a high memory bandwidth at a low price. A recent GPU implementation of the multifactor dimensionality reduction (MDR) method (Greene et al., 2010) has significantly reduced the time required for detecting gene–gene interactions. The demand of massive memory operations in collecting contingency tables and independence of analyzing different SNP pairs in BOOST make it suitable to implement BOOST in GPU. Here we propose GBOOST, a GPU implementation of BOOST. GBOOST is able to finish the genome-wide interaction analysis of a typical dataset on a single workstation within a few hours.
2 METHODS
GBOOST is a software package targeting at gene–gene interaction analysis of large genome data. It is a C++ parallel implementation of the BOOST method using Compute Unified Device Architecture runtime application programming interface (Corporation, 2008).
The computational burden of BOOST lies in the screening stage. Thus, GBOOST modifies input data structures and parallelizes computations in the screening stage. Figure 1 gives the key differences between BOOST and GBOOST. Please refer to the Supplementary data for the detailed implementation of GBOOST.
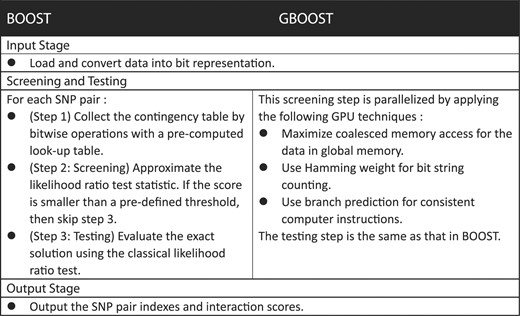
Main steps in BOOST and GBOOST. GBOOST parallelizes the screening step in BOOST to achieve a speedup of 40.
3 RESULTS AND DISCUSSION
Table 1 shows the performance of BOOST and GBOOST on different datasets. It also provides basic visualization by using two publicly available libraries JFreeChart (http://www.jfree.org/jfreechart) and JUNG (http://jung.sourceforge.net/). Figure 2 presents a pathway graph example generated from one GBOOST result.
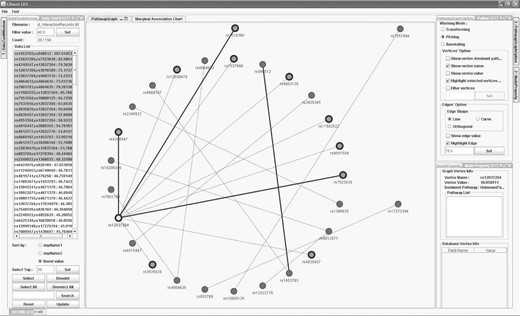
A snapshot of a pathway graph generated from 20 interaction pairs from one GBOOST result. Each node is labeled by its SNP name and the node value is the marginal association score from the association analysis. The edge value is the interaction score of the linked nodes (i.e. SNP pairs). Scaling, rotation and translation are available in the pathway graph. Various functions are also avaliable to remove or highlight components in the pathway graph. The layout can be interactively customized.
Running time of BOOST and GBOOST on different datasets
| BOOST | GBOOST | |
|---|---|---|
| n = 5000, p = 5000 | 42 s | 1.04 s |
| n = 5000, p = 10 000 | 170 s | 4.11 s |
| n = 5003, p = 351 542 | 60 h | 1.34 h |
| BOOST | GBOOST | |
|---|---|---|
| n = 5000, p = 5000 | 42 s | 1.04 s |
| n = 5000, p = 10 000 | 170 s | 4.11 s |
| n = 5003, p = 351 542 | 60 h | 1.34 h |
BOOST is tested on a computer with 3 GHz CPU. GBOOST is tested on a computer with a GTX 285 display card. Here n denotes sample size and p denotes number of SNPs.
In our future work, we plan to extend GBOOST to support execution on multiple GPUs and explore new memory optimization techniques.
ACKNOWLEDGEMENTS
We thank the editor and the anonymous reviewers for their constructive suggestions and comments.
Funding: This work was partially supported with grants RPC10EG04 and PCF004.09/10 from the Hong Kong University of Science and Technology.
Conflict of Interest: none declared.
REFERENCES
Author notes
Associate Editor: Alfonso Valencia

