


Abstract
Summary: The R453Plus1Toolbox is an R/Bioconductor package for the analysis of 454 Sequencing data. Projects generated with Roche's data analysis software can be imported into R allowing advanced and customized analyses within the R/Bioconductor environment for sequencing data. Several methods were implemented extending the current functionality of Roche's software. These extensions include methods for quality assurance and annotation of detected variants. Further, a pipeline for the detection of structural variants, e.g. balanced chromosomal translocations, is provided.
Availability: The R453Plus1Toolbox is implemented in R and available at http://www.bioconductor.org/. A vignette outlining typical workflows is included in the package.
Contact: [email protected]
Supplementary information: Supplementary data are available at Bioinformatics online.
1 INTRODUCTION
Roche 454 Sequencing technology produces hundreds of thousands of DNA sequences consisting of a few hundred nucleotides each (Margulies et al., 2005), thereby permitting highly sensitive detection of molecular mutations. Roche developed the GS FLX Data Analysis Software that enables researchers to handle the challenging analysis of the massively parallel sequencing data. The software implements a variety of standard analysis workflows, but so far an interface to programming languages like R is not available.
Hence, a few specialized pipelines (De Schrijver et al., 2010; Pandey et al., 2010) for highly customized analyses were developed. In contrast to these software packages, we present an R package that expands Roche GS FLX software by offering access to sequencing results generated by Roche's software from within R. Based on the R/Bioconductor infrastructure for sequencing data (Morgan et al., 2009), several new functions expanding the scope of Roche GS FLX software were implemented and further user-defined functions can easily be added. In addition, a pipeline for the detection of structural variants such as balanced chromosomal translocations or inversions was implemented, which is a functionality with great utility in the characterization of complex cancer genomes.
2 AVAILABLE FUNCTIONALITY
Most functions implemented in the toolbox were designed to support at least one of the following three use cases.
2.1 Analysis of PCR amplicon projects
Roche provides the GS Amplicon Variant Analyzer Application for the analysis of projects investigating massively parallel data generated from specifically designed polymerase chain reaction (PCR) products (Kohlmann et al., 2010). Properly configured projects can be read in and are represented as objects of class AVASet. This class facilitates to store different information about a project, such as sample information, reference sequences, amplicon coverage, detected variants, etc. coherently in one object. Based on this data structure, several methods were implemented that complement the functionality of the GS Amplicon Variant Analyzer Application.
For a successful amplicon sequencing project, it is important to ensure that a sufficient coverage of all amplicons across all samples in the experiment was achieved. Plots like Figure 1A or Supplementary Figure S1 can be generated within the toolbox to monitor the coverage of each sample. Similarly, plots showing the coverage of several samples stratified by lane, Pico-Titer-Plate, amplicon or multiplexer sequence can be generated. Integrated in a HTML-based quality report, these figures are helpful to control and monitor in-depth and high-throughput data quality in a routine set-up with many samples processed per run. For instance, we detected an influence of certain multiplexer sequences on the achieved coverage (Grossmann et al., 2011a).
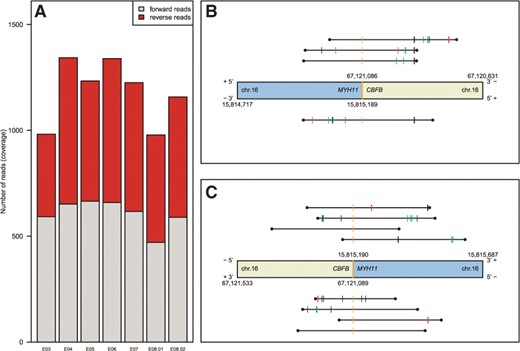
(A) Quality plot demonstrating a well-balanced coverage with forward and reverse reads targeting seven amplicons designed for the RUNX1 gene. (B) A chromosomal breakpoint spanned by four reads (black horizontal lines) as detected by our pipeline, identifying the inv(16)(p13q22) event. The different tick marks represent the breakpoints of the single reads as well as deletions, insertions and SNPs if existent. The genes involved are CBFB and MYH11. (C) Reciprocal breakpoint spanned by eight reads.
Comprehensive genomic annotation is important for the interpretation of detected variants. Given an amplicon sequencing project, the R453Plus1Toolbox allows to query the Ensembl database and to fetch and summarize all relevant information in a HTML report. For each mutation within a gene, as represented in the Variants Frequency Table of the GS Amplicon Variant Analyzer Application, the report shows the position (exon, intron, untranslated region) and potential amino acid changes with respect to each known transcript. Also, all detected variants are searched in the Ensembl variation database and linked to the corresponding entry if it exists.
Detected variants can be visualized by different plots. For example, all coding variants of one gene can be plotted at their position alongside a schematic gene (Supplementary Fig. S2). Single variants can be plotted showing coverage and percentage of reads that carry mutations in one plot (Supplementary Fig. S3).
2.2 Analysis of mapping projects
Mapping projects allow the alignment of arbitrary reads from one or more sequencing runs to a given reference sequence. Mapping projects analyzed with Roche's GS Mapper Software can be read in and are represented by instances of class MapperSet, which is similar to the AVASet class.
Many of the functionalities for amplicon sequencing projects are also available for mapping projects. A similar HTML report can be generated displaying all detected variants together with their annotation and information about the samples. Also, functions for visualization of variants can be applied to mapping projects in an analogue manner. For targeted sequencing approaches like capture array experiments, methods computing the percentage of on-target reads as well as the achieved coverage of the target region were implemented.
2.3 Detection of balanced structural variants
Balanced structural variants like translocations or inversions often occur in cancer genomes and may lead to disease-specific fusion genes. Such variants can be detected with non-paired reads if at least one read spans the breakpoint of the variant (Abel et al., 2010). These reads originate from two different locations on the reference genome (so-called ‘chimeric reads’) and are used by our pipeline to detect the breakpoints of structural variants.
The pipeline supports demultiplexing in cases where molecular bar codes were used. Linker sequences can be trimmed if appropriate. We used the Burrows–Wheeler Aligner's Smith–Waterman Alignment algorithm (Li and Durbin, 2010), but other implementations producing local aligments in SAM format (Li et al., 2009) can easily be integrated. After alignment, we apply five different filter steps to separate chimeric reads spanning breakpoints of structural variants from artificial chimeric reads that were generated during sample preparation. Chimeric reads passing the filtering steps are clustered based on the chromosomal positions of their breakpoints. Each obtained cluster of reads then represents a putative breakpoint. To our experience, clusters of three or more reads and, in particular, reads covering both strands of a breakpoint region can be verified in most cases and truly reflect molecular fusions. In contrast, remaining artificial chimeric reads form clusters of size one. Detected clusters can be visualized by our package as shown in Figure 1B and C and Supplementary Figure S4. Our pipeline was evaluated in detail using a set of 21 leukemia samples (Grossmann et al., 2011b) and is further described in the Supplemental Material.
3 CONCLUSION
The R453Plus1Toolbox provides an interface to access 454 Sequencing data processed with Roche GS FLX Software from within R and offers many tools for quality reports, annotation and advanced analyses. Users can add customized methods using the R/Bioconductor infrastructure. Hence, the R453Plus1Toolbox is useful for custom analyses of 454 Sequencing data and may further support a broad application of amplicon deep sequencing in a diagnostic laboratory, in particular, for the analyses of tumor specimens.
Funding: Jose Carreras Foundation; European Leukemia Network of Excellence; COST Action BM0801 (EuGESMA).
Conflict of Interest: T.H. declares part ownership of the MLL Munich Leukemia Laboratory GmbH. A.K. and V.G. are employed by the MLL Munich Leukemia Laboratory GmbH.
REFERENCES
Author notes
Associate Editor: Joaquin Dopazo

