


Abstract
Motivation: In genome-wide analyses, the relative age of gene duplications is often estimated by measuring the rate of synonymous substitutions (dS) between paralogous sequences. On the other hand, recent studies have shown the feasibility of inferring, at genomic scales, the relative age of duplication events from the topology of gene family trees. This represents a promising alternative for large surveys requiring an automatic methodology to establish a timeline of duplication events and that are usually limited to the use of dS, which presents known limitations such as a fast saturation of the signal. However, both measures have never been compared in a common framework.
Results: Topology-based placement of duplications on a relative time scale corresponding to periods between speciation events were found to be highly consistent, providing the same placement for 67–84% of a reliable set of gene pairs duplicated in a single event. For recent evolutionary periods, dS and topological measures showed a strong correlation. We conclude that the topology-based approach is more appropriate for assigning duplications to temporal scales when analyses need to include ancient events, and that the study of recent duplications may benefit from a combination of dS and topology information.
Contact: [email protected]
Supplementary information: Supplementary data are available at Bioinformatics online.
1 INTRODUCTION
The level of sequence divergence between two related protein-coding genes can be expressed as the corrected number of residue substitutions occurring at the level of their DNA sequences. These substitutions can be classified as non-synonymous or synonymous depending on whether the nucleotide change results in a amino acid substitution in the encoded protein. Since synonymous substitutions are considered relatively free of selective pressures, at least at the protein level, these are often assumed to accumulate with time in a linear fashion that depends on the species generation time and mutation rates. Accordingly, the rate of synonymous substitutions between two sequences (dS) is extensively used as a proxy for their relative divergence time.
In the particular case of genes that diverged through duplication (paralogs), dS is often used as an estimator for the relative age of the duplication event (i.e. to ascertain which duplications are more recent or ancient with respect to the others, without necessarily assigning a specific date for the duplication). Many recent studies have used this methodology to address the evolution of duplicate genes at a genomic scale (Chung et al., 2006; Gu et al., 2002; Li et al., 2005; Liao and Zhang, 2006; Makova and Li, 2003). However, in such studies, the central assumption that dS increments linearly with time in the ranges considered is never tested, possibly due to a lack of appropriate benchmarks. Most importantly, a significant number of the detected duplications are discarded due to saturated dS values, usually applying a threshold that is set around dS > 1.5. It must be noted that all these studies were well aware of the effects of dS saturation, and therefore this measure was applied within appropriate limits. However, the implications that the possible sampling effect may have in the generality of their conclusions are usually not discussed. The effect of dS saturation has been described earlier (Gojobori, 1983) and constitutes one of the main known limitations of this methodology. Additionally, other necessary assumptions, such as the existence of a molecular clock or the absence of selection at synonymous sites, have been shown to be often violated (Gao and Innan, 2004; Resch et al., 2007). In the light of such caveats, alternative methods, such as assigning duplication events to a relative temporal scale based on the topology of phylogenetic trees, may prove more adequate. Here, we will refer to this methodology as phylogeny-based relative dating.
Phylogeny-based relative dating uses the species relationships determined by the gene tree topology to locate speciation and duplication events. This can be done by using a more or less sophisticated algorithm to reconcile the gene tree with a known species tree (see, for instance, Akerborg et al., 2009; Chen et al., 2000; Storm and Sonnhammer, 2002) or, alternatively, by simply detecting overlaps in the species content between the daughter branches of a given tree node (Huerta-Cepas et al., 2007; Vilella et al., 2009). In either approach, the relative age of each duplication is subsequently inferred according to the species found in the post-duplication branches of the tree. This is, considering that a duplication event should have preceded all speciations found in more recent branches, such event is assumed to have occurred prior to the most ancient of the subsequent speciation events.
In contrast to dS, phylogeny-based relative dating does not provide a continuous scale of time but it only assigns duplications to discrete categories. Such categories will depend on the number of lineages included in the gene phylogeny and will define the precision of the relative time estimates. Thus, for most of the cases, and especially when taxonomic sampling is sparse, the level of resolution of dS is expected to be much higher. Moreover, the categories established by phylogeny-based relative dating correspond to intervals between speciation events for which the temporal order is known but for which the absolute dates are often not confidently established. Thus, unless the specific date (i.e. how many million years ago) of the speciation events is known, phylogeny-based relative dating will provide us with a relative temporal order of the speciation events (a chronology) rather than a calibrated timescale. This is similar to dS-based approaches for relative dating in genome-wide analyses, where specific substitution rates are usually not calibrated.
One of the main advantages of phylogeny-based relative dating is that the level of resolution obtained is that of the underlying gene tree. Thus, since the evolutionary analysis takes into account the information contained in a multiple sequence alignment rather than just the two paralogs, it is expected to be less prone to saturation than pair-wise based measures of dS. Moreover, phylogenetic reconstruction can use amino acid sequences, which are less prone to saturation, to reconstruct ancient events. Although for many studies the estimation of absolute dates is necessary or desirable, many other questions can be addressed with relative temporal scales (see, for instance Chung et al., 2006; Gu et al., 2002; Liao and Zhang, 2006; Makova and Li, 2003). Note that, besides the need for reliable calibrating points, the computation of absolute dates is usually associated with large computational times. For instance, performing an absolute dating with BEAST (Drummond and Rambaut, 2007) on a precomputed phylogeny of 100 sequences needs the order of hours on a single processor, as compared to seconds of a relative topological dating using ETE (Huerta-Cepas et al., 2010).
Considering that the use of relative time scales is the norm in many large-scale genomic analyses, we will focus here on the comparison of relative age estimation. However, we want to stress the importance of properly calibrating mutation rates and speciation nodes if the aim is to provide absolute dates (or date intervals) with either dS or phylogeny-based methods.
In summary, dS-based and phylogeny-based relative dating provide two alternative measures of relative divergence time between duplicates, which have so far never been compared within a common framework.
To gain insight into the different properties of dS and phylogeny-based relative dating, we compare here both alternatives using the complete set of duplications detected in several eukaryotic genomes, including human, mouse, pufferfish and yeast. Our results show a large degree of dS saturation in genome-wide analyses, which results in a bias toward recent duplications when duplicates with dS values over a given threshold are discarded from the analysis. This confirms and extends previous findings from analyses of reduced sets of orthologous gene pairs in mammals (Wolfe et al., 1989). Moreover, we show that the phylogeny-based approach is able to detect very ancient duplications, while within non-saturated ranges of dS, both approaches correlate significantly. Finally, using a reliable set of paralogous gene pairs duplicated in a single event, we show that phylogeny-based relative dating is highly consistent, assigning most pairs of paralogs emerged from the same segmental duplication to the same relative evolutionary period.
2 METHODS
2.1 Phylogenetic data
We used two independent sources of phylogenomic data: phylomeDB 3.0 (Huerta-Cepas et al., 2008) and Ensembl Compara v57 (Vilella et al., 2009). In the case of phylomeDB, we used the human (Huerta-Cepas et al., 2007) and yeast (T21) (Marcet-Houben and Gabaldón, 2009) phylomes, considering only Maximum Likelihood trees reconstructed by the best fitting model (mtREV, JTT, WAG, Blosum62 and VT models tested). PhylomeDB trees are based on protein sequence alignments. Human, mouse and pufferfish paralogs were also inferred from ensembl compara trees, which were reconstructed using TreeBest and the WAG model (Vilella et al., 2009). Ensembl compara trees did not provide branch-specific support values. Branch support in PhylomeDB trees, when indicated, correspond to the approximate likelihood ratio tests (aLRT, Minimum of SH-like and chi-square-based option) as implemented in PhyML (aLRT version) (Anisimova and Gascuel, 2006; Guindon and Gascuel, 2003).
2.2 Detection of paralogous adjacent pairs
Gene coordinates were obtained from Ensembl v57. Pseudogenes and non-protein coding genes were removed from the analysis. We considered two genes to be adjacent if they were in the same chromosome and separated by a given number of genes (referred to as the window size threshold). Two pairs of adjacent genes were considered to form a paralogous adjacent pair (PAP), if adjacent genes in one pair were not homologous to each other but both have a paralog in the second pair of adjacent genes. We used several window size thresholds to calculate PAPs: 0, 5, 10 and 20. Meaning that 0, 5, 10 or 20 genes were allowed to exist between the two adjacent genes.
2.3 Detecting duplication events and providing a relative dating
Relative topological ages were estimated by analyzing phylogenetic trees and detecting the most recent common ancestor of the sequences involved in each duplication event. For this, we scanned all gene phylogenies using a simple species overlap approach to detect duplication events. Thus, any tree node whose child branches overlap in at least one species was considered a duplication. Next, the species involved in each duplication were mapped to the NCBI taxonomy tree (http://www.ncbi.nlm.nih.gov/Taxonomy/) to determine the first common ancestor group, thus obtaining a relative date for each event. A duplication mapped to a given taxonomic group is interpreted as an event occurring, at least, before the radiation of such group of species.
The ETE toolkit (Huerta-Cepas et al., 2010), a Python programming library to manipulate and analyze trees, was used to perform all tree- related operations. Species that overlap between branches, paralogy predictions and node labeling were performed as implemented in the ETE's built-in orthology and paralogy methods (default parameters). The species tree used as a reference for relative dating was assembled according to the NCBI taxonomy database. ETE was used to convert NCBI taxonomy information into a hierarchical tree as well as to assign relative age labels to each duplication node in trees.
2.4 dS calculation
dS ratios between human duplicate pairs were computed using three alternative methods, including the codeml (ML; Goldman and Yang, 1994), Nei-Gojobori (NG; Nei and Gojobori, 1986) and Yang-Nielsen (YN; Yang and Nielsen, 2000), as implemented in the PAML program (Yang, 1997). The yn00 program was used for NG and YN methods, whereas codeml (seqtype = codons, CodonFreq = F3X4, runmode = automatic) was used for ML estimations. When a duplication node involved more than two human paralogs (one-to-many or many-to-many paralogy relationships), we computed only the dS between the two most similar paralogs emerging from that duplication. This reflects best the situation in other studies where duplications are detected as blast hits in the genome.
3 RESULTS
3.1 Saturation in dS estimates severely limits the scope of genome-wide studies
To evaluate the effect of dS saturation at genome-wide scale, we computed this value for all pairs of duplicated genes detected in several eukaryotic genomes. For this, we scanned the complete dataset of phylogenies provided for human and yeast genomes available in phylomeDB (Huerta-Cepas et al., 2007, 2008; Marcet-Houben and Gabaldón, 2009) to detect duplications involving pairs of human and yeast genes, respectively. In addition, we scanned all family trees available at EnsemblCompara (Vilella et al., 2009), to detect duplications involving pairs of human, mouse and pufferfish genes. Finally, we calculated the rate of synonymous substitutions between all the resulting paralogs pairs (see Section 2). In order to make this analysis comparable with most previous works, we used three different methods to calculate substitution rates, namely YN (Yang and Nielsen, 2000), NG (Nei and Gojobori, 1986) and ML (Goldman and Yang, 1994). In brief, these three methods are able to estimate the number of synonymous and non-synonymous substitutions between two homologous sequences by using various approaches and differ, mainly, in the way in which they correct for the effect of multiple substitutions occurring at the same site. ML is considered the most accurate approach (Merchant et al., 2007), while YN is probably the most extended and has been shown to be superior in some scenarios (Yang and Nielsen, 2000). Nevertheless, all these methods share the problem of the saturation of the signal when very distant sequences are compared. Rate saturation is understood as the threshold above which multiple substitutions at the same position can obscure the reliability of dS or dN estimates. Although different rate saturation thresholds may be applied in different studies, we have found that thresholds set around dS > 1.5 are the most common in genome-wide studies of gene duplicates. Our results show a drastic effect of setting this threshold on any of the different methods considered (Table 1). Indeed, in the species examined, from 48% to 89% of the detected duplicated gene pairs have saturated rates (dS > 1.5) depending on the genome and dS calculation method. Consequently, dS-based relative dating would be only possible for a small subset of such paralogs. Very similar values were obtained when a very relaxed saturation cut-off (dS > 2.0) was applied (data not shown).
dS saturated paralogs pairs
| Dataset | # duplications | Saturated | Saturated | Saturated |
|---|---|---|---|---|
| pairs (ML), | pairs (YN), | pairs (NG), | ||
| (%) | (%) | (%) | ||
| Yeast (phylomeDB) | 2059 | 83.92 | 80.69 | 80.00 |
| Mouse (Ensembl) | 12518 | 69.93 | 64.32 | 55.46 |
| Pufferfish (Ensembl) | 11399 | 89.03 | 86.88 | 57.14 |
| Human (PhylomeDB) | 13379 | 75.42 | 70.54 | 49.89 |
| Human (Ensembl) | 11653 | 73.31 | 68.37 | 48.82 |
3.2 dS-based versus phylogeny-based relative dating
Recent studies have shown the feasibility of applying high-quality phylogenetic reconstruction at genomic scale. As a consequence, several public repositories [i.e. PhylomeDB (Huerta-Cepas et al., 2008) or Ensembl (Vilella et al., 2009)] do exist that provide genome-wide collections of pre-calculated trees involving many model species. Besides their obvious usefulness, such trees can be used to quickly obtain a chronology of all duplication events occurring in a given genome, thus providing an independent alternative to the use of dS for relative dating. In this respect, a common and affordable strategy consists of searching for all duplication nodes in a given set of trees and assign them to the oldest taxonomic group represented in each node's daughter partitions. This, in turn, assumes that duplications occurred, at least, before all speciation events they precede. In our analyses, we used a simple species overlap strategy to detect duplication events and the NCBI taxonomy tree to define different relative age categories (see Section 2 for details).
To compare this strategy with that of dS, we analyzed all the phylogenetic trees from which the previously used duplications were detected. This provided us with alternative relative age estimates, completely independent of dS, for all paralogs considered.
Interestingly, topological measures were able to consistently track very ancient duplications. Indeed, in most cases, the relative evolutionary period provided by the topological approach was consistent with the most parsimonius explanation of the distribution and number of gene family members across the genomes studied (data not shown). Several examples are shown in the trees in Figures 1 and 3B, which include two ancient duplications (vertebrates and mammals, respectively). The ability of phylogeny-based relative dating to consistently track ancient duplications is also supported by the fact that a peak of duplications is detected at the base of vertebrates, as expected from the whole-genome duplication occurred in this lineage. Moreover, the sets of duplicated genes are enriched in functions related to the evolutionary innovations at the periods in which they are dated (Huerta-Cepas et al., 2007).
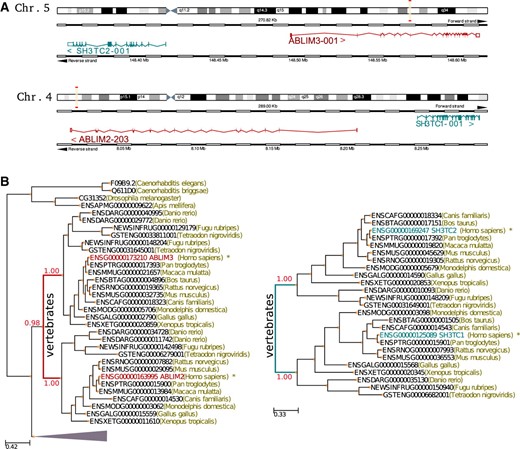
Example of a PAP. (A) Graphical representation of a PAP involving the two pairs of paralogous genes ABLIM2/ABLIM3 and SH2TC3/SH2TC2. Chromosome schemes were taken from the Ensembl genome browser (Hubbard et al., 2009). Gene pairs displayed in each chromosome are not homologous and the duplicated pairs have conserved the adjacency and the relative strand position. (B) Phylogenetic trees of the genes involved in the segmental duplication. Duplication events creating the pairs ABLIM2/ABLIM3 and SH2TC3/SH2TC2 are marked in the trees with red and green colors, respectively. Note that relative dating based on phylogenetic trees detects, in both cases, a duplication preceding the radiation of vertebrates, suggesting that they got duplicated at the same relative time.
The comparison of both measures (Fig. 2) shows that only recent evolutionary periods are not significantly affected by the saturation of dS values. This corresponds to duplications that occurred during the radiation of placental mammals in the case of human and mouse, after the separation of Saccharomyces krudiazevi in the case of yeast, and after the radiation of puffers in the case of the pufferfish. We believe that these periods set the limits beyond which the use of dS-based dating is not appropriate. Furthermore, we observed a large overlap among the distribution of dS values of genes topologically mapped to different evolutionary periods (Fig. 2). As expected, this effect is more pronounced in the evolutionary periods that are more affected by dS saturation. Within the non-saturated range of dS values, both strategies correlate significantly (R = 0.76; R = 0.77; R = 0.84; R = 0.64 and R = 0.79 for human ensembl, human PhylomeDB, mouse ensembl, pufferfish ensembl and yeast PhylomeDB datasets, respectively). In all cases P < 1.0E-200, indicating that both measures provide relatively similar estimates. Some exceptions to this correlation were found in ensembl trees at nodes where the presence of low-coverage genomes may have misled phylogenetic analyses (Milinkovitch et al., 2010). This suggests that, within non-saturated ranges, and in the presence of low-coverage genomes, dS estimates present an advantage over phylogeny-based relative dating. However, even within non-saturated ranges of dS, and using PhylomeDB trees that contain only high-coverage genomes, we could find many instances in which dS dating and phylogeny-based relative dating produced very different results. These differences were maintained even when highly supported duplication events [approximate Likelihood Ratio Test (aLRT) > 0.85 in all three branches associated to the duplication node] were used (see Supplementary Fig. S2). Several compelling examples are shown in Figure 3.
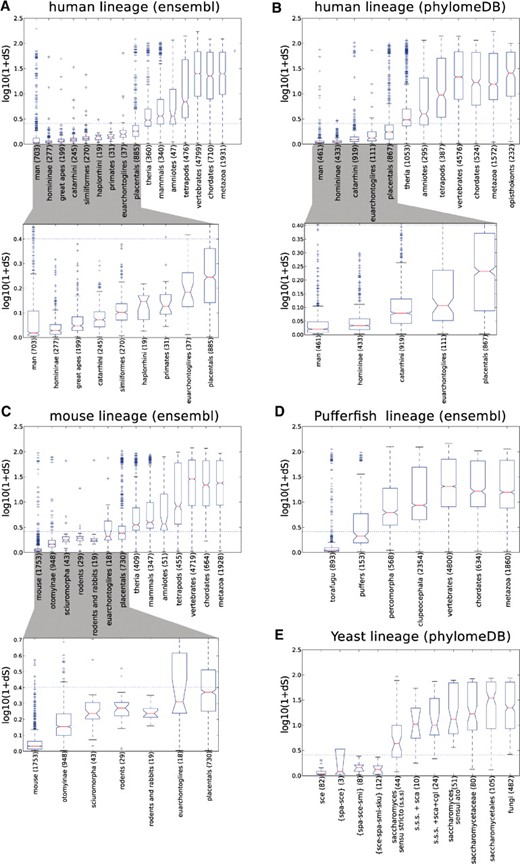
A comparison between dS estimates and phylogeny-based relative dating in several independent sources of phylogenetic trees. Boxplots represent the distribution of dS values of paralogs assigned to different phylogenetic categories. dS estimates correspond to the Maximum Likelihood method as implemented in codeml (see Section 2). Other methods (NG, YN) were evaluated, obtaining very similar results (data not shown). Horizontal dashed lines indicate the dS saturation threshold (dS = 1.5). X-axis indicates the granularity of the phylogenetic categories. Each panel evaluates a different seed species or tree source: (A) Human paralogs from ensembl compara trees; (B) Human paralogs from phylomeDB trees; (C) Mouse paralogs from ensembl compara trees; (D) Pufferfish from ensembl compara trees; and (E) Yeast from phylomeDB trees.
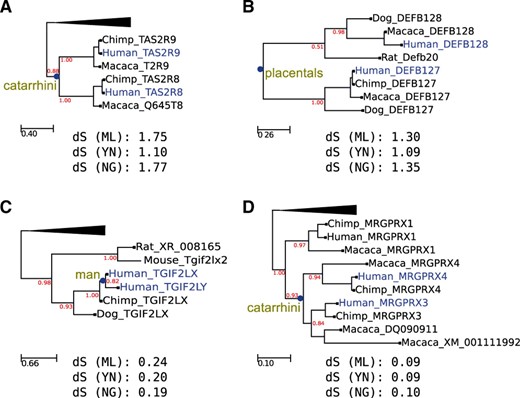
Two possible cases of dS-based dating misestimations. Duplication nodes and paralogous sequences used in the analysis are marked in blue. The estimated topological relative age is shown at the base of duplication nodes. Branch support values, based on aLRTs, are indicated in red. dS estimation by different methods are shown below each tree (ML = Maximum Likelihood, YN = Yang and Nielsen, NG = Nei and Gojorobi). (A) Phylogenetic relationship between two primate-specific taste receptors, TAS2R9 and TAS2R8. As shown in the tree, a specific duplication affecting only the primate lineage is detected with high support by the relative topological dating approach. Similarly, the duplication leading to the Beta Defensin precursors DEFB127 and DEFB128 (B) is dated to mammals by the same method. Surprisingly, dS estimation for primate-specific TAS2R9/8 paralogs is higher than that of mammalian-specific DEFB127/128 paralogs. Similarly, the duplication of the homeobox proteins TGIF2LX and TGIF2LY (C) are dated by a topological approach in the human lineage. However, their dS rate is much greater than that of the pair MRGPRX3/MRGPRX4 (D), which is a highly supported primate-specific duplication. It must be noted that the phylogenetic distribution of the relevant paralogs in all these cases would support the given relative topological dating. All duplication events are supported by Maximum Likelihood analyses as implemented in the PhylomeDB phylogenetic pipeline and by Ensembl paralogy predictions. In the case of the human- specific duplication in tree C, further references supporting a human-specific duplication can be found in Blanco-Arias et al. (2002) and Skaletsky et al. (2003).
3.3 Paralogous adjacent pairs suggest high accuracy for phylogeny-based relative dating
A possible criticism of the above-mentioned comparison is that the large level of overlap found between dS estimates of duplications with the same phylogeny-based relative dating could result from the lack of accuracy of the latter method. Although phylogeny-based relative dating is increasingly being used, its reliability has so far never been evaluated, probably due to the lack of available gold standards with which to compare the relative age estimates for duplicated genes. In our search for possible benchmark datasets, we identified segmental duplications as a reliable source for pairs of duplications that should be dated to the same event. Segmental duplications consist of the duplication of relatively long genomic regions that may contain more than one gene. When this occurs, the resulting set of paralogous chromosome regions (paralogons) will start diverging at the same time. We reasoned that such a set of paralogous pairs, coming from the same duplication event, represented an ideal golden set with which to benchmark methods for dating gene duplications. Indeed, using such strategy we circumvent the problem of establishing a true age for the duplications, since we just need to look for coherence in the relative age estimations of genes in a paralogon. Thus, using this benchmark, consistency between independent relative age estimates of coupled paralogous pairs can be used to assess the performance of different methods.
Detecting reliable cases of paralogous pairs emerged from the same segmental duplication largely depends on the incidence of processes such as recombination and genome re-arrangements. Predictions of paralogons in the genomes of human and other species have been reported (Ding et al., 2008; McLysaght et al., 2002). However, a manual inspection of some of these paralogons revealed that they were affected by large internal insertions, deletions and genomic re-arrangements (data not shown), thus making it difficult to assess whether all duplicated genes in a predicted paralogon were resulting from the same duplication event. In order to elaborate a high confidence set of paralogous pairs originated by the same duplication, we used very stringent thresholds for the detection of gene order conservation. More specifically, we searched for pairs of contiguous, non-homologous genes whose respective paralogs can also be found adjacent in the same or a different chromosome (Fig. 1). We refer to these cases as PAPs. The straightforward interpretation of a PAP is that a single duplication involved both genes in the pair. The alternative scenario, implying that this structure results from independent duplication events, is very unlikely, and therefore we used PAP as a golden set for pairs emerged in a single event. We scanned the human genome and found 326 high-confidence cases of PAPs (Supplementary Material).
Using the same phylogeny-based relative dating strategy described in the previous sections, we dated each of the two paralogous gene pairs found in every PAP. In 67% of the cases, both paralogous gene pairs within the same PAP were correctly mapped to the same evolutionary period. This value rose to 85% (Fig. 4) when we used a stringent threshold for the phylogenetic support for all the nodes defining the duplication (window threshold = 0, aLRT branch support ≥0.90). However, setting this threshold reduced the benchmark dataset to only 29 PAP cases. That the accuracy of the phylogeny-based relative dating increases with the level of branch support threshold indicates that phylogenetic artifacts may be behind those cases in which the phylogeny-based relative dating fails to correctly detect concomitant duplications in PAPs. This re-assures us in the use of PAPs as a high-confidence dataset for paralogous pairs emerged from a single duplication event. Furthermore, we explored the effect of reducing the adjacency threshold (by allowing more genes between syntenic genes in a PAP) in the accuracy values of the phylogeny-based relative dating (Fig. 4). Note that a drop in consistency scores is observed when the adjacency threshold is relaxed, which is probably related to the existence of genomic re-arrangements that place duplicates of different age close in the genome. This supports the idea of using a strict adjacency threshold in our benchmark.
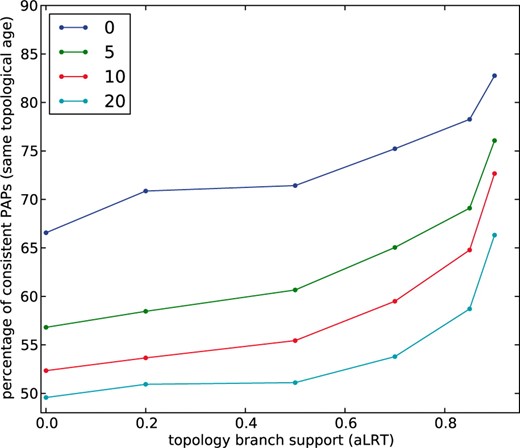
Accuracy of phylogeny-based topological dating of human duplicates. Each line represents the use of different adjacency thresholds (number of genes allowed between the syntenic pair of paralogs) to detect PAP cases. Y-axis indicates the percentage of PAP cases for which topological dating was consistent, that is, cases in which paralogs within a same PAP were mapped to the same evolutionary period. X-axis represent different branch support thresholds (aLRT support values) that is used to detect duplication events in phylogenetic trees. The number of PAP cases at each window size and branch support value are as follows: window size 0: 326, 254, 168, 109, 46, 29; window size 5: 1542, 1170, 694, 412, 178, 117; window size 10: 2327, 1750, 965, 558, 230, 150; and window size 20: 3504, 2566, 1401, 792, 310, 193.
Finally, we used a dS-based relative dating approach to analyze all paralogous gene pairs included in the high-confidence set of PAPs. As expected, dS values were highly affected by saturation. From 42% (NG method) to 83% (ML) of the paralogous pairs did have saturated rates (dS > 1.5). Moreover, for the non-saturated pairs, a great dispersion in dS values was found. The average dS difference between the two paralogous gene pairs in a PAP ranged from 0.26 (NG) to 0.30 (ML), with standard deviation of 0.24 (NG) to 0.34 (ML). Thus, in this benchmark, dS values provided little information as to whether two paralogous gene pairs originated in the same duplication event.
4 DISCUSSION
Overall, our results show the strengths and caveats of using dS rates or phylogeny-based relative dating as a proxy for estimating relative divergence times in genome-wide studies. Saturation of dS rates is a well-known limitation and, accordingly, all studies use this measure within appropriate limits. However, the extent to which dS saturation is affecting genome-wide studies is generally not quantified.
Alternative strategies based on phylogeny-based relative dating such as the one proposed by us (Huerta-Cepas et al., 2007) have shown to be consistent and less prone to saturation, hence being ideal for assigning ancient duplications to relative temporal scales. The use of phylogenetic trees to detect duplication events and provide a relative age has the additional advantage of allowing a better resolution in the detection of paralogy relationships. For instance, phylogenetic trees can differentiate among one-to-one, one-to-many and many-to-many relationships, thus better accounting for the complexity of the evolution of large gene families. Moreover, phylogeny-based relative dating provides relative age estimates that can be readily associated with specific evolutionary periods. That is, they can be framed within the context of the speciation events observed in the tree. Implementations of this method in large-scale phylogenetic analysis tools such as ETE (Huerta-Cepas et al., 2010) or MANTiS (Tzika et al., 2008) will enable its wider use in genome-wide analyses aimed at addressing relevant questions such as the content of ancestral genomes or the discovery of functional trends in duplicated genes. It must be noted, however, that there is still room for improvement, since a correct topological mapping relies on the quality of the underlying phylogenetic tree, the absence of horizontal transfer events, the breadth and density of taxonomic sampling and our level of understanding of the phylogeny of the species involved (Hahn, 2007). In this context, as noted before (Milinkovitch et al., 2010) and confirmed here, the presence of low-coverage genomes may result in largely incorrect phylogeny-based relative datings at affected nodes. In such scenarios, dS relative dating would be more reliable, providing that the affected nodes fall within the non-saturated range.
5 CONCLUSION
Considering all this, the combination of both strategies may provide best results in the evolutionary analysis of gene duplication. For instance, the use of phylogeny-based relative dating can provide a reliable overview of the relative age of the duplications under study as well as establishing the limits of dS saturation. Subsequently, dS can be used to provide a more detailed view on the sequence divergence within the subset of most recent duplications. Being aware of the advantages and limitations of both methodologies, as well as combining them in a sensible manner, will increase our analytical potential and, most importantly, avoid possible misinterpretation of the data.
ACKNOWLEDGEMENT
The authors wish to thank Leonardo Arbiza for providing interesting comments to this work.
Funding:Spanish Ministry of Science and Innovation (GEN2006-27784E, BFU2009-09168) to T.G. in part.
Conflict of Interest: none declared.
REFERENCES
Author notes
Associate Editor: David Posada

