


Abstract
Summary: iBioSim is a tool that supports learning of genetic circuit models, efficient abstraction-based analysis of these models and the design of synthetic genetic circuits. iBioSim includes project management features and a graphical user interface that facilitate the development and maintenance of genetic circuit models as well as both experimental and simulation data records.
Availability: iBioSim is available for download for Windows, Linux, and MacOS at http://www.async.ece.utah.edu/iBioSim/
Contact: [email protected]
1 INTRODUCTION
Electronic design automation (EDA) tools have facilitated the design of ever more complex integrated circuits each year. To aid the design of synthetic genetic circuits (Elowitz and Leibler, 2000; Gardner et al., 2000; Nevozhay et al., 2009), the improvement of genetic design automation (GDA) is crucial. Existing GDA tools require biologists to design networks at the molecular level, which is roughly equivalent to designing electronic circuits at the layout level. These tools also perform analysis of genetic circuits at this very low level. A GDA tool that supports higher levels of abstraction like iBioSim is essential to design and analyze more complex genetic circuits. iBioSim has been developed for the analysis of biochemical reaction network models. Figure 1 shows how iBioSim can be used to analyze these networks. While the primary target of iBioSim is the analysis of genetic circuits, models representing metabolic networks, cell signaling pathways and other biological and chemical systems can also be analyzed. One of iBioSim's most distinguishing features is that it utilizes abstraction for both modeling and analysis of genetic circuits.
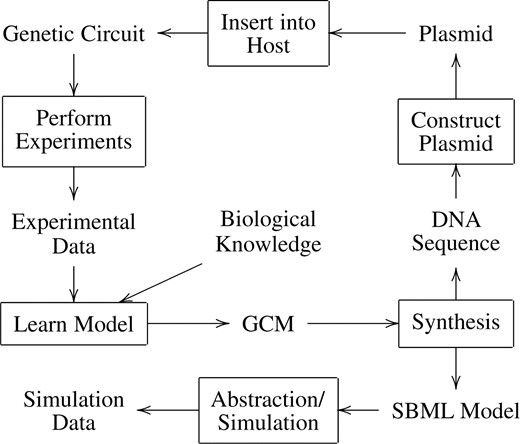
Some possible work flows of the iBioSim tool. A user can learn a genetic circuit model (GCM) for an existing genetic circuit from experimental data and other background biological knowledge. Alternatively, a user can design a new synthetic genetic circuit by creating a GCM from which a SBML model can be synthesized. The resulting model can then be abstracted and simulated. Once satisfied with the simulation results, the designer can synthesize a DNA sequence for the construction of a plasmid that can then be inserted into a host cell.
2 METHODS
iBioSim is a project-based tool. Each project in iBioSim is a collection of models, analysis views, learn views, and graphs. This section describes each of these in more detail.
2.1 Models
Models in iBioSim can be created using either a Systems Biology Markup Language (SBML) (Hucka et al., 2003) editor or a GCM editor (Nguyen, 2008). These models can then be analyzed in an analysis view discussed in Section 2.2.
The SBML editor allows the user to create or modify an SBML model of a biochemical reaction network by leveraging the libSBML library (Bornstein et al., 2008). The SBML editor and the iBioSim simulation engine support virtually all of SBML Level 2, Version 4, including compartments, species, reactions, parameters, function definitions, unit definitions, compartment types, species types, initial assignments, rules, constraints, and events. The editor also performs consistency checks when building or importing models to make sure that they are able to be simulated and abstracted.
The GCM editor improves the efficiency of model development for genetic circuits by supporting modeling at a higher level of abstraction than the molecular level supported by SBML. A GCM is a compact graphical representation of a genetic circuit which can later be synthesized into an SBML model. Each GCM is composed of promoters, species, influences, parameters, and components. Promoters are special species which represent the region of the DNA from which transcription is initiated. Species are the molecules (often proteins produced by genes). Influences describe the relationships between the GCM species. Parameters are a list of global parameters that are used when generating the SBML model for the GCM. The parameter list allows the user an easy way to change all the parameter values in a model. Finally, components add hierarchy to GCMs by allowing users to add other genetic circuits to the model and mapping that circuit's species to the species of the model. iBioSim can be automatically translated from GCMs to SBML models for analysis, and a GCM can be either manually created or automatically learned from time series data (TSD) as discussed in Section 2.3. Also, the user can visualize a GCM using GraphViz's Dotty tool (Gansner and North, 1999).
2.2 Analysis view
The analysis view is used to perform abstraction and simulation of biological networks. iBioSim comes with a number of simulation methods, ranging from continuous-deterministic simulation methods to discrete-stochastic simulation methods. These include ODE simulation, stochastic simulation, and Markov chain analysis. In order to perform efficient temporal behavior analysis, various model abstractions can also be automatically applied. These routines are implemented within the reb2sac tool described in Kuwahara et al. (2006b), Kuwahara (2007), and Kuwahara and Myers (2008).
Each analysis view is also equipped with a parameter editor. The parameter editor is similar in form to the SBML editor. It allows initial concentrations/amounts and parameters to be customized or swept. Initially, each element is set to the original value specified in the SBML or GCM associated with the analysis view. A value can be temporarily changed in the parameter editor for an individual analysis view. These values can also be swept over a range of values. This generates a set of simulations each taking a different parameter value. When sweeping values, the user provides a start value, a stop value, and a step amount like a loop in a computer programming language. The user also selects a level (1 or 2), where 1 indicates that a parameter's value should be changed in the outer loop, while 2 indicates that it should be changed in the inner loop. All parameters at Level 2 are swept from start to stop first, and then the parameters at Level 1 are stepped once. This process repeats until all parameters at Level 1 have stepped to their stop value.
2.3 Learn view
The learn view is used to discover genetic circuit connectivity from TSD. Here, the user can edit parameters for the learn tool. The result of the learn tool is a genetic circuit that is specified using the GCM format. As stated above, this circuit can then be viewed graphically using GraphViz's Dotty tool. The learning algorithm is implemented in the GeneNet tool described in Barker et al. (2006) and Barker (2007).
Time series data for learning genetic networks can be entered using the learn view. The learn view's data manager can also import the data for learning from other views, such as the analysis view. This data manager can import data from files in many formats, such as TSD format, comma separated value (CSV) format, or space delimited (DAT) format.
2.4 Graphs
Finally, iBioSim has a graphical editor for visualizing both time series and event probability analysis results. The TSD graph editor appears in both analysis and learn views. TSD graphs can also be created at the top level of the project to allow the user to integrate results from several analysis or learn views. In each TSD graph, one can graph the average, variance, standard deviation, or results from individual simulation runs. For a top-level graph, these datasets are organized hierarchically. Hierarchy is also introduced when simulations in an analysis view are given simulation IDs or after performing an analysis while sweeping parameter values. The probability graph editor appears in analysis views and can be created at the top level of the project. Probability graphs are used to display histograms for simulation termination conditions. This is used in conjunction with SBML constraints to determine the likelihood of various conditions.
3 DISCUSSION
iBioSim has been applied successfully to numerous projects including an analysis of the λ phage decision circuit (Kuwahara et al., 2006b) and the Escherichia coli Fim switch (Kuwahara et al., 2006a). It has also been applied to the design of a synthetic genetic Muller C-element, an asynchronous state-holding gate (Nguyen et al., 2007). In these and other efforts, the iBioSim tool with its support for automatic abstraction has been shown to greatly improve the productivity of researchers who are analyzing and designing genetic circuits. We are continually working to improve iBioSim's functionality and usability. Our next focus is to create a methodology for converting genetic circuits into logical models. These logical models can then be analyzed using Markov chain analysis to determine the probabilities of reaching certain states of a system without running numerous computationally expensive simulations.
Funding: National Science Foundation (Grants No. 0331270 and CCF07377655).
Conflict of Interest: none declared.
REFERENCES
Author notes
Associate Editor: Jonathan Wren

