


Abstract
The internal ribosome entry site (IRES) is a cis-regulatory element that can initiate translation in a cap-independent manner. It is often related to cellular processes and many diseases. Thus, identifying the IRES is important for understanding its mechanism and finding potential therapeutic strategies for relevant diseases since identifying IRES elements by experimental method is time-consuming and laborious. Many bioinformatics tools have been developed to predict IRES, but all these tools are based on structure similarity or machine learning algorithms. Here, we introduced a deep learning model named DeepIRES for precisely identifying IRES elements in messenger RNA (mRNA) sequences. DeepIRES is a hybrid model incorporating dilated 1D convolutional neural network blocks, bidirectional gated recurrent units, and self-attention module. Tenfold cross-validation results suggest that DeepIRES can capture deeper relationships between sequence features and prediction results than other baseline models. Further comparison on independent test sets illustrates that DeepIRES has superior and robust prediction capability than other existing methods. Moreover, DeepIRES achieves high accuracy in predicting experimental validated IRESs that are collected in recent studies. With the application of a deep learning interpretable analysis, we discover some potential consensus motifs that are related to IRES activities. In summary, DeepIRES is a reliable tool for IRES prediction and gives insights into the mechanism of IRES elements.
Introduction
Translation initiation in eukaryotic cells is mostly dependent on 5′ cap structure. However, when a cap-dependent translation initiation mechanism is inhibited, translation can be initiated in a cap-independent manner with the help of the internal ribosome entry site (IRES). The IRES was first discovered in the poliovirus Pelletier and Sonenberg [1]; then, cellular mRNAs were found to contain IRESs [2–4]. These elements were reported to play important roles in cellular stress [5, 6], cell cycle mitosis [7], and dysregulation of gene expression in cancer and other diseases [8, 9], and they are potential therapeutic targets for treating viral infections and diseases [10, 11]. Thus, identifying IRES elements is of vital importance for understanding IRES mechanism and exploring relevant treatment for diseases.
Experimental validation of IRESs is usually performed via synthetic bicistronic assays [12]: sequences that may contain IRES elements are inserted between two reporter genes, followed with a comparison of the reporter expression levels. Sequences with stronger cap-independent translation are considered to contain IRES elements. However, this assay would inevitably give false positive results for several reasons such as cryptic promoter and cryptic splicing sites. Extra control experiments are commonly needed to eliminate these artifacts [13–15]. Hence, identifying IRES elements by experimental method is time-consuming and laborious; a computational method is required to distinguish the IRES in a fast and resource- and cost-efficient way.
To date, there are several tools for IRES prediction. Viral IRES elements are found to have a more complex structure compared to cellular IRES elements [16]. IRSS [17] and VIPS [18] were developed to detect IRES elements in viral sequences. They make use of the RNALfold [19] program to predict an RNA secondary structure and then align the predicted structure with a known IRES structure to give a prediction score based on structure similarity. IRSS and VIPS are restricted to viral genome sequences, and their web servers are no longer available. IRESPred [20] utilized a support vector machine (SVM) model with 35 features to predict both viral and cellular IRESs. Twenty-seven out of 35 features are derived from the interaction probabilities of candidate sequence with different small-subunit ribosomal proteins; the remaining eight features are sequential and structural characteristics. The training data of IRESPred consist of positive samples obtained from the IRESite [21] database and negative samples randomly selected from the 5’UTR of housekeeping genes. The datasets are small, and negative samples are not experimentally validated. On the other hand, the max input of IRESPred is 10 sequences at once. It’s inconvenient when handling massive data.
In 2016, a high-throughput assay was conducted to screen for IRES elements in human and viral genome [22]. Thousands of novel IRESs were experimentally validated; it provided sufficient training data to implement machine learning methods to address the IRES prediction task. Gritsenkoet et al. [23] used these training data to build a regression model based on stochastic gradient-boosting decision tree. Global and positional k-mer features are used as input for modeling. They found several common k-mer sequences in both viral and human IRES. IRESfinder [24] selects human IRESs as training datasets; it is based on a logistic regression (LR) model with 19 framed features. IRESfinder is only applicable to human IRES prediction, and it did not perform well on independent testing datasets. The most recent model is IRESpy [25], which uses extreme gradient boosting (XGBoost) combining sequence and structural features to predict viral and cellular IRES. IRESpy reached 77.8% accuracy in independent testing datasets. However, IRESpy has poor prediction ability on independent testing datasets that we constructed. All these methods are based on structure similarity or the machine learning model; a deep learning–based method is needed to achieve better prediction performance.
Here, we proposed a deep learning model named DeepIRES for identifying IRES elements in RNA sequences. The main idea of the model is to extract features from input sequences by dilated convolution neural network (CNN), capture the long dependence of features by bidirectional gated recurrent unit (GRU), find important high-latent feature for classification by self-attention module, and eventually give a prediction score by dense layer. DeepIRES achieves best performance when comparing with other existing computational methods. This novel method provides a reliable tool for IRES prediction in practice and contributes to understanding of the mechanism of IRES elements.
Materials and methods
Data preparation
The training data are derived from a high-throughput bicistronic assay [22] that measured 55 000 designed sequences’ cap-independent translation activities. These sequences are composed of known IRES, fragments of human and viral genomes, and synthesized sequences. Since a good training set is essential to modeling, native sequences that are labeled with “Genome_Wide_Screen_Elements,” “CDS_screen,” “Human_5UTR_Screen,” “IRESite_blocks,” “Viral_5UTR_Screen,” “High_Priority_Genes_Blocks,” “High_Priority_Viruses_Blocks,” and “rRNA_Matching_5UTRs” are retained and all synthesized sequences are removed. In order to reduce false positives of IRES element detection through the bicistronic assay, two additional assays were designed to measure the promoter and splicing activities of designed sequences in this high-throughput experiment. Sequences with promoter activities >0.2 and splicing activities <−2.5 were removed. We further applied the CD-HIT-EST program [26] with a cutoff of 0.8 to filter out redundant sequences. After the screening process, 18 527 sequences were reserved. Among these data, IRES activities above 600 are defined as positive samples. The final dataset comprises 1917 positive samples and 16 610 negative samples. The ratio of IRES to nonIRES is ~1:9.
One-hot encoding is used to represent RNA sequences. Bases A, U, G, and C are transformed into [1,0,0,0], [0,1,0,0], [0,0,1,0], and [0,0,0,1] vectors, respectively. Each sequence was converted into an L × 4 matrix, where L is the length of the sequence. As the length of all sequences in the dataset is 174 nt, L was set to a fixed number, 174.
Constructing training and testing datasets
The dataset mentioned above was then randomly split into two parts: a training dataset (90%) for model construction and parameter optimization and a testing dataset (10%) for model performance validation. In the training dataset, 10-fold cross validation was used to assess the general performance of model. To confirm the generalization capability of trained model in new data, we additionally constructed an independent test set, which comprises 52 IRESs and 52 nonIRESs. Among them, 40 positive samples and 40 negative samples were obtained from the independent test set of IRESfinder [24], while the remaining ones were extracted from an early conducted experiment [27]. This dataset is noted as the main independent test set. Furthermore, we also chose the independent test sets in IRESfinder named core independent test set and 5’UTR independent test set to further compare DeepIRES with other models. Both contain 13 positive samples and 13 negative samples.
Model architecture
We developed a deep learning model integrated with the dilated CNN, bidirectional GRU, and self-attention module. The input of the model is an L × 4 matrix; then abstract features are extracted by dilated CNN. The output of convolution is fed into recurrent network to capture the context dependence, while the self-attention module focuses on more relevant features. Finally, a dense layer with a sigmoid function will give the prediction probability of IRES. The major workflow is shown in Fig. 1. More details about the model are represented below.
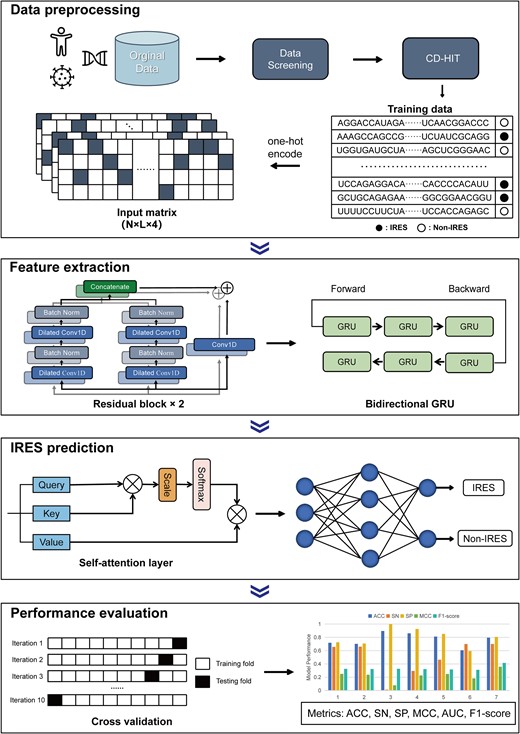
The overview of DeepIRES architecture. The original data are screened and redundancy is removed to build the training dataset. The input sequences are converted into input matrices using one-hot encoding, from which useful features are extracted by residual blocks and bidirectional GRU. Then, the self-attention layer is used to focus on the most crucial features, while a dense layer with sigmoid activation function is used to give the prediction result. Ten-fold validation is applied to assess the performance of the model on the training dataset.
Dilated convolution neural network
The CNN is widely used due to its ability to extract useful features from 1D sequence [28–30]. Dilated convolution [31] is a special form of standard convolution. It introduces a parameter, dilation rate, which is related to the number of kernel intervals. Dilated convolution can get a broader receptive field by setting a certain dilation rate. We set two residual blocks; each block consists of two 1D dilated convolutional layers with different convolutional kernel sizes. Every convolutional layer is followed by a batch normalization layer, a dropout layer, and a rectified linear unit (ReLU) activation function. The outputs of these two units are concatenated; meanwhile, skip connection is applied to avoid gradient vanishing and gradient exploding during training [32]. The dilation rate of convolutional layer was set to 1 in the first block and was set to 2 in the second block.
Bidirectional gated recurrent unit
The GRU [33] is a special type of recurrent neural network. The GRU is similar to long short-term memory (LSTM) [34]; they were both proposed to handle gradient problem in simple recurrent neural networks. The GRU is good at capturing long-term dependence in sequential input and with fewer parameters compared to LSTM. Accordingly, we chose GRU over LSTM to speed up the training process. A bidirectional form of GRU is used here to extract sequential feature in both forward and backward direction of sequence. Every GRU contains an update gate and a reset gate. The function of GRU can be expressed using the following formula:
where |${\mathrm{z}}_{\mathrm{t}}$|, |${\mathrm{r}}_{\mathrm{t}}$|, |$\overset{\sim}{{\mathrm{h}}_{\mathrm{t}}}$|, and |${\mathrm{h}}_{\mathrm{t}}$| refer to the update gate, the reset gate, the candidate hidden state, and the hidden state at time t, respectively; |${x}_t$| is the current input vector, and |${h}_{t-1}$| is the hidden state at time t-1, both of which are the input of GRU; W and U represent the weight matrices; and |$\mathrm{\sigma}$|, |$\tanh$|, and |$\odot$| denote the sigmoid function, the tanh function, and the Hadamard product, respectively.
Attention module
Attention mechanism is a well-used part in deep neural network. It has been largely applied in natural language processing [35, 36]. Attention mechanism can assign different attention weight to the input feature. Thus, a crucial feature can be obtained for classifying IRES through the attention module, which can be described as the following equations:
where |${h}_i$| represents the output of bidirectional GRU at the time i; W and b are the weight and the bias parameter, respectively; |${y}_s$| is a random initialization vector, L equals the length of input, and |${c}_i$| denotes the output of attention layer. W, b, and |${y}_s$| are learnable variables. |${a}_i$| is the attention weight obtained by calculating the relative importance of |${h}_i$|.
Hyperparameter optimization
In the deep learning model, suitable hyperparameters are necessary for building an ideal and robust model. As for our model, many hyperparameters need to be tuned such as the kernel size of convolution, the number of neurons in Bi-GRU, learning rate, and batch size. Since the search space of hyperparameter is too large, the Bayesian optimization algorithm [37] is used to obtain desirable hyperparameter combination. Bayesian optimization will construct a posterior distribution that describes the hyperparameter optimization function. As the optimization process iterates, the posterior distribution improves, and better estimation of hyperparameter is acquired. Bayesian optimization possess a more efficient search of hyperparameter compared with grid search. The learning rate decay strategy [38] is used during training to avoid overfitting. The learning rate will reduce when a certain evaluation metric no longer improves on the validation set. The detailed hyperparameter settings are recorded in Table S1.
Model interpretation
Deep learning models are more like black boxes. It is often difficult to explain the relationship between input and predicted output. Model interpretation is important for understanding the underlying mechanism of IRES identification. Class Activation Mapping [39] (CAM) is a backpropagation-based deconvolutional method for interpreting CNN-based networks. Gradient-weighted Class Activation Mapping [40] (Grad-CAM) is the improved version of CAM, which highlights the important part of input by computing the gradient information. We used Grad-CAM to compute the attribution values for each position of the input. Higher attribution values mean more contribution to the output. The attribution values of true positive samples with top 10% prediction scores were calculated. For each sample, a sliding window with 10 nt size was employed to sum the attribution values of 10-mer motifs. The 10-mer motif with the highest value in each sample was reserved. Following a previous study [41], these motifs were embedded using the UMAP algorithm [42], and the embedded motifs were clustered by DBSCAN algorithm [43]. Finally, motifs in each cluster were visualized by WebLogo tool [44].
Performance evaluation metrics
To evaluate the performance of models, several commonly used metrics are selected: Accuracy (ACC), Sensitivity (SN), Specificity (SP), Matthews correlation coefficient (MCC), Area Under the ROC Curve (AUC), and F1-score. When evaluating in a test set, an accuracy metric will be subject to imbalanced distribution. In this case, balanced accuracy (balanced ACC) can be used to assess the model performance. It is defined as the average of sensitivity and specificity. Mathematical equations are listed below:
where TP, TN, FP, and FN represent true positive, true negative, false positive, and false negative, respectively.
Results and discussion
Comparison with conventional machine learning models
Previous algorithms for identifying IRES elements are mostly based on machine learning models. Machine learning needs hand-crafted features that are derived from biological sequence. The most commonly used sequence descriptor is k-mer feature. We extracted k-mer features (k = 1, 2, 3,4) from RNA sequences to form a 340-dimensional input. Seven models including logistic regression, random forest (RF), SVM, LightGBM, and XGboost are trained in the same datasets. Ten-fold cross validation is adopted to assess the general capability of models. Considering the imbalance between positive samples and negative samples in training datasets, balanced ACC, MCC, F1-score, AUROC, and AUPRC metrics are selected to better compare models’ performance. The metrics are shown in Fig. 2 and Table S3. DeepIRES achieves best performance in 10-fold cross validation, with balanced ACC 0.763, AUROC 0.843, MCC 0.377, F1-score 0.430, and AUPR 0.546. All these performance values of our model are higher than other conventional machine learning models.
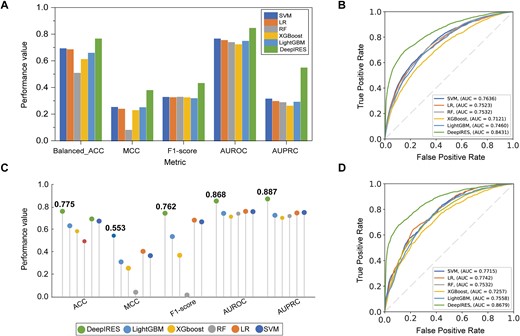
(A, B) Comparison results of DeepIRES and conventional machine learning models on the training dataset with 10-fold cross validation. (C, D) Comparison results of DeepIRES and conventional machine learning models on the test set.
Then, to further validate the performance of trained models, we compared DeepIRES with other models on testing data. We constructed a balanced test set by selecting all positive samples and randomly selecting the same number of negative samples. From Fig. 2C and Table S4, we can see that the performance of DeepIRES on test set is similar to the 10-fold result. It indicates that DeepIRES has good generalization capability. Furthermore, DeepIRES outperformed other conventional machine learning models on a balanced test set. In addition, the logistic regression model and SVM model showed good performance, but the RF model performed poorly on our test.
Training with viral and human data can improve generalization performance
The datasets we use contains both human and viral sequences. According to previous studies, human IRES and viral IRES may function in different mechanisms. Hence, we divided datasets into human datasets, which contained human sequences only, and viral datasets, which contained viral sequences only. Three models are trained based on human datasets, viral datasets, and entire datasets respectively, and then evaluated on testing datasets. The evaluation results are shown in Fig. 3. The model trained with entire datasets outperforms models trained with either human or viral datasets in almost all metrics. We can conclude that training with both viral datasets and human datasets can improve a model’s generalization performance.
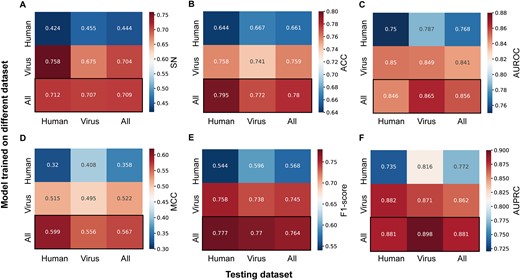
Heat map of models trained on different datasets and evaluated on testing datasets. Each model is evaluated on three different testing datasets. The performance is assessed using the following metrics: (A) sensitivity (SN), (B) accuracy (ACC), (C) area under the receiver operating characteristic curve (AUROC), (D) Matthews correlation coefficient (MCC), (E) F1-score, and (F) the area under the precision–recall curve (AUPRC).
It’s worth noting that the model trained with human datasets achieves best performance in viral testing datasets between three testing datasets and the model trained with viral datasets performs better on human testing datasets than with human datasets. We noticed that the length of sequences in our datasets is 174, and all IRES activities are measured in the same assay. Although viral IRES elements are reported to mediate cap-independent translation via their unique structural features, sequences in our datasets may be too short to form a functional RNA structure. Accordingly, we assume that viral IRES and human IRES both mainly function through sequence features, and these IRESs may share the same sequence pattern. In addition, the deep learning model can get better performance as the data increase. In summary, integrating human and virus IRES data for training can improve model performance.
Effect of different modules in our model
DeepIRES consists of multiple modules, including residual block, which uses dilated convolution to extract features, bidirectional GRU, attention layer, and dense layer. To investigate the effect of different modules in our model, we constructed some baseline deep learning models to compare their performance. The CNN represents simple convolution neural network, CNN + GRU represents the model that combines convolution neural network and gated recurrent unit, and CNN + GRU + ATT represents the model that combines CNN, GRU, and self-attention layer. The 10-fold cross validation results of these models are shown in Fig. 4 and Table S5. DeepIRES achieves the best performance among four models. Its Sn is 1.0%–23.8% higher, balanced ACC is 3.8%–9.6% higher, MCC is 0.03–0.12 higher, F1-score is 0.02–0.09 higher, and AUROC is 1.5%–11.1% higher than that of other deep learning models. The CNN model and CNN-GRU model have imbalanced performance with high specificity but low sensitivity. The CNN-GRU-ATT model has balanced and superior performance compared with CNN and CNN-GRU models. Based on the CNN-GRU-ATT model, the DeepIRES model replaces the conventional convolution with multikernel dilated convolution and adds residual connection operation. DeepIRES achieved better performance than the CNN-GRU-ATT model does.
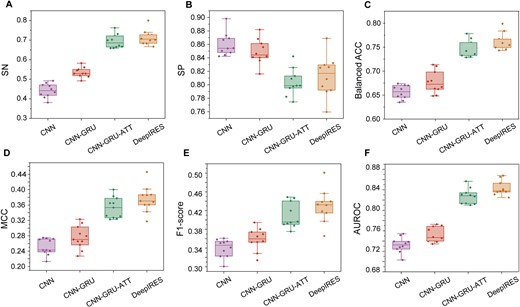
The performance comparison between DeepIRES and other deep learning models with different architecture. The metrics are measured with 10-fold cross validation: (A) sensitivity (SN), (B) specificity (SP), (C) balanced accuracy (balanced ACC), (D) Matthews correlation coefficient (MCC), (E) F1-score, and (F) area under the receiver operating characteristic curve (AUROC).
We also compared the generalization capability of these models on test sets. An imbalanced test set and a balanced test set were constructed to evaluate model performance. The metrics are obtained by averaging the results of 10 trained models generated in 10-fold cross-validation. All results are shown in Tables 1 and 2 and Figs S1 and S2. It can be seen that DeepIRES outperforms other models on both imbalanced and balanced test sets. As these modules accumulate, model performance improves. It indicates that the combination of different modules can strengthen a model’s prediction ability. We believe that our proposed model architecture can effectively extract crucial features from RNA sequences for identifying IRES elements.
Comparison of performance between DeepIRES and other deep learning models with different model architectures on balanced testing data.
| Model | Sn (%) | Sp (%) | ACC (%) | MCC | F1-score | AUROC |
|---|---|---|---|---|---|---|
| CNN | 44.23 | 84.13 | 64.18 | 0.3101 | 0.5519 | 0.7396 |
| CNN-GRU | 53.49 | 85.66 | 69.58 | 0.4137 | 0.6373 | 0.7763 |
| CNN-GRU-ATT | 71.64 | 82.75 | 77.20 | 0.5477 | 0.7584 | 0.8585 |
| DeepIRES | 72.12 | 82.81 | 77.46 | 0.5531 | 0.7618 | 0.8680 |
Comparison of performance between DeepIRES and other deep learning models with different model architectures on imbalanced testing data.
| Model | Sn (%) | Sp (%) | ACC (%) | MCC | F1-score | AUROC |
|---|---|---|---|---|---|---|
| CNN | 44.23 | 85.21 | 64.72 | 0.2331 | 0.3220 | 0.7496 |
| CNN-GRU | 53.49 | 84.12 | 68.80 | 0.2865 | 0.3651 | 0.7760 |
| CNN-GRU-ATT | 71.64 | 79.73 | 75.68 | 0.3572 | 0.4098 | 0.8470 |
| DeepIRES | 72.12 | 81.93 | 77.02 | 0.3865 | 0.4366 | 0.8582 |
Performance comparison with existing state-of-the-art methods
As mentioned before, there are several existing methods for predicting IRES elements. In this work, we compared the performance of our model with these models on independent test sets. Methods that are still available online are selected for comparison including IRESfinder and IRESpy. Since the input sequence length of our model is fixed to 174, the input sequences that are shorter than 174 nt will be padded to 174 nt. On the other hand, the input sequences that are longer than 174 nt will be scanned by a sliding window with a window size of 174 and a step size of 50 to find potential IRES elements within sequences.
The main independent test set we used is composed of 104 sequences with 52 positive samples and 52 negative samples. As illustrated in Fig. 5A and D, DeepIRES outperforms other two methods. Except for the specificity, which is lower than that of IRESpy, all other metrics of DeepIRES are optimal. Its Sn is 26.9%–42.3% higher, ACC is 6.7%–23.1% higher, MCC is 0.12–0.46 higher, F1-score is 0.13–0.32 higher, and AUROC is 12.5%–16.5% higher than that of other methods. There are two other small independent test sets named core independent test set and 5’UTR independent test set, which are used to further prove the generalization performance of DeepIRES. From Fig. 5B, C,E, and F, we can see that all metrics of DeepIRES are superior and the AUROC scores of DeepIRES are much higher than IRESfinder and IRESpy on both test sets. The metrics comparison detail can be seen in Table S6, S7, and S8. It’s worth mentioning that IRESpy achieved higher performance than IRESfinder on the main independent test set but was found to have poor prediction ability on these two test sets. All these results reinforce the superior prediction ability of our model on independent data.
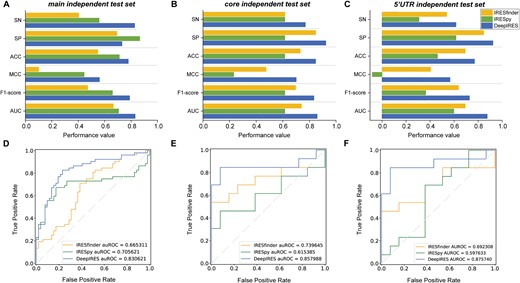
Comparison of DeepIRES with other IRES prediction methods on independent test sets. (A, D) The performance comparison of DeepIRES, IRESpy and IRESfinder on the main independent test set. (B, E) The performance comparison of DeepIRES, IRESpy, and IRESfinder on the core independent test set. (C, F) The performance comparison of DeepIRES, IRESpy, and IRESfinder on the 5’UTR independent test set.
Furthermore, we performed comparison on IRESs of other eukaryotes, such as Mus musculus, Drosophila melanogaster, and Rattus norvegicus. The results show that DeepIRES outperforms other methods, however, it's performance is worse than that on human IRESs (Result S1 and Table S9). In addtion, we also validated the capability of DeepIRES for identifying IRES in practice. We collected the newly found human IRESs that were experimentally validated and reported in literature over the past 5 years [45–62]. A total of 40 sequences with varying lengths were acquired, including both cellular and viral IRESs (Table S10). These sequences were predicted by DeepIRES, IRESpy, and IRESfinder to give a prediction score, respectively. The prediction scores are recorded in Table S2. DeepIRES identifies 35 out of 40 IRESs, whereas IRESpy and IRESfinder identifies only 17 and 16 out of 40. The comparisons of running time and memory usage are shown in Result S2. The above results prove that DeepIRES is capable of predicting IRES in real practice.
Visualization and interpretation of DeepIRES model
So far, we have emphasized the performance of DeepIRES in IRES prediction task. The interpretability of deep learning model is also of great importance for understanding how models predict results. In our case, interpretation of DeepIRES can give us insights of mechanisms underlying IRES elements recruiting the small ribosomal subunit and ribosomal architecture.
Firstly, we used t-SNE [63], a widely used dimensionality reduction algorithm, to convert our input feature and the output feature after self-attention layer into 2D vectors. Figure 6A and B represents the t-SNE result of input sequence features and the output feature learned by DeepIRES. It is hard to distinguish IRES and non-IRES from each other in original input. But from the feature extracted by DeepIRES, the overlap between IRES and non-IRES is significantly reduced. It suggests that critical features can be learned by DeepIRES for classifying IRES and non-IRES.
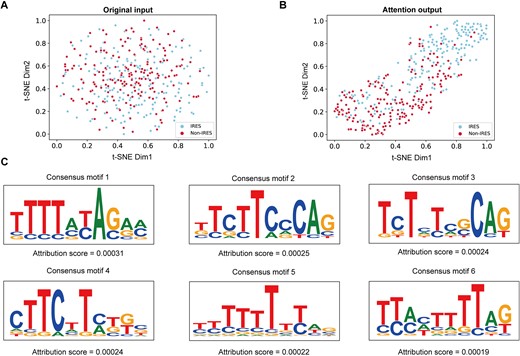
(A) Visualization of the t-SNE result of original model input. (B) Visualization of the t-SNE result of attention layer output. (C) Potential consensus motifs with high attribution scores.
Then, we try to explore which part of input sequences is essential for making correct classification decisions. We employed the Grad-CAM algorithm to find k-mer sequences with high attribution values for predicted output. These short sequences are potential consensus motifs contributing to IRES identification. Six consensus motifs with high average attribution values ranging from 0.00019 to 0.00031 are visualized in Fig. 6C, and other consensus motifs can be seen in Fig. S3. These motifs are characterized by ploy-U and CU-rich, which is consistent with previous research [23]. The ploy-U motif resembles the binding motif of heterogeneous nuclear ribonucleoprotein (hnRNP) C1/C2 RNA-binding proteins (RBPs) [64], which were reported as the ITAF of X-linked inhibitor of apoptosis (XIAP) IRES [65]. Then, the CU-rich motif resembles the binding motifs of the PCBP-1 [66], PCBP-2 [67], and PTB-1 [68] RBPs. PCBP proteins were reported as the ITAF of poliovirus 1 IRES [69] and c-myc IRES [70], and PTB-1 was shown to interact with many cellular and viral IRESs [7].
Conclusion
In this work, we proposed DeepIRES, a deep learning model for predicting the IRES element in linear RNA sequences. DeepIRES is constructed by integrating the dilated CNN, bidirectional GRU, and self-attention module. DeepIRES is trained with sequences derived from high-throughput bicistronic assay. Through comparison on independent test sets, DeepIRES outperformed other IRES prediction methods that are based on machine learning models. Machine learning models are dependent on the handcrafted features, while deep learning models can automatically extract useful features from input. We believe that our designed deep learning model is capable of learning high-level features and more complex relationships between sequence information and IRES activity, and the experimental results show that DeepIRES has better performance in identifying IRES. Meanwhile, we have explored the interpretation of DeepIRES, ploy-U, and CU-rich motifs are discovered in mRNA IRES sequence patterns.
Although DeepIRES achieves excellent performance in our experiment, there is still room for improvement. The training datasets are composed of 174 nt designed sequences. But in real practice, IRES elements can have varying lengths. More experimental validated IRESs and non-IRESs should be collected to build more reliable training datasets. Moreover, some IRESs mediate cap-independent translation by a certain secondary structure. Further research should extract some useful structural features for identify these IRES elements.
DeepIRES is the first deep learning–based method for predicting internal ribosome entry sites in mRNAs.
The model is a hybrid model that consists of a dilated convolution neural network, gated recurrent units, and self-attention module. It outperforms conventional machine learning–based methods and other state-of-the-art methods. It also reaches high accuracy in predicting IRES in real practice.
Through an interpretable analysis, we found some sequence patterns that contribute to identification of IRES.
Conflict of interest: None declared.
Funding
This work was supported by Key R&D projects of Jiangsu Province (No. BE2022843), the National Natural Science Foundation of China (No. 62273175), and the Fundamental Research Funds for the Central Universities (No. NS2023017).
Data and code availability
All datasets and codes are freely available at https://github.com/SongLab-at-NUAA/DeepIRES.
