


Abstract
Considering that cancer is resulting from the comutation of several essential genes of individual patients, researchers have begun to focus on identifying personalized edge-network biomarkers (PEBs) using personalized edge-network analysis for clinical practice. However, most of existing methods ignored the optimization of PEBs when multimodal biomarkers exist in multi-purpose early disease prediction (MPEDP). To solve this problem, this study proposes a novel model (MMPDENB-RBM) that combines personalized dynamic edge-network biomarkers (PDENB) theory, multimodal optimization strategy and latent space search scheme to identify biomarkers with different configurations of PDENB modules (i.e. to effectively identify multimodal PDENBs). The application to the three largest cancer omics datasets from The Cancer Genome Atlas database (i.e. breast invasive carcinoma, lung squamous cell carcinoma and lung adenocarcinoma) showed that the MMPDENB-RBM model could more effectively predict critical cancer state compared with other advanced methods. And, our model had better convergence, diversity and multimodal property as well as effective optimization ability compared with the other state-of-art methods. Particularly, multimodal PDENBs identified were more enriched with different functional biomarkers simultaneously, such as tissue-specific synthetic lethality edge-biomarkers including cancer driver genes and disease marker genes. Importantly, as our aim, these multimodal biomarkers can perform diverse biological and biomedical significances for drug target screen, survival risk assessment and novel biomedical sight as the expected multi-purpose of personalized early disease prediction. In summary, the present study provides multimodal property of PDENBs, especially the therapeutic biomarkers with more biological significances, which can help with MPEDP of individual cancer patients.
INTRODUCTION
In precision medicine, multi-purpose early disease prediction (MPEDP) refers to the identification of personalized biomarkers, which could not only detect early-warning signal of health deterioration or disease progression, but also assist of clinical applications with more practical purposes (i.e. identifying disease drivers, drug targets or survival risk factors), which help understand the individual-specific molecular mechanisms of patients [1–4]. Traditional approaches usually provide one biomarker (i.e. a group molecule module) for disease prediction. In clinical practice, multiple biomarkers with the same predictive ability but different molecules configuration should provide more relevant biological and biomedical functions (defined as multimodal biomarkers). The difference of multimodal biomarkers for MPEDP results in different biomarkers having their special biological functions, which helps the realization of MPEDP. Importantly, cancer has been identified to be a class of complex diseases resulting from the comutation of several essential genes. This concept has compelled researchers to focus on identifying edge-biomarkers, which are characterized by the complementary effect of two genes [5–7]. In particular, tapping the synthetic lethality of edge-biomarkers can help personalize cancer prediction as well as repurpose the potential of anti-cancer drugs for other diseases [8]. Therefore, it is crucial to identify personalized edge-biomarkers (PEBs) with multimodal property of MPEDP for promoting a systematic understanding of tumor heterogeneity in cancer precision medicine.
In the past decades, the development of edge-network analysis (ENA) [9] using the dynamic network biomarker (DNB) theory paved an alternative way for identifying edge-biomarkers in cancer prediction and treatment by examining omics data. In contrast to node-network analysis that mainly uses information of first-order statistics (e.g. ‘mean value’ for differential expression of genes or proteins), ENA uses second-order statistical data (e.g. ‘covariance’ for differential expression of genes or proteins) from the observed data. In an edge-network, a node is a gene pair and the link between them represents the relationship between two gene pairs (Figure 1(A)). Edge-biomarkers are a key subset of gene pairs derived from the edge-network that detect significant changes in second-order statistics. These biomarkers are considered more stable and reliable for the characterization of complex diseases than traditional node biomarkers [10]. A few studies on edge-networks have focused on predicting the synthetic lethality association of edge-biomarkers and the diagnosis of disease phenotypes, using supervised learning methods [11, 12], complex network methods [13, 14] and matrix factorization [15]. However, these methods failed to consider the sample-specific network data of individual patients and the dynamic temporal information of high-throughput omics data, which might fail to detect PEBs.
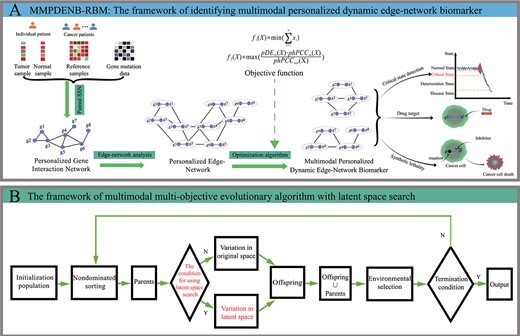
Demonstration and framework of MMPDENB-RBM model. (A) The biological explanation of multimodal PDENBs in the MMPDENB-RBM model. Firstly, we obtained gene expression data of paired samples (i.e. normal and tumor samples) of individual patients and reference samples as well as gene mutation data. Then, the paired-SSN method was used to construct a PGIN for each patient by integrating the aforementioned gene expression data. Subsequently, we used edge-network analysis to transform the node-network (PGIN) into an edge-network, which comprised rich dynamic and high-dimensional information of omics data, to characterize the development of cancer. Finally, we defined PDENB identification as LMOP and designed an MMEA based on latent space search to identify multimodal PDENBs. The multimodal PDENBs can be used to detect early-warning signals in the development of cancer as well as provide potential drug targets and synthetic lethality edge-biomarkers for cancer treatment, realizing multi-purpose early disease prediction. (B) The framework of MMEA with latent space search in MMPDENB-RBM model. Firstly, the PEN was divided into several subnetworks that formed the initial population via the population initialization strategy. Then, we calculated the objective function of the initial solution. Subsequently, these solutions were non-dominated sorted according to the value of the objective function, and the solutions with better quality were selected as parents. Then, each offspring was determined whether produced in original space or latent space according to decision conditions. The offspring and their parents were merged, and better solutions were retained by environmental selection operators. Finally, if iteration conditions were met, Pareto optimal solutions were outputted; otherwise, the search for better PDENBs was continued.
With the development of the single-sample network construction theory [6], a few single-sample edge-network methods combining DNB theory have been proposed to identify personalized dynamic edge-network biomarkers (PDENBs) for detecting early-warning signals of complex diseases. A few examples of such networks include the individual-specific edge-network analysis (iENA) [16] and EdgeBiomarker method [17]. However, existing studies have failed to consider the multiple equivalent PDENBs with similar predictive efficacy yet different functional roles. Such PDENBs, also known as multimodal PDENBs, can predict diseases as well as provide comprehensive biomarker information (e.g. driver genes or drug targets) for individual patients, which should provide efficient implications of MPEDP in different clinical aspects.
Indeed, PDENBs identification requires multimodal optimization, which is a common concern with high-throughput omics data in the field of biomedicine [18–21]. Such problems are known as large-scale multimodal optimization problems (LMOPs), and several studies have focused on finding multiple solutions with the same performance but different configurations (i.e. multimodal solutions). In our previous study, we proposed MMPDNB [22], a model for identifying multimodal personalized dynamic node-network biomarkers, which are modules with different configurations of node biomarkers. However, the scale of edge-networks is generally much larger than that of node-networks for complex biological networks, which implies that the current multimodal optimization algorithms, including MMPDNB, will be not easy to find the global optimum for large-scale edge-networks. Therefore, it is important to identify multimodal PDENBs using a suitable, large-scale, multimodal optimization algorithm that can promote early diagnosis and personalized treatment of complex diseases.
Owing to these practical requirements and methodology challenges, the present study first regard the identification problem of multiple equivalent PDENBs for MPEDP in individual patients as LMOP. Then, using machine learning (restricted Boltzmann machine, RBM) on our previous MMPDNB framework [22], we developed a novel multimodal optimization model (MMPDENB-RBM) to detect multimodal PDENBs in individual patients, by mapping the original, large-scale variable space to the latent, small-scale variable space. Of note, the present study is the first to extend the multimodal concept to PEBs and design an efficient algorithm to explore multimodal PDENBs for cancer patients using optimization with latent space search. The MMPDENB-RBM model in this study comprises two major components: (i) constructing a personalized edge-network (PEN) using paired-SSN and iENA to characterize the transition of disease states based on gene interaction data (Figure 1A); and (ii) designing the multi-objective optimization functions of PDENB identification and using specific, large-scale and multimodal multi-objective evolutionary algorithm (MMEA) on the PEN to identify multimodal PDENBs (Figure 1B). Unlike the traditional node/edge-biomarkers, multimodal PDENBs focus on how to directly use edge information to provide early-warning signals as well as highlight the diverse biological significances of edge markers in a multimodal manner.
Collectively, our study validated the effectiveness of the MMPDENB-RBM model and the biological significance of multimodal PDENBs using the largest datasets of three cancers from The Cancer Genome Atlas (TCGA): breast invasive carcinoma (BRCA), lung squamous cell carcinoma (LUSC) and lung adenocarcinoma (LUAD). Compared with other advanced methods, the MMPDENB-RBM model is more effective as it provides the highest early-warning signal score on the critical state during cancer development. This model was also validated for convergence, diversity, and multimodal property, which revealed a significant advantage of this model over other benchmarking LMOPs solvers. In addition, the PDENBs identified by MMPDENB-RBM cannot be substituted with traditional DNB methods, especially on the multimodal level. Finally, the important thing is that the multimodal PDENBs identified by MMPDENB-RBM can be used for indicating critical state as well as are implicated in several biological functions. On the one hand, the recognized PDENBs comprise significant synthetic lethality edge-biomarkers, cancer driver genes and disease marker genes. On the other hand, these PDENB genes mediate relevant biological functions in individual patients at the early stage of cancer, and provide drug targets or survival risk factors for clinical decision making.
Therefore, the MMPDENB-RBM model achieves improved efficacy in detecting the critical state of cancer with personalized early-warning signals in a multi-purpose manner, and supports as series of clinical applications including novel biomedical insight for the cancer tissue-specific biomarker identification, survival analysis of individual cancer patients and individual-specific drug targets discovery, which is an effective case of applying machine learning scheme to implement MPEDP.
MATERIAL AND METHODS
Constructing personalized gene interaction network based on paired-SSN
As paired-SSN can accurately characterize the transition between the normal and disease states, the current study constructed the personalized gene interaction network (PGIN) using paired-SSN [23] by integrating gene expression data of paired samples from individual patients, gene expression data of reference samples, and gene mutation data (Figure 1A). PGIN simultaneously provides data on the dynamic changes at the gene expression and mutation levels during cancer development. The personalized Pearson correlation coefficient (|$pPCC$|) between genes |$i$| and |$j$| can be calculated using the following formulas:
The difference in |$PCC$| (|$\varDelta PCC$|) of gene |$i$| and |$j$| in a single sample of individual patient |$k$| can be calculated using the following equations:
where |$i_m$| and |$j_m$| represent the expression of gene |$i$| and |$j$| in the sample |$m$|; |$\overline{i}$| and |$\overline{j}$| represent the mean values of the expression of gene |$i$| and |$j$| in all samples. |$PCC_{ij}^{n}$| is the |$PCC$| of gene |$i$| and |$j$| in |$n$| reference samples; |$PCC_{ij,k}^{n+1}$| is the |$PCC$| of gene |$i$| and |$j$| in the |$n+1$| reference samples, which comprise |$n$| reference samples and a sample from an individual patient |$k$|.
Then, if the co-expression relationship between two genes is significant (|$P<$| 0.05) in the tumor sample network and not significant (|$P>$| 0.05) in the normal sample network, or vice versa, the two genes are retained in the PGIN. Specifically, |$Z$|-scores can be calculated to obtain the |$P$|-values for each |$\varDelta PCC$| from the standard normal distribution of |$Z$|-score:
Finally, considering the heterogeneity of individual cancer patients, we calculated the |$pPCC$| of |$i$| and |$j$| genes by integrating gene mutations to the PGIN, as follows:
where |$T(i)$| and |$T(j)$| indicate a collection of tumor patients that contain mutated genes |$i$| and |$j$|, respectively. After the comutation values between all genes are arranged in descending order, |$D_{10}$| indicates that the boundary value of last 10%. If the comutation value between gene |$i$| and gene |$j$| is greater than the threshold |$D_{10}$|, the |$pPCC$| between them is reserved.
Constructing PEN of individual patients based on iENA
Unlike the node-network, edge-network can provide a more accurate description of the biological processes using second-order statistics (e.g. ‘covariance’ for differential expression among genes or proteins) on the observed data. According to iENA [16, 24], the high-order |$PCC$| (|$hPCC$|) between two gene pairs (i.e. |$<x_i,x_j>$|, |$<x_k,x_l>$|) in a normal sample is computed using the following formula:
where |$n$| corresponds to all normal samples, |$x_i$| corresponds to the expression of the gene |$i$| in a normal sample, |$\mu _i^n$| is the mean expression of |$i$| in all normal samples, and |$V^n (x_i)$| is the expression variance of |$i$| in all normal samples. Similarly, the |$hPCC$| between two gene pairs in a tumor sample |$hPCC^{\textrm{Tumor}}$| can be calculated. Then, the personalized |$hPCC$| (|$phPCC$|) between two gene pairs (i.e. |$<x_i,x_j>$|, |$<x_k,x_l>$|) of individual patients is computed as follows:
Collectively, the PEN quantifies the dynamic changes of gene epistasis, during the transition between the normal and disease states.
Personalized dynamic edge-network biomarkers theory
According to the DNB theory and its application [25–28], PDENBs can be identified from the PEN to assist in the early diagnosis and treatment of individual patients. The PDENB module can help detect early-warning signals of disease development in individual patients (Figure 1A) when it meets the following two statistical conditions for PEN:
Condition 1: The correlation and standard deviation of gene pairs in the module increase sharply.
Condition 2: The correlation between gene pairs within and outside the module reduces rapidly.
After determining the |$phPCC$| between gene pairs in the PEN and based on the aforementioned statistical conditions, the early-warning signal score to identify the PDENB module can be calculated as follows:
where |$F_P$| represents the early-warning signal score of the PDENB module; |$pDE_{\textrm{in}}$| represents the standard deviation of |$phPCC$| within the PDENB module; |$|phPCC_{\textrm{in}}|$| represents the absolute average |$phPCC$| within the module; and |$|phPCC_{\textrm{out}}|$| represents the absolute average |$phPCC$| between the gene pairs both inside and outside the PDENB module. As the composite index increases dramatically when the system approaches the critical transition point, this index can serve as an effective early-warning signal to identify the pre-disease state. For an individual patient, the module with the maximum |$F_P$| can be used to predict the early-warning signal provided the |$F_P$| is larger than a given prediction threshold. For complex diseases, the stage with the maximum |$F_P$| can be used to indicate the critical state.
Multimodal multi-objective optimization
In general, the problem that need to optimize two or more conflicting objectives is called multi-objective optimization problem. In particular, when a multi-objective optimization problem has multiple different solutions with the same objective function value, this problem is called multimodal multi-objective optimization problem. When using multimodal multi-objective optimization to identify PDENB, a solution is a PDENB module, the decision space is the configuration of gene pairs in PDENB module, and the objective space is the objective function value of PDENB module. This section will introduce the basic concepts and strategies of multimodal multi-objective optimization problems.
Dominance relation: In the objective space, solution A dominates solution B, if it satisfies both the following conditions: 1. For all objectives, solution A is not worse than B. 2. For any one of the objectives, solution A is better than B.
Pareto optimal solutions and Pareto optimal set (PS): The solution is defined as a Pareto optimal solution if it is not dominated by any other solution. All the Pareto optimal solutions in the decision space constitute PS.
Pareto front (PF): PF is defined as a map of PS in an objective space.
Multimodal solution: The multimodal solution is defined as multiple optimal solutions in the PS corresponding to one point on the PF.
MMEAs are widely used to find multiple equivalent solutions, which have the same objective function values but different configurations (i.e. multimodal solutions). For mining and reserving multimodal solutions, it is essential to establish a species protection mechanism for increasing the diversity of solutions in the decision space. This is commonly performed by establishing niche by clustering [29], ring topology [30] and multi-population technology [31]. Solutions in different niches can compete independently and are not affected by other solutions. Although the above multimodal optimization algorithms show good performance in simulation test problems, they cannot be directly applied to biomedical problems as they do not design specific strategies specifically for biological data. In particular, the complex characteristics of biomarker recognition in dynamic networks also bring acid test to the optimization algorithm. Considering the aforementioned problems, we proposed a multimodal offspring generation strategy based MMEA in our previous study involving the MMPDNB model. This strategy can effectively identify multimodal biomarkers via a new perspective. However, the MMPDNB model did not consider designing strategies to address the large-scale optimization problems and, therefore, may not be directly applicable to a larger-scale edge-network for identifying multimodal edge-biomarkers.
Latent space search
There exist several techniques for solving large-scale optimization problems [32, 33]. Among these techniques, latent space search is powerful tool to address such optimization problems. Briefly, latent space involves compressing data and learning data characteristics through spatial transformation, which can simplify data representation. The method then involves using the Karush- Kuhn-Tucker condition [34] to search the Pareto optimal latent space (a latent space comprising a set of Pareto optimal solutions with smaller dimensions than the original space) instead of the original space, which greatly reduces the cost of the search. The latent space can then be reconstructed into the original Pareto optimal space via the model. Therefore, it is critical to map the original space to the latent space for ensuring latent space search.
The machine learning method is often used to approach the Pareto optimal latent space. In the case of linear data, the principal component analysis and random embedding method can be used to reduce decision variables. For nonlinear data (e.g. PDENB identification problem), the unsupervised network structure can be used to map the original data into the latent space. Autoencoder (AE) and RBM are two basic structures in neural networks that can reduce dimensions. AE is a three-layer network functioning in continuous space and is classified as a discriminative model. RBM is a two-layer network in which each node of the visible layer and the hidden layer can be represented by 0 and 1; this is more suitable for processing binary variables. Therefore, the present study used the RBM model to learn or approximate the latent space of large-scale optimization problems.
RBM is a generative model containing two layers: visible and hidden layers. As shown in Figure 2, the neurons are not connected via connections within the layers but between layers. When the state of the visible layer neurons is provided, the activation conditions of the hidden layer neurons are independent. Given a vector |$V$| as the input, the value of each node |$h_j$| in the hidden layer is set to 1 with a probability that is calculated as follows:
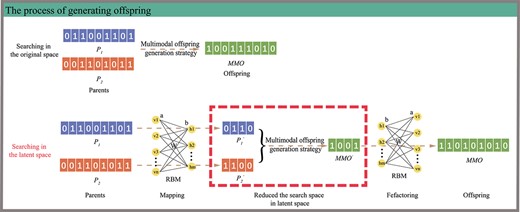
MMPDENB-RBM model generates offspring either in original space or in latent space according to decision condition. If the decision condition is not satisfied, two parents were used to generate offspring MMO in the original space by the multimodal offspring generation strategy. If the decision condition is satisfied, the offspring MMO was generated by latent space search. Firstly, the non-dominated solutions in the current population were used to train the RBM model using the CD algorithm. Then, the two parents were mapped to the latent space, in which multimodal offspring generation strategy was implemented to generate the offspring MMO’. Finally, MMO’ was reconstructed to the original space according to the RBM model. It can be seen that the generation of offspring in the latent space can greatly reduce the search space.
Where |$a_j$| is the bias of node |$h_j$|; |$w_{ij}$| is the weight between nodes |$v_i$| and |$h_j$|; and |$\sigma$| is the sigmoid function. On the contrary, when the state of the hidden layer neurons is provided, the activation conditions of the visible layer neurons are independent. Similarly, the reconstructed value of each node |$v_i$| in the input layer is set to 1 with a probability that is calculated as follows:
The original data can not only be mapped into the latent space but also be reconstructed into the original space via RBM. Reportedly, Tian et al. have proposed the MOEA/PSL [35] by introducing two types of unsupervised neural network RBMs and a denoising autoencoder to learn Pareto optimal latent space. Although the MOEA/PSL has proven to be considerably efficient in large-scale spare optimization problems, it did not consider designing an appropriate multimodal optimization mechanism for solving the multimodal optimization problem. Therefore, it is essential to design a suitable large-scale multimodal optimization algorithm by combining multimodal optimization theory and latent space search to identify multimodal PDENBs for the early diagnosis and subsequent personalized treatment of complex diseases.
MMPDENB-RBM framework
In this study, we proposed the MMPDENB-RBM model to detect multimodal PDENBs of a patient with cancer, by combining the theory of PEN construction and MMEA with latent space search (Figure 1A). The model was inputted using gene expression data of paired samples of a patient, gene expression data of normal tissue of reference sample, and somatic mutation data. The output of the model included multiple PDENBs (i.e. a set of Pareto optimal solutions) for individual patients. Briefly, the MMPDENB-RBM model was constructed in two steps: (i) using the gene expression data of an individual patient, PEN was constructed for each patient according to the paired-SSN and iENA, and (ii) for each PEN, novel MMEA was used to identify multimodal PDENB through adding latent space search mechanism on the basis of MMPDNB (Figures 1B and 2). The framework of the proposed MMPDENB-RBM model is presented below, and the program and user manual for the method are available at https://github.com/WilfongGuo/MMPDENB-RBM.
Step 1 Constructing PEN of individual patients using paired-SSN and iENA
Using the gene expression data of normal samples and tumor samples as well as the somatic mutation data for individual patients, paired-SSN was used to construct PGIN as the node-network for constructing edge-networks. Then, gene pairs with strong correlation in PGIN as candidate edges were selected to construct PEN for reducing computation time and memory space. The two genes with |$pPCC$| (Equation 4) larger than the average |$pPCC$| of the entire network were used as candidate gene pairs to construct the edge-network. Subsequently, the |$phPCC$| of the candidate gene pairs connecting in the PGIN by Equation (9) was calculated. Finally, the |$phPCC$| of the candidate gene pairs was used to construct the PEN of individual patients at different stages of cancer.
Step 2 Designing multi-objective optimization function and multimodal multi-objective evolutionary algorithm with latent space search
Multi-objective optimization function for identifying multimodal PDENBs
The formation of biomarkers does not usually require a large number of molecules to detect early-warning signals [36–38]. Similarly, we hypothesized that PDENBs with fewer edge-biomarkers but higher early-warning signal scores can still accurately predict the disease states of individual patients with cancer. Hence, the MMPEDNB-RBM model used in the present study identified the PDENBs from the PEN by optimizing the following two objective functions:
where the solution |$X=(x_1,x_2,...,x_n )$| denotes the binary decision vectors (i.e. gene pairs or edges), indicating whether the gene pair/edge is selected in the module or not, and |$n$| represents the number of gene pairs in PEN (i.e., the size of the edge-network). In the present study, the edge is equivalent to a gene pair in the PGIN. If the edge |$i$| is selected in the module, |$x_i=1$|, otherwise, |$x_i=0$|. |$pDE_{\textrm{in}} (X)$| represents the standard deviation of |$phPCC$| between edges inside the module. |$|phPCC_{\textrm{in}}|$| represents the absolute value of the average |$phPCC$| among edges inside the module, and |$|phPCC_{\textrm{out}}|$| represents the absolute value of the average |$phPCC$| among edges both inside and outside the module. In short, |$f_1$| is the first objective function that aims to minimize the number of edges in the module. The second objective function |$f_2$| aims to maximize the early-warning signal scores of the module because a higher score can more accurately characterize the critical state.
As known, PDENB theory holds that when the system reaches the pre-disease state, there will be a group of dynamically strongly correlated molecules that meet the two statistical conditions (those conditions can form a composite indicator, early-warning signal) by analyzing the dynamic equation of biological system. This group of molecules can be regarded as the dominant group of the system, which firstly respond to the transition of the system from the normal state to a pre-disease state (critical state). PDENB recognition is essentially selecting a group of molecules from the molecular network using different methods, which only needs to make the composite index maximum, without other constraints in theory. This problem is essentially a discrete and unconstrained problem, but previous studies have ignored the multimodal property of PDENB. Here, we have the first study to define the PDENB recognition problem as a multimodal multi-objective optimization problem, and design suitable strategy to efficiently solve the problem on the framework of multi-objective evolutionary algorithms.
Latent space search-based multimodal multi-objective evolutionary algorithm for identifying multimodal PDENBs
The primary novel aspect of this study is that a new large-scale MMEA was developed using PEN to identify multimodal PDENBs. Specifically, we use the multimodal offspring generation strategy [22] to explore the multimodal property of PDENBs; and algorithm generates offspring in the latent space through RBM, reducing the search space of the algorithm. The process of large-scale MMEA in the MMPDENB-RBM model is detailed below and its pseudo code is located in lines 3–28 in Algorithm 1.
Initially, an initial population (|$P_0$|) of size |$N$| (i.e. a set of solutions) was generated from PEN using a novel population initialization strategy [22](line 3). At this point, the number of function evaluation |$fe$| was 0 (line 4). Then, The value of objective functions |$F$| for the solution in the population was calculated (line 5), the non-dominated front number |$NF$| is assigned to each solution by fast non-dominated sorting[39](line 7), and |$N/2$| parents were generated using a decision space-based method for niching parents selection [40] from the current population |$P_t$| (|$t=0,1,2,...$|)(line 9). Subsequently, a condition was introduced to determine whether latent space search or original space search could be used to generate offspring (lines 10–20). After the offspring |$MMQ$| was generated, a combined population |$R=P_t\cup MMQ$| was formed (line 23). |$N$| solutions were generated from the combined population based on the environment selection strategy [39] to form the population |$P_{t}$| (line 25), which was used as the population for the next iteration. Finally, the MMPDENB-RBM model generated multiple PDENBs until the termination condition of the iteration (i.e. the maximum number of function evaluation |$Maxfe$| was satisfied.
It is essential to highlight that this novel, large-scale, MMEA uses a special multimodal offspring generation strategy, which has been elaborated in our previous work. More importantly, this MMEA allows the incorporation of the latent search strategy that enhances the performance for processing large-scale data. The condition of introducing latent space search and the generation of offspring by latent space search have been detailed in the subsequent sections and as shown in Figure 2.
Condition for introducing latent space search. The non-dominant solutions in the current population were used to train the RBM model using the contrastive divergence (CD) algorithm [41] to achieve the minimum goal of reconstruction error (i.e. the difference between the reconstructed vector |$X^{^{\prime}}$| and the original input |$X$|). Therefore, using latent space search in the entire evolution process would be time-consuming and the accuracy of RBM model would be affected via the non-dominated solution.
As a result, we set a condition that offspring can be generated by latent space when both |$fe>1/2Maxfe$| and |$rand<\rho$| are satisfied (evolution procession reaches the later stage of evolution), where |$fe$| is the number of function evaluations so far; |$rand$| is a random number; and |$\rho$| is the probability of offspring generated in the latent space that represents the ratio of the number of offspring generated by latent space search and successfully retained to the next generation to all offspring retained to the next generation during environment selection. The larger the value of |$\rho$|, the better the quality of offspring generated by latent space search, and the greater the probability of using latent space search strategy to generate offspring. The self-adaptation updating formula and validity verification of parameter |$\rho$| are explained in detail in MOEA/PSL [35].
Optimization in the early stage improved the quality of non-dominated solutions used to train the RBM model, which allowed the RBM model to approach the Pareto optimal latent space and thus reduce the computation time of the entire algorithm.
Generation of offspring by latent space search. Based on the conditions, offspring can be generated either using original space search or using latent space search. In the present study, we mainly introduced the process of generating offspring via using latent space search after RBM model training.
Initially, two parents (|$P_1$| and |$P_2$|) are taken as inputs and mapped to the latent space using RBM (hidden layer) to get |$P_{1}^{^{\prime}}$| and |$P_{2}^{^{\prime}}$|. Then, an offspring |$MMO^{^{\prime}}$| was generated in the latent space using the multimodal offspring generation strategy. Finally, the offspring |$MMO^{^{\prime}}$| was reconstructed to the original space through RBM. The size of RBM’s hidden layer (|$K$|) was determined using the calculation method of |$K$| available in the MOEA/PSL algorithm. This method was used as it helped determine the size of the hidden layer using the sparsity of the non-dominant solutions, which ensured that the biomarkers do not require a large number of molecules (i.e. objective function |$f_1$|). Usually, the size |$K$| of the hidden layer is much smaller than the size |$n$| of the input layer. Thus, the transformation of the search space from the original |$2^{n}$| to Pareto optimal latent space |$2^{K}$| greatly reduced the search space.
The large-scale MMEA in the MMPDENB-RBM model uses the Pareto optimal latent space search to generate offspring as it can greatly reduce the difficulty of search and as it uses special multimodal offspring generation strategies for mining PDENB property. In short, the MMPDENB-RBM model with large-scale optimization and multimodal optimization capabilities can effectively help identify multimodal PDENBs.
Computational complexity of MMPDENB-RBM
The MMPDENB-RBM model consists of two sections: construction of PEN and identification of PDENB module for individual patients with cancer. As the construction of PEN was based on PGIN, the complexity of PEN construction was denoted as O|$(ng^{2})$|+O|$(n^{2})$|, where |$ng$| represents the number of genes in PGIN and |$n$| is the number of gene pairs in PEN. For some operators in the novel large-scale MMEA, the computational complexity of population initialization strategy, fast non-dominant sorting, parent selection, RBM model training, multimodal offspring generation strategy, and population environment selection were represented as O|$(Nn)$|, O|$(TmN^2)$|, O|$(T(N/2)n)$|, O|$(TNlnK)$|, O|$(TNn)$| and O|$(T(2N)^{2})$|, respectively. In these equations, |$N$| is the population size, |$T$| is the number of iterations calculated using |$Maxfe/N$|, |$m$| is the number of objective functions, |$l$| is the number of solutions used to train the RBM model and |$K$| is the size of the hidden layer of the RBM model. The overall computational complexity of the MMPDENB-RBM model for all individual patients was indicated using the following equation: O|$(ng^{2}M)$|+O|$(n^{2}M)$|+ O|$(TNlnKM)$|, where |$M$| is the number of individual patients.
Experimental
Data
In this study, the MMPDENB-RBM model was applied to three gene expression datasets of patients with cancer (BRCA: |$M$| = 112, LUSC: |$M$| = 49, LUAD: |$M$| = 57) for comparative experiments and analysis. BRCA, LUSC, and LUAD differ in terms of their progress such that their cancer stages are different from each other. To make the data statistically significant, we combined the stage in which the number of patients was less than three with the closest stage. The final stages of patients with BRCA were as follows: IA, IIA, IIB, IIIA, IIIB, IIIC, IV. The stages of LUSC and LUAD were established as follows: IA, IB, IIA, IIB, III, IV. Notably, the paired samples and single nucleotide variation data of the three TCGA datasets were all used to construct the PGIN [42].
To explore the biological information of multimodal PDENBs, the present study extracted breast and lung cancer-specific synthetic lethality edge-biomarkers that have been demonstrated to be clinically effective in targeting anti-cancer drugs from the Combinatorial Drugs and the Synthetic Lethality gene pairs interactions Database (CDSynLethDB) [8]. The CDSynLethDB integrates the Synthetic Lethality genes interactions Database (https://labworm.com/tool/synlethdb). To elucidate the relationship between drug targets and drugs, we used the Drug Combination Database [43], drug-gene Interaction Database[44], DrugBank database[45] and Therapeutic Target Database[46]. Cancer tissue-specific driver genes and biomarker genes were obtained from the IntOFen dataset [47] and the CellMarker datasets [48], respectively. Details on these cancer-specific synthetic lethality edge-biomarkers, driver genes and biomarkers are provided in Additional files 1-3. The curated survival data of each cancer were obtained through UCSC Xena.
Parameter settings of MMPDENB-RBM
(i) Population size N: Considering the large scale of the problem [49] and the use of an optimization algorithm in biomedicine, the population size was set at 300 for each patient data. (ii) Termination condition: The termination criterion (i.e. the maximal number of function evaluation Maxfe) was then set as 30,000 for each independent run. To reduce the uncertainty of results, the MMPDENB-RBM model was run independently 30 times on the PEN for each patient. Then, the Pareto optimal solutions of the union results of 30 independent runs were selected as the final output.
Algorithms for comparison
The MMPDENB-RBM model was compared with six other methods, which were categorized into the following two groups according to their methodology features. (i) Evolutionary algorithms: MMPDNB [22], MOEA/PSL [35] and MP-MMEA [31] were used to identify PDENBs. MMPDNB can effectively identify multimodal DNBs, as described previously [22]. MOEA/PSL is an effective algorithm that uses RBM and denoising autoencoder strategies to solve large-scale simulated problems. In the present study, the multimodal strategy was added to MOEA/PSL for identifying multimodal PDENBs. Moreover, MP-MMEA can simultaneously solve large-scale and multimodal optimization problems and is effective in identifying multimodal DNBs. Compared with other multimodal evolution algorithms, the ideal of MMPDENB-RBM is mainly reflected in two aspects. On the one hand, the conventional mutation strategy of evolutionary algorithms (MMEA/PSL and MP-MMEA) is difficult to explore the multimodal property of PDENB solution, so MMPDENB-RBM introduces a special multimodal offspring generation strategy for PDENB recognition. On the other hand, other multimodal evolutionary algorithms (MMPDNB) lack the strategy to deal with LMOP. Thus, MMPDENB-RBM uses the RBM model to generate offspring in the latent space, thereby effectively reducing the search space of the algorithm. Therefore, comparison with these state-of-art evolutionary algorithms helped identify the advantages of the MMPDENB-RBM model. The parameters of three EAs were divided into two categories: shared parameters with MMPDENB-RBM (i.e. population size and the maximum number of function evaluations) and specific parameters of three comparisons algorithms. For fairness, it was ensured that the shared parameters of all algorithms were consistent. For particular parameters of other algorithms, the settings used in the respective original studies were used. In addition, the number of independent runs of all these algorithms was set as 30 for each patient.
(ii) DNB algorithms: Single-sample DNB (sDNB) [37], Landscape-DNB (L-DNB) algorithm [36, 50] and Sample-perturbed network entropy (SPNE) algorithm [51] were used to identify PDENBs for each patient in the PEN. The sDNB method disintegrates the PEN into multiple modules by hierarchical clustering [52]. Based on this, in the present study, the module with the largest early-warning score was regarded as the PDENB module. The L-DNB method assigned a score to each node (i.e. gene pair) on the PEN by calculating the early-warning signal score of its first-order neighborhood sub-network, where all nodes were arranged in descending order according to the score. Moreover, the top-|$k$| gene pairs were those identified in the PDENB module for the PEN of an individual patient. SPNE firstly constructs a directed network of individual sample, and the weight of each directed edge is calculated with sample-perturbed information. Then the local network entropy score of each gene pair is calculated. Finally, the top 5% gene pairs were selected as a group of biomarkers for the sample.
Performance metrics
Three metrics were used to evaluate the performance of different algorithms. (i) Average warning score: the average of the maximum early-warning score of each patient in different stages was calculated. Subsequently, the average warning score of the stage was used for obtaining the dynamic change curve during cancer development for assessing if the algorithms could detect critical states. (ii) F-score: to evaluate the effectiveness of the MMPDENB-RBM and other methods for identifying estimated cancer tissue-specific edge-network biomarkers, the present study calculated the F-score of each algorithm’s PDENBs in synthetic lethality edge-biomarkers, driver genes, and marker genes [53]. (iii) Hypervolume (HV): since the MMEA provides a set of Pareto optimal solutions, the HV index can be used to evaluate the diversity of the Pareto optimal solutions in the objective space and the convergence of EAs. However, the HV index needs a reference point, which in this study was set to 1.2 times the largest value of the two objective functions.
Results and discussions
Detection of early-warning signals of cancer development
In clinical practice, cancer development can be categorized into stages I-IV, with stage IV being the most advanced stage, in which cancer cells proliferate and metastasize to other tissues of the patient. Therefore, it is crucial to detect early-warning signals of cancer development for appropriate diagnosis. According to the PDENB theory, edge-network biomarkers in the critical state have higher early-warning scores. Therefore, the average score of PDENBs with the highest warning signal scores for patients in each stage was used to quantify the early-warning signals for cancer metastasis. As shown in Figure 3, we performed computational comparisons to evaluate the performance of related methods for identifying early-warning signals of cancer metastasis. The conclusions can be summarized as follows:

Comparison of performance of MMPDENB-RBM model and other methods regarding detection of early-warning signals of cancer development in patients with BRCA, LUSC and LUAD.
(i) The peaks of early-warning signals in patients with BRCA, LUSC or LUAD were detected in stages IIIB, IIA and IIA, respectively. As a result, these stages were considered critical for the three cancers. Of note, the MMPDENB-RBM model could more efficiently detect PDENBs with greater early-warning scores than other algorithms. Moreover, the warning scores of PDENBs estimated by the MMPDENB-RBM model would be suddenly increased at the identified critical stages.
(ii) Compared with MMPDENB-RBM, the warning scores of PDENBs identified by other MMEAs were lower and the change trend were flat. Therefore, for identifying early-warning signals, other MMEAs fall into local optimum on large-scale PEN and can not find the optimal solution. (Figure 3A–C).
(iii) Compared with the sDNB method, L-DNB and SPNE algorithm, the MMPDENB-RBM model with optimization capabilities could obtain greater early-warning signal scores of PDENBs, indicating that the model can provide effective signals of transition of cancer stages (Figure 3A–C).
Biological significance of PDENBs identified by MMPDENB-RBM model
The PDENBs identified by the MMPDENB-RBM model include PDENBs and multimodal PDENBs. Decision-makers can consider the biological significance of each PDENB and select appropriate PDENBs for analysis according to their preferences. Therefore, the present section will describe the biological significance of PDENBs identified by the MMPDENB-RBM model. First, the study investigated whether each PDENB in the group contains effective and specific biomarkers (e.g. synthetic lethality edge-biomarkers, driver genes and marker genes). Second, the study focused on the biological information of the differences among multimodal PDENBs.
Effectiveness of MMPDENB-RBM model to discover synthetic lethality edge-biomarkers, driver and marker genes
To investigate whether PDENBs identified by the MMPDENB-RBM model contain effective biological information, the present study used the known synthetic lethality edge-biomarkers, driver genes, and marker genes as criteria to determine the number of tissue-specific biomarkers the model can provide. Specifically, for identifying synthetic lethality edge-biomarkers, the model identified six, four and one types of synthetic lethality edge-biomarkers for 12, 3 and 1 patients with BRCA, LUSC and LUAD, respectively. Similarly, for driver genes, the MMPDENB-RBM model identified 5, 8 and 11 types of driver genes for 28, 21 and 22 patients with BRCA, LUSC, and LUAD, respectively. With regard to marker genes, the model identified five, five, and three types of marker genes for 28, 13 and 6 patients with BRCA, LUSC and LUAD, respectively. These tissue-specific biomarkers identified by the MMPDENB-RBM model are provided in Table 1.
Tissue-specific biomarkers identified by MMPDENB-RBM in three types of cancer patients
| Cancer | Synthetic lethality edge-biomarkers | Driver genes | Marker genes |
|---|---|---|---|
| BRCA | CYP2C19-CYP2B6 | ARID1B|$\backslash$|RB1|$\backslash$|BRCA2|$\backslash$|ARID1A|$\backslash$|ERBB2 | KRT19|$\backslash$|MYLK|$\backslash$|PROM1|$\backslash$|SLPI|$\backslash$|SYTL2 |
| MAPT-CBR1 | |||
| C1S-TUBB1 | |||
| C1S-ABCC2 | |||
| CBR1-CYP3A4 | |||
| KRAS-ESR2 | |||
| LUSC | EGFR-PIK3CA | TP53|$\backslash$|KDR|$\backslash$|EGFR|$\backslash$|NOTCH1 | MET|$\backslash$|ABCB1|$\backslash$|ABCG2|$\backslash$|GLI1|$\backslash$|CD44 |
| TP53-PTEN | SMARCA4|$\backslash$|FGFR2|$\backslash$|BRAF|$\backslash$| MAP2K1 | ||
| PIK3CA-ESR1 | |||
| TP53-EGFR | |||
| LUAD | XRCC4-BRCA1 | MAP2K1|$\backslash$|BRAF|$\backslash$|KDR|$\backslash$|NFE2L2 | MET|$\backslash$|GLI1|$\backslash$|CD44 |
| EGFR|$\backslash$|KEAP1|$\backslash$|SMARCA4|$\backslash$|FGFR2 | |||
| TP53|$\backslash$|NOTCH1|$\backslash$|CDKN2A |
To further demonstrate whether the MMPDENB-RBM model and other algorithms can effectively identify cancer tissue-specific synthetic lethality edge-biomarkers, driver genes and marker genes, the present study calculated the average F-score of all PDENBs considering available cancer-specific information as reference (Figure 4).
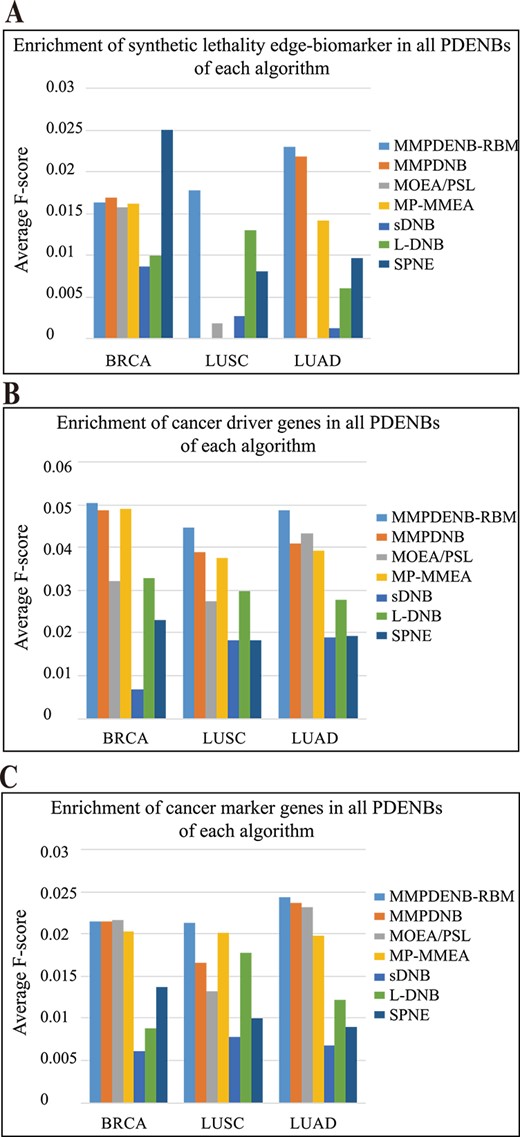
Comparison of performance of MMPDNB-RBM model and other methods for discovering cancer tissue-specific biomarkers. (A–C) Average F-score of PDENBs containing synthetic lethality edge-biomarkers, driver genes and marker genes for an individual patient.
The study found that the cancer-specific synthetic lethality edge-network biomarkers identified by the MMPDENB-RBM model showed higher enrichment than other algorithms across all three cancer types. For patients with BRCA, the SPNE algorithm had higher F-scores of synthetic lethality edge-biomarkers compared with other algorithms, the performance of MMPDENB-RBM was middling. By contrast, our MMPDENB-RBM models had higher F-scores of synthetic lethality edge-biomarkers compared with other algorithms on LUSC and LUAD datasets (Figure 4A).
Moreover, for assessing cancer-specific driver genes and marker genes, the edge-network biomarkers identified by the MMPDENB-RBM model had the highest enrichment than those identified by the other models, for all cancer data (Figure 4B–C). This indicated that the MMPDENB-RBM model could efficiently identify the cancer-specific driver and marker genes and provide more biomedical information and options for decision-makers.
In addition, for the phenomenon that F-score seems low, by analyzing the results of precision and recall we observed that the lower recall was the main reason (Figures S1–S3 in Additional file 4). To further investigate whether these methods can effectively identify special biomarkers, we performed statistical tests. The results showed that although the F-score of MMPDENB-RBM is low, MMPDENB-RBM had significant advantages over other algorithms and random selection method in general, and results of MMPDENB-RBM were statistically significant in identifying special biomarkers (P-value<0.05) (Figures S4–S6). More details of results were shown in Additional file 4.
Individual-specific biological significance based on multimodal PDENBs
The biomedical merit of multimodal PDENBs is that their differential gene pairs have different biological functions. Differential gene pairs of multimodal PDENBs are defined as gene pairs that are present in one multimodal PDENB but not in others. Thus, if differential gene pairs have specific biological functions and several multimodal PDENBs can be used to predict the critical state, decision-makers may prefer using PDENBs containing a specific biological function depending on the application. The biological significance of multimodal PDENBs in individual patients regarding drug targets and survival analysis is detailed below.
Providing effective drug targets and survival risk markers. In the present study, the MMPDENB-RBM model analyzed drug information of differential gene pairs of multimodal PDENBs to identify important drug targets for early therapeutic intervention in patients with cancer. After searching for drug target information on the iGMDR database [54], differential gene pairs of multimodal PDENBs belonging to early-stage BRCA were found to contain 12 genes targeted by 9 corresponding BRCA-related drugs. For instance, RB1 is a tumor suppressor gene that is targeted by Temsirolimus that is used to treat BRCA [55]. Similarly, 9 and 11 differential gene pairs of multimodal PDENBs were identified as potential drug targets for early-stage LUSC and LUAD, respectively. The drug targets and effective drugs corresponding to the early stages of all three cancers are shown in Table 2 and more detailed information are shown in Additional file 5.
Effective drugs and their targets identified by the MMPDENB-RBM model in the early stage of three cancer types
| Cancer | Drug target | Drug(iGMDR) |
|---|---|---|
| BRCA | NR1I2 | Bicalutamide|$\backslash$|fulvestrant |
| EZH2 | Palbociclib | |
| FBXO5 | Fulvestrant|$\backslash$|palbociclib | |
| FGFR1 | Bicalutamide|$\backslash$|fulvestrant|$\backslash$|lapatinib|$\backslash$|olaparib|$\backslash$|temsirolimus | |
| BPTF | Lapatinib | |
| SMARCB1 | Fulvestrant | |
| WDR20 | Lapatinib | |
| HNRNPD | Iloprost | |
| RAD23A | Temsirolimus | |
| ERN2 | Bicalutamide|$\setminus$|fulvestrant | |
| RB1 | Bicalutamide|$\setminus$|fulvestrant|$\setminus lapatinib$|palbociclib|$\setminus lapatinib$|temsirolimus | |
| TRIOBP | Exemestane | |
| LUSC | HNRNPA1 | Dasatinibl|$\backslash$|fluorouraci |
| PEG3 | Erlotinib | |
| HMOX1 | Erlotinib | |
| TNFRSF10B | Fluorouracil | |
| DNM1 | Erlotinib | |
| SYNCRIP | Fluorouracil | |
| CPE | Fluorouracil | |
| PRIM1 | Dasatinib | |
| EPAS1 | Dasatinib|$\backslash$|fluorouracil | |
| LUAD | MCM4 | BLEOMYCIN|$\backslash$| mitomycin C|$\backslash$| thapsigargin |
| ERCC2 | Bortezomib|$\backslash$|erlotinib | |
| AP2M1 | Crizotinib | |
| PTCH1 | Selumetinib | |
| RPS6KA1 | BMS-754807|$\backslash$|cefitinib|$\backslash$|lestaurtinib|$\backslash$|PF-4708671 | |
| CREM | Bortezomib | |
| CYBB | Bortezomib | |
| TCF7L1 | Bortezomib|$\backslash$|mitomycin C | |
| POLA2 | SB-216763|$\backslash$|thapsigargin | |
| DLG2 | Bortezomib | |
| ATF6 | Bortezomib|$\backslash$|nelfinavir|$\backslash$|thapsigargin |
In addition, a risk assessment of the above targets of differential gene pairs in multimodal PDENBs was performed using the survival analysis tool (http://www.oncolnc.org/) on TCGA datasets. The results revealed that 3 out of 12 drug target genes for BRCA could be used to accurately classify patients into high- and low-expression groups (Figure 5A–C). Moreover, two and four drug target genes specific to LUSC and LUAD, respectively, could be used as biomarkers of survival (Figure 5D–I). Therefore, specific multimodal PDENBs not only provide drug targets for precision medicine but also provide clues for survival analysis.
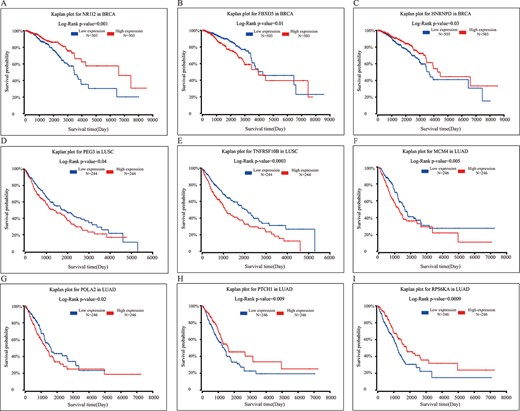
Drug targets used as predictors of survival for three cancer types. (A–C) Three biomarkers predicting survival (NR1I2, FBXO5 and HNRNPD) in patients with BRCA. (D–E) Two biomarkers predicting survival (PEG3 and TNFRSF10B) in patients with LUSC. (F–I) Four biomarkers predicting survival (MCM4, POLA2, PTCH1 and RPS6KA) in patients with LUAD.
Multimodal PDENBs might serve as a predictor of survival. To further assess the relationship between multimodal PDENBs and survival, the study categorized the survival time of patients with cancer into four stages (shorter to longer survival) to ensure that the number of patients in all stages is equal. Then, the proportion of cancer patients with multimodal PDENBs at different survival periods was assessed. As seen from the heatmap in Figure 6(A), patients with BRCA and LUAD with multimodal PDENBs tended to have a short survival time. It is likely that patients with higher survival risk (or shorter survival time) have a greater probability to have multimodal PDENBs.
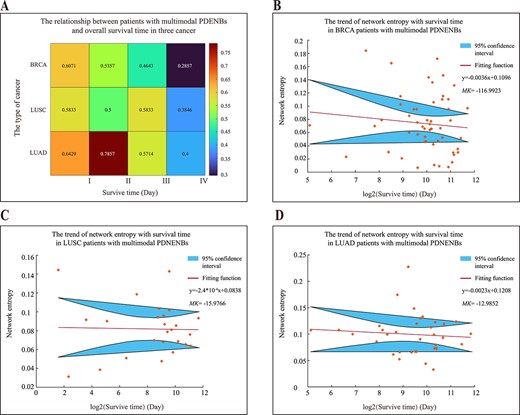
Relationship of multimodal PDENBs and survival time of patients with cancer. (A) The proportion of patients with multimodal PDENBs in relation to survival time. The four survival time points for BRCA were 768, 1622, 2064 and 3959 days; for LUSC, they were 166, 573, 1067 and 3253 days; and for LUAD, they were 417, 852, 1324 and 3674 days. (B–D) The scatter plot of the network entropy with survival time for three cancer types with multimodal PDENBs.
To further verify this hypothesis, the scatter plot of the network entropy of multimodal PDENBs and the survival time of three patients with cancer was constructed. As shown in Figure 6(B–D), the network entropy of multimodal PDENBs decreased with increasing survival time, as assessed by linear fitting. Furthermore, the Mann–Kendall trend test assessed the network entropy. According to the Mann–Kendall trend test, when statistical value MK is greater than zero, there is an increasing trend. When MK is less than zero, there is a decreasing trend. When the absolute value of MK was greater than 1.65, 1.96 and 2.58, the trend passed the significance test with 90, 95 and 99% confidence intervals, respectively. These results indicated that the network entropy of multimodal PDENBs for the three patients with cancer tended to decrease with increasing survival time and passed the trend test with a 99% confidence interval.
In addition, these results are consistent with previous theories: the entropy of biological networks under short survival times or in critical states is higher and tends to be divided into multiple modules. This implies that patients with a higher survival risk are more likely to present with multimodal PDENBs and that such multimodal PDENBs might serve as early predictors of survival.
Analysis of algorithm performance
Comparison of multimodal multi-objective evolutionary algorithms
The MMPDENB-RBM model comprises a novel MMEA with large-scale multimodal optimization ability to provide multiple Pareto optimal biomarkers for each patient. To further clarify the advantages of the MMPDENB-RBM model over other MMEAs for identifying PDENBs, we calculated the HV of the MMPDENB-RBM model and the other three MMEAs for each patient with cancer. This was performed to determine the convergence and diversity by analyzing the fitness distribution of biomarkers in the objective space. A greater HV value correlates with better performance of the algorithm. Accordingly, 30 independent runs were performed, and the mean values of HV were recorded. The box plot (Figure 7(A-C)) shows the |$P$|-value of the HV indicator of the MMEAs on the three types of cancer datasets. It is obvious that the proposed MMPDENB-RBM model significantly outperformed the other MMEAs in identifying PDENBs for BRCA, LUSC and LUAD cancer datasets.
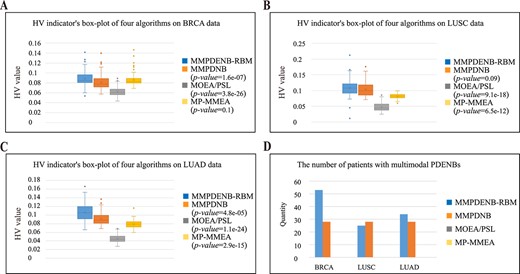
Comparison of the performance of four MMEAs on three cancer datasets. (A–C) Box plot of HV indicator used to reflect the convergence and diversity of four MMEAs. (D) Comparison of the multimodal property of four MMEAs.
To further explore the multimodal property of the MMPDENB-RBM model, the present study calculated the number of individual patients with multimodal PDENBs for the MMPDENB-RBM model and three other MMEAs corresponding to the three cancer datasets (Figure 7(D)). For this analysis, the similarity of PDENBs constituting the multimodal PDENBs was less than 90%. As shown in Figure 7(D), the MMPDENB-RBM model can provide multimodal PDENBs for more patients than other methods, especially for patients with BRCA and LUAD. Therefore, the MMPDENB-RBM model has significant advantages over other MMEAs in identifying several PDENBs, which helps investigate the multimodal property of PDENBs as required.
Comparison of PDENBs using MMPDENB-RBM model and traditional DNB methods
To explore the composition of PDENBs obtained using the MMPDENB-RBM model and traditional DNB methods, the present study evaluated the similarity of PDENBs using the Jaccard distance, as follows,
where |$D_{i}(m_1)$| and |$D_{i}(m_2)$| denote the gene pair set of the patient |$i$| determined using methods |$m_1$| and |$m_2$|, respectively. The larger the Jaccard distance, the lower the similarity between the two methods. As shown in Figure 8, the box plots of the Jaccard distance of PDENBs derived using the MMPDENB-RBM, sDNB, L-DNB and SPEN models are clustered around 1. These results show that there is little similarity between these solutions. Moreover, PDENBs provided by the traditional DNB method have limited optimization ability and edge-biomarker detection ability. Therefore, the MMPDENB-RBM model can provide a new perspective for edge-biomarker identification.
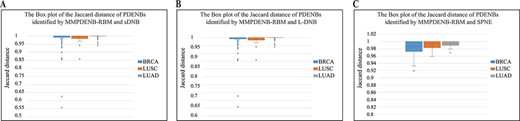
The similarity of PDENBs identified by the MMPDENB-RBM model and traditional DNB methods in three cancer datasets.
Conclusion
This study developed a novel, large-scale multimodal evolutionary algorithm for identifying multimodal PDENBs, which can detect early-warning signals and provide more potential drug targets among individual patients, supporting MPEDP in clinical application. The novel integrative framework of the MMPDENB-RBM model was constructed using PDENB theory, MMEA, and latent space search. The application of the MMPDENB-RBM model to three cancer datasets indicated that PDENBs identified by this model had the highest warning score, indicating the efficacy of the model in the early detection of cancer. Furthermore, PDENBs identified by the MMPDENB-RBM model were more enriched with functional biomarkers, such as synthetic lethality edge-biomarkers, driver genes and marker genes. Importantly, the study verified the biological significance of multimodal PDENBs: one of the multiple PDENBs can be used to predict the early-warning signals of cancer and may act as remarkable drug targets or survival predictors for individual patients with cancer. Besides, compared with other state-of-art MMEAs, the MMPDENB-RBM model had better convergence and diversity in terms of the HV index and multimodal property as well as effective optimization ability compared with the traditional edge-biomarker identification method. In summary, the present study provides decision-makers with more therapeutic options by exploring the multimodal property of PDENBs, which can help with the early treatment of individual patients with cancer.
It should be noted that the study is not without limitations. Latent space search reduces the original search space but does not eliminate redundant variables. Moreover, biological experimental validation and prospective clinical trials are required to verify the novel PDENBs identified in this study. In the future, researchers can use decision variable analysis [56], dimensionality reduction [57, 58], network controllability [59] and other artificial intelligence tools to propose more effective, large-scale multimodal optimization algorithms to identify individual biomarkers of cancer.
In conclusion, the MMPDENB-RBM model is generally model-free and offers a novel perspective on discovering PEBs for disease prediction along with the identification of therapeutic drug targets in individual patients with cancer.
A novel model (MMPDENB-RBM) was proposed by combining PDENB theory, multimodal optimization strategy and latent space search scheme to identify biomarkers with different configurations of PDENB modules.
PDENBs identified by MMPDENB-RBM were more enriched with different functional biomarkers simultaneously, such as tissue-specific synthetic lethality gene pairs, cancer driver genes, and disease marker genes.
Multimodal PDENBs provides support for multi-purpose early disease prediction, that is, multimodal PDENB can not only be used to detect early-warning signals, but also to provide potential drug targets, and can also be used as survival risk signals.
MMPDENB-RBM model had better convergence and diversity and multimodal property as well as effective optimization ability compared with the other state-of-art methods.
ACKNOWLEDGEMENTS
We thank all members of Professor Jing Liang’s lab from school of electrical engineering, Zhengzhou University, for giving us useful suggestions during the preparation of our manuscript.
FUNDING
This paper was supported by the National Natural Science Foundation of China (62002329 to W.F.G., 61922072 to J.L., 61876169 to J.L.), Key scientific and technological projects of Henan Province (212102310083 to W.F.G.), China postdoctoral foundation (2021M692915 to W.F.G.), Henan Postdoctoral Foundation (202002021 to W.F.G.), Research start-up funds for top doctors in Zhengzhou University (32211739 to W.F.G.) and open Funds of State Key Laboratory of Oncology in South China (HN2021-01 to WFG).
DATA AND CODE AVAILABILITY
Additional files 1Ċ5 mentioned in our study are available at https://github.com/WilfongGuo/MMPDENB-RBM/tree/main/MMPEDNB_Additional_files. The program and user manual for the method are available at https://github.com/WilfongGuo/MMPDENB-RBM.
Jing Liang received her BE degree from Harbin Institute of Technology, China, and her PhD degree from Nanyang Technological University, Singapore, and her dissertation received IEEE CIS Outstanding PhD dissertation award. She is currently a Professor at Zhengzhou University, Associate Editor of IEEE Transactions on Evolutionary Computation (2018-), IEEE Swarm and Evolutionary Computation (2015- ) and IEEE Computational Intelligence Magazine (2012–2017), Executive Editor of the Journal of Zhengzhou University (Engineering Science). Her main research interests are evolutionary computation, swarm intelligence, multi-objective optimization and neural network. She has published about 80 papers in computational intelligence area, which are cited more than 10 000 times according to Google Citation.
Zong-Wei Li is currently working toward a Master’s degree at the School of Electrical and Information Engineering of Zhengzhou University, His work is currently supervised by Professor Jing Liang and Professor Wei-Feng Guo. His research interests include evolution computing and its applications to human cancer data.
Ze-Ning Sun is currently working toward a Master’s degree at the School of Electrical and Information Engineering of Zhengzhou University. His work is currently supervised by Professor Jing Liang and Professor Wei-Feng Guo. His research interests include evolution computing and its applications.
Ying Bi received his PhD degree from Victoria University of Wellington, New Zealand, in 2020. She is currently a Professor with the School of Electrical and Information Engineering, Zhengzhou University, Zhengzhou, China. Her research interests lie in genetic programming, evolutionary computation, machine learning and computer vision.
Han Cheng is currently an associate professor at the School of Life Sciences, Zhengzhou University. Her research interests include bioinformatics, protein post-translational modification, biomedical big data mining and machine learning.
Tao Zeng received his BS, MS and PhD degrees from Wuhan University, Wuhan, China, in 2003, 2006 and 2010, respectively. Since 2013, he has been an associate professor in Key Laboratory of Systems Biology, SIBS, CAS and now in Guangzhou National Laboratory, Guangzhou, China. His research interests include machine learning, bioinformatics, network biology, computational biology and graph theory.
Wei-Feng Guo currently works at the Department of Electrical and Information Engineering, Zheng Zhou University. Guo obtained the PhD degree in 2020 at the Department of Automation from Northwestern Polytechnical University, China. Guo does researches in design of complex network and evolution computing algorithms and the applications to human genomics.
