


Abstract
The T-cell receptor (TCR) repertoire is highly diverse among the population and plays an essential role in initiating multiple immune processes. TCR sequencing (TCR-seq) has been developed to profile the T cell repertoire. Similar to other high-throughput experiments, contamination can happen during several steps of TCR-seq, including sample collection, preparation and sequencing. Such contamination creates artifacts in the data, leading to inaccurate or even biased results. Most existing methods assume ‘clean’ TCR-seq data as the starting point with no ability to handle data contamination. Here, we develop a novel statistical model to systematically detect and remove contamination in TCR-seq data. We summarize the observed contamination into two sources, pairwise and cross-cohort. For both sources, we provide visualizations and summary statistics to help users assess the severity of the contamination. Incorporating prior information from 14 existing TCR-seq datasets with minimum contamination, we develop a straightforward Bayesian model to statistically identify contaminated samples. We further provide strategies for removing the impacted sequences to allow for downstream analysis, thus avoiding any need to repeat experiments. Our proposed model shows robustness in contamination detection compared with a few off-the-shelf detection methods in simulation studies. We illustrate the use of our proposed method on two TCR-seq datasets generated locally.
INTRODUCTION
The T-cell receptor (TCR), the protein complex on the surface of T cells, recognizes protein antigens loaded on major histocompatibility complex molecules on the surface of host cells [1]. In humans, TCRs of about 95% of T cells consist of an alpha chain (|$\alpha $|) and a beta (|$\beta $|) chain, while the rest have gamma(|$\gamma $|) and delta(|$\delta $|) chains. Arstila et al. [2] previously estimated that more than 20 million different |$\alpha \beta $| pairs can be generated per person. Such high diversity of TCRs ensures a high probability that different foreign antigens can be recognized.
As a type of high-throughput technology, TCR sequencing (TCR-seq) has been used by many studies to identify specific types of T cells present in a sample and how they might be involved in the immune response to different antigens. This information can be useful for a variety of applications, including studying the immune system and developing new treatments for diseases. Our group previously reported an association between TCR intratumor heterogeneity (ITH) and disease relapse, as well as disease-free survival among patients with localized lung adenocarcinomas. [3]. Another study by Gantner et al. [4] revealed that clonal expansion improves the persistence of the human immunodeficiency virus (HIV) reservoir under the impact of antiretroviral therapy by analyzing TCR-seq data. More recently, TCR-seq also has been used in the analysis of COVID-19 to help scientists understand immune responses driven by the pandemic [5].
Similar to other high-throughput technologies, contamination can occur at multiple steps throughout experiments, including sample collection, library preparation, etc. For example, an incorrect sample assignment, known as index hopping, may occur when some reads are incorrectly assigned from one sample to a different sample in a pool due to index switching. This misassignment generates incorrect read counts for involved samples, leading to incorrect downstream analysis results [6]. In addition, cross-contamination problems existing in other sequencing platforms, such as the multiplet issue in RNA sequencing, also can happen in TCR-seq, leading to mixed expression. However, currently, most studies are carried out assuming no contamination exists. No effective methods have been developed for addressing contamination in TCR-seq analysis.
Motivated by potential contamination issues in TCR-seq data from our group, we sought to overcome these hurdles in cohorts of subjects diagnosed with lung cancer. Each subject had multiple samples collected at different time points. During the initial data exploration, we observed abnormally high overlaps between the samples from different patients and a few excessively prevalent TCR sequences across all samples. Biologically, two T cells rarely share identical CDR3 nucleotide sequences unless they are from the same expanded T cell clone [7]. The contamination may come from cell sorting or the process of library preparation. Nevertheless, it is difficult to determine at which step contamination is introduced, and decontamination is even more challenging.
In this work, we develop a novel statistical method called TCR-Broom to assess the severity of the contamination and eliminate it to facilitate downstream analysis. Our method is the first of its kind to provide a full pipeline of visualization, detection and removal of contamination in TCR-seq data. The details of our method and the evaluations using simulation and real datasets are presented in the Methods and Results sections. The implementation of our method is available as an open-source R package available at https://github.com/rx-li/TCRBroom.
METHODS
Suppose that two subjects have |$N_{1}$| and |$N_{2}$| TCR sequences, respectively, and they share |$N_{c}$| sequences. The pairwise TCR overlap is defined as |$N_{c}/(N_{1} + N_{2} - N_{c}).$| As TCRs are highly diverse, the shared TCR sequences between two subjects are expected to be rare [7]. We illustrate this using a published dataset with minimum contamination (Figure S1). The heatmap shows that the pairwise TCR overlaps between any two subjects are extremely small, with most of them less than |$5e^{-4}$|. When exploring our motivating dataset, we find several abnormally high TCR overlaps between two subjects with proportions of overlap greater than 0.02. In addition, high prevalence rates are seen for some sequences, e.g. there is a sequence shared by all the samples. These unusual overlaps can be caused by consecutive sampling or contamination during library construction. It is important to address the contamination before further downstream analyses.
We summarize the contamination into two sources, pairwise overlaps (two subjects sharing an excessively high proportion of TCR sequences) and cross-cohort overlaps (sequences detected in an excessively large number of samples).
First, we provide a visualization tool that generates a heatmap for presenting the magnitude of overlaps between any two subjects and a visualization of cross-cohort overlaps. Such visualizations can reveal potential contamination: abnormally high overlap in the heatmap and high prevalence of a sequence are alarming signs. We also provide a function that can identify subjects with fewer sequences. The function will summarize unique sequences for each subject and flag those subjects with sequences lower than a threshold. By default, the cutoff integer is set to 1000. Next, we incorporate the prior information of non-contaminated TCR-seq datasets via a novel Bayesian model to detect statistically abnormal pairwise overlaps. An empirical test is used to identify the sequence with an abnormally high prevalence rate. A schematic of the contamination detection approaches is presented in Figure 1.
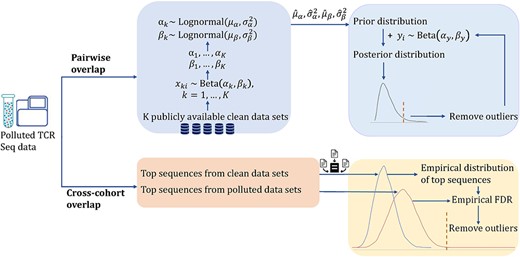
Schema of the proposed method for contamination detection. Contamination is summarized into two groups: pairwise overlap and cross-cohort overlap. We use a Bayesian model to reduce the contamination from pairwise TCR overlap and an empirical test to reduce the contamination from cross-cohort overlap.
The clean TCR-seq data are key to estimating an accurate distribution of the sequence overlaps without contamination. We suggest that the clean reference data should have similar characteristics as the contaminated data, such as having similar organ/tissue type. In our real data application, we have two different contaminated datasets: one dataset contains the TCR repertoire from peripheral blood mononuclear cells (PBMC) samples, and the other contains the TCR repertoire from tumor samples. We collect clean datasets for these two different contaminated datasets separately.
For PBMC, we collected a total of 14 PBMC clean datasets from immunoSEQ (Adaptive Biotechnologies, https://www.immunoseq.com/). By checking with the support team in Adaptive Biotechnologies and visualizing the pairwise/cross-cohort overlaps, we confirm that the collected datasets have minimum contamination. The 14 reference datasets were used in 14 published studies involving the research of lung cancer, classical Hodgkin’s Lymphoma, ovarian cancer, Wiskott–Aldrich Syndrome, etc. Each sample is collected from a different patient. [3, 8–19]. The other clean reference we obtained is from a study about the immune contexture of invasive lung adenocarcinoma and its precursors [20]. We name the data set ‘ImmuneILA’. This published data set was obtained from The University of Texas MD Anderson Cancer Center.
Pairwise contamination
We compute pairwise TCR overlaps for reference data and contaminated data. We observe that the TCR overlap values are highly skewed, varying from 0 to 1, and the majority of them are close to 0. For data with contamination, the overlap values trail off heavier on the right side. We use beta distribution to model such data pattern. As expected, the shape parameters of beta distributions for reference data and contaminated data are different. We then assume a lognormal distribution as the prior to capture the mechanism of those shape parameters modeled from data without contamination.
Suppose that we have |$K$| independent datasets without contamination. Let |$x_{ki}$| represent the |$i_{th}$| pairwise TCR overlap value in data set |$k$|. The proposed model can be written as
For a data set with contamination, let |$y_{i}$| represent the |$i_{th}$| overlap value. We have
The posterior distribution can be calculated using the distribution of |$y_{i}$| with the lognormal prior estimated from data without contamination:
We identify outliers as the potential abnormal pairwise TCR overlap values. Given a cutoff |$\tau $|, the outliers are defined as
where |$F(y_{i}; \alpha _{y}, \beta _{y}) = \int p(y_{i}; \alpha _{y}, \beta _{y}) d y_{i}$| is the cumulative posterior distribution function. The cutoff will correspond to a one-sided cutoff for probability density function, |$q$|:
where the component |$F(y_{i}; \alpha _{y}, \beta _{y})>= 0.5$| ensures that only the large outliers are identified, since the small values generally indicate low overlaps.
Different cutoff values can be chosen based on the expected false discovery rate. For example, when we apply the proposed model on the TCR-seq data from PBMCs, an adaptive cutoff based on the number of total pairwise TCR overlaps is used to detect the outliers to make sure the false discovery rate is lower than 0.01.
We detect outliers through an iterative algorithm. In each iteration, we identify the outliers based on the current posterior distribution and recompute the posterior distribution by removing the detected outliers. We then continue to identify outliers using the new posterior distribution. The above process is repeated until no new outliers can be found with the current criteria.

The pairwise TCR overlap is defined based on the number of TCR sequences as shown in the formula (1). We noticed that if the number of sequences is low in the two samples under consideration, the calculated overlap can be high even if the overlapped sequence number is not excessively high. In order to reduce such false positives, after abnormal pairwise TCR overlaps are detected, we manually check each pair to make sure the high overlap value is not due to the limited number of sequences in the two subjects. In our dataset, subjects typically had more than one sample, and heavy overlap tended to happen from a particular sample from one subject to another. Under this situation, we will consider that particular sample is a source of contamination, which may be removed from downstream analysis.
Cross-cohort contamination
For a dataset with |$N$| patients, supposing a sequence appears in |$n$| patients, we define the prevalence rate as |$n/N$|. Shared CDR3 nucleotide sequences among samples from one subject can occur. However, a single CDR3 nucleotide sequence can be flagged as a source of contamination if it appears in all subjects’ samples. Currently, no guaranteed cutoff has been reported before to determine whether a prevalence rate of a TCR sequence is reasonable.
To accurately identify the abnormal prevalence rates of TCR sequences, we refer to the clean studies. In each study, we calculate the prevalence rate for each single sequence and extract the top prevalent TCR sequences to construct an empirical distribution as the reference. Let |$pro_{i}$| represent the prevalence rate for sequence |$i$| in the contaminated data. Suppose that we have |$N$| normal sequence prevalence rates, and |$n_{i}$| of them are larger than |$pro_{i}$|. Then the empirical P-value for |$pro_{i}$| is defined as |$P_{i} = n_{i}/N$|.
FDR is then calculated by adjusting the empirical P-values using the Benjamini–Hochberg (BH) procedure. We identify the TCR sequence with an FDR less than 0.05 as the source of contamination.
RESULTS
Simulation
To specifically examine the performance of the proposed method for identifying the two sources of contamination, we design two sections of simulation studies. We manually generate the contaminated sequences and compare our proposed method with off-the-shelf clustering methods: K-means and hierarchical clustering in separating the contaminated sequences from the clean ones.
Pairwise TCR overlap
Simulation design. We randomly extract 400 pairwise TCR overlap values from the reference data. Artificial contamination randomly generated using different beta distributions is then added to the extracted data, where the shape parameters of beta distributions are fixed at (2, 100), (2, 500), (2, 1000), (3, 100), (3, 500) and (3, 1000), respectively. More distribution settings can be found in Supplementary Figure S2. The numbers of contaminated values are fixed at 10, 20 and 30. The different beta distributions have different similarities with the clean data, and thus they create different levels of difficulty in separating the clean and contaminated data. In general, |$Beta(3,\cdot )$| is further away from the clean data than |$Beta(2,\cdot )$|. The second parameter in Beta controls the variance and larger values (e.g. 1000) generate more noisy contamination. |$Beta(2,1000)$| is the most noisy situation for the evaluation, while |$Beta(3,100)$| is relatively the easiest to identify.
We apply K-means clustering [21], hierarchical clustering [22, 23] and the proposed model on the simulated datasets to separate the contaminated and clean data. We set the classification cluster as 2 for K-means clustering, and cut the tree into two clusters for hierarchical clustering. When categorizing two clusters, if most of the values in a cluster are from the reference data, we classify that the cluster is the group for data without contamination. For each combination of settings, the presented results are summarized over 20 Monte Carlo datasets.
Simulation results. The accuracy of contamination detection using the three methods is measured by F-score, sensitivity and specificity. F-score is calculated from the numbers of true positive (TP), false positive (FP) and false negative (FN), i.e.
Figure 2 presents the F-scores under different simulation settings. The specificity and sensitivity can be found in Supplementary Figure S3. We observe that the proposed model achieves the highest F-score compared with K-means and hierarchical clustering under each setting, which indicates that our proposed model balances sensitivity and specificity well. Moreover, from Supplementary Figure S3, we see that all the three methods have high specificity scores showing the ability to correctly identify values without contamination. However, K-means and hierarchical clustering have low accuracy in identifying the artificial contamination, resulting in low sensitivity scores.
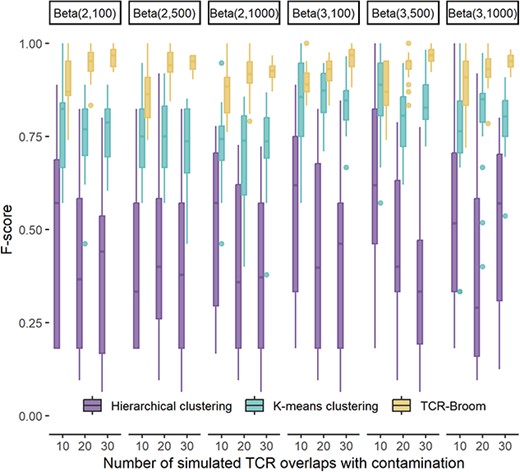
F-score of abnormal pairwise TCR overlap detection using the proposed model, K-means clustering and hierarchical clustering. The X axis represents the number of simulated TCR overlaps with contamination along with distribution settings.
Cross-cohort overlap
Simulation design. In this simulation setting, we plan to evaluate the performance of the proposed methods in detecting the cross-cohort overlap versus the two existing clustering approaches. We randomly extract clean 1000 sequence prevalence values. Artificial contamination is then added to the data by randomly drawing from the following uniform distributions: Unif(0.3, 1), Unif(0.35, 1), Unif(0.4, 0.8) and Unif(0.4, 1). The smaller the lower bound of the uniform distribution, the more similar it is to the sequence prevalence rates in non-contaminated data. We compare the performance of our proposed model with K-means clustering and hierarchical clustering on the detection of the cross-cohort contamination. When categorizing, if most of the values in a cluster are from data without contamination, we label the cluster as the group for data without contamination. Similar to the above section, accuracy of the contamination detection using the three methods is measured by F-score, sensitivity and specificity. For each combination of settings, the presented results are summarized over 20 Monte Carlo datasets.
Simulation results. Figure 3 presents the F-scores under different simulation settings. The specificity and sensitivity can be found in Supplementary Figure S4. We observe that the proposed model achieves the highest F-score compared with K-means and hierarchical clustering when artificial contamination is similar to reference data. When the differences between artificial contamination and the reference data get larger, the K-means and hierarchical clustering also work well. We see that all the three methods have high specificity scores, showing that they can correctly identify values without contamination. However, K-means and hierarchical clustering have low accuracy in identifying the cross-subject contamination, especially when the contamination is similar to the clean data.
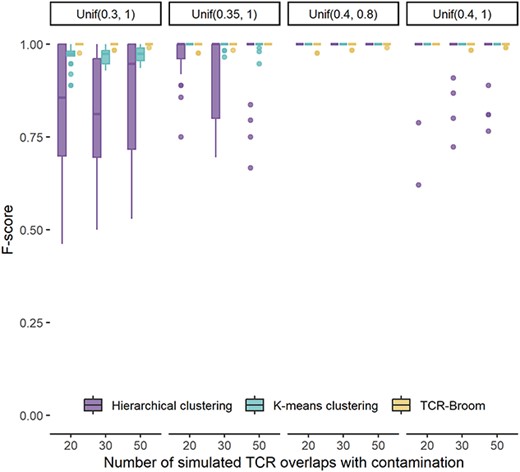
F-score of cross-cohort overlap detection using the proposed model, K-means clustering and hierarchical clustering. The X axis represents the number of simulated TCR overlaps with contamination along with distribution settings.
In summary, the proposed model outperforms K-means and hierarchical clustering, and it shows robustness to identify the contamination from pairwise TCR overlap and sequence prevalence.
Application on TCR data from PBMC samples
We first apply the proposed method on the contaminated TCR-seq data from PBMC samples. The whole data set contains samples from two batches, and we apply our model on them separately. We will use samples from one batch as an example to present our work. 121 samples from 50 patients are included.
Cross-cohort overlap
The TCR-seq dataset contains over 60 000 sequences. First, we compute the empirical distribution for the sequence prevalence using the 14 reference datasets following the process stated in the Methods section. Second, we extract the top frequent TCR sequences from the TCR-seq data and calculate the FDR for each sequence by comparing them with the empirical distribution. Lastly, we identify 11 sequences with FDRs of less than 0.05 to be excluded from the study. Figure 4(A) presents TCR sequence prevalence in the data set before and after removing the contamination in blue and red boxes, separately. The purple boxes are TCR sequence prevalence in the 14 reference datasets. For each study, the last name of the first author and the year published are shown on the X axis. We can see that after removing contamination, the distribution of the TCR prevalence rate becomes closer to the TCR prevalence rates in datasets without contamination.
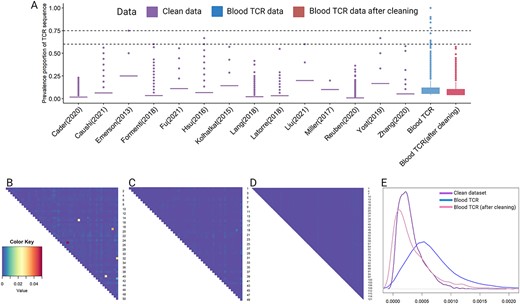
Box plots showing cross-cohort overlap decontamination and heatmaps showing pairwise overlap decontamination for TCR data from PBMCs. (A) Box plots of TCR cross-cohort overlap in different studies. The X axis represents the studies’ names: ‘Last name of first author(year published)’. Blood TCR is our contaminated data. The purple boxes show distribution of the TCR cross-cohort overlap in data without contamination. The blue box shows distribution of the TCR cross-cohort overlap in our contaminated dataset. The red box shows distribution of the TCR cross-cohort overlap in the blood TCR-seq data after removing the contamination. (B) Heatmap presenting pairwise TCR overlaps computed from the contaminated data set. (C) Heatmap presenting pairwise TCR overlaps after removing contamination using the proposed methods. (D) Heatmap presenting pairwise TCR overlaps computed from a data set without contamination. (E) Density curves of pairwise TCR overlaps. The pattern of the density of the contaminated dataset became more similar to the clean dataset after the cleaning procedure.
Pairwise overlap
After removing the cross-cohort overlap, we compute pairwise TCR overlaps for every two patients, resulting in a total of 1225 pairs. Figure 4(B) shows the magnitude of the pairwise TCR overlaps, where abnormally high TCR overlaps are marked in bright colors.
Using the 14 reference datasets, we estimate the shape parameters of beta distribution for each data set and the lognormal prior distributions for those shape parameters. The estimated lognormal prior distributions are
Taking this prior, we compute the posterior distribution for our contaminated data and detect outliers iteratively as we described in the Methods section. A total of 12 abnormal high pairwise TCR overlaps are identified. We manually check each pair to confirm that the contamination is not a false positive due to low sequence numbers. An example sample intersection showing contamination between two subjects is presented in Supplementary Figure S5. If among the three samples from subject 1, sample 2 shares a substantial amount of TCRs with all samples in the other subject, we conclude that sample 2 from subject 1 should be excluded from the data set. Overall, we remove seven samples from the TCR-seq data set. Figure 4(C) presents pairwise TCR overlaps after removing the identified samples and sequences. Figure 4(D) is a heatmap showing magnitude of TCR overlaps from a data set without contamination [3]. We can see that the heatmap of contaminated data becomes much more similar to the heatmap of data without contamination, which indicates the contamination has been largely eliminated by this process. Figure 4(E) presents the density for the three heatmaps. We observe that the pattern of the density of the contaminated dataset became more similar to that of the clean dataset after the cleaning procedure.
Assessing non-informative prior
To evaluate the non-informative prior, we first tried two simulation settings which are
and
The simulation process is the same as we described in the Simulation section previously. We randomly extract 400 pairwise TCR overlap values from the reference data. Simulated TCR overlaps with contamination are randomly generated using different beta distributions and added to the extracted data, where the shape parameters of beta distributions are fixed at (2, 100), (2, 500), (2,1000), (3, 100), (3, 500) and (3, 1000). The number of simulation TCR overlaps with contamination are fixed at 10, 20 and 30. The results can be found in Supplementary Figure S6. Compared with the informative prior, overall, the sensitivity of identified outliers is lower when using the non-informative prior. The lognormal non-informative prior generated better results compared with the uniform non-informative prior.
Then, we try the two non-informative prior settings on the PBMC TCR dataset. We compute the posterior distribution for our contaminated data and detected outliers iteratively as we described in the Methods section. When using the lognormal non-informative prior, the same 10 abnormal high pairwise TCR overlaps are identified as we used the prior distribution computed from reference datasets. When using the uniform non-informative prior, eight abnormal high pairwise TCR overlaps are detected. Based on these results, we find that lognormal non-informative prior gives results that are similar to those generated from informative prior. We believe that the choice of distributions for non-informative prior is important. The closer the distribution of the non-informative prior to the real distribution, the better the results generated.
Application on TCR data from tissues
The tissue TCR-seq data consists of 177 normal lung, lung cancers and lung cancer precursor samples from 49 patients. For the cross-cohort overlap, we use the same empirical distribution used for the TCR-seq data from PBMCs to calculate FDR. Using 0.05 as the FDR cutoff, 12 912 out of 784 709 sequences are excluded from all samples.
The comparison of sequence prevalence of the TCR-seq data from tissues before and after cleaning can be found in Figure S7. It can be observed that sequences with high prevalence are substantially reduced after the detection and removal procedure.
After removing the cross-cohort overlap, we compute pairwise TCR overlap for every two patients. Referring to the ‘ImmuneILA’ reference dataset, we start to build the Bayesian model. The beta distribution that is estimated for the ‘ImmuneILA’ dataset is |$\text{Beta}(0.87, 1136.41).$|
The variance of the lognormal prior distribution cannot be estimated due to having only ‘ImmuneILA’ dataset as a reference. In order to have the best guess of the variance, we borrow the estimated ratio of mean and variance of the lognormal prior distribution that was estimated from the TCR-seq data from PBMC samples in the above subsection, and then calculate the variance using that mean/variance proportion. For example, the mean/variance proportion for the first shape parameter estimated from the TCR-seq data from blood samples is |$\frac{1.14}{0.51} = 2.235$|. The first shape parameter of the above beta distribution is |$0.87$|, which can give the mean of the lognormal prior distribution to be |$\text{log}(0.87) = -0.144$|. Then the variance of the lognormal prior distribution can be calculated as |$|-0.144 / 2.235| = 0.064$|. Similar for the second shape parameter, we can calculate the lognormal prior distribution as
We repeat the same iterative outliers detection procedure using 0.05 as the cutoff value. A total of 193 pairs were detected. We manually check each pair to determine which sample should be excluded from the study. Figure S8 shows a few pairwise overlap plots. We observe for two subjects that each subject has more than one sample; heavy contamination might be caused by a sample from one subject. Such a sample would be excluded from the study. After this manual check, we remove 57 samples from the data set. Figure 5 compares heatmaps of pairwise overlaps before and after our cleaning. The pairwise overlaps reduce dramatically after the cleaning process.
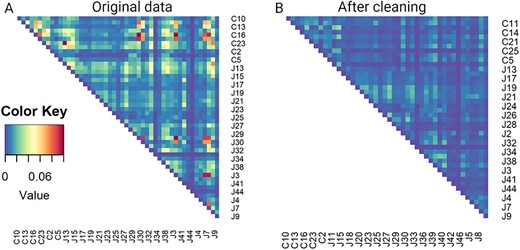
Heatmaps showing magnitude of pairwise overlap for TCR data from tissues. (A) Heatmap presenting pairwise overlaps computed from the contaminated data set. (B) Heatmap presenting pairwise overlaps after removing contamination using the proposed methods.
DISCUSSION
In this work, we develop a novel statistical method to identify and remove the potential contamination in TCR-seq data. As the standard experimental guidelines have been provided by the sequencing company, many experiments do not have, or have minimum level of sample contamination. However, as in the case of our motivating example, it is possible that some of the preprocessing procedures taking place at local sites could cause potential sample/data contamination. As the cost of rerunning experiments is usually prohibitively high, we sought to develop a method to systematically address the data contamination problem in TCR-seq data. In this work, we consider detecting the contamination using a rigorous statistical model that allows for incorporating prior knowledge from existing non-contaminated datasets. We demonstrate the robust performance of the proposed model using a series of simulations and two real data applications.
The proposed model currently focuses on the abnormally common TCR sequences among subjects and chooses distributions according to the characteristics of our datasets. We acknowledge that different TCR-seq data may have different forms of contamination, but the procedure of solving the contamination issue can be generalized with slight modifications on parameter or distribution selection. The order of removing pairwise TCR overlap and cross-cohort contamination may impact the final results. Usually, cross-cohort contamination is of small number and has minimum impact. However, if the cross-cohort overlap is heavy, we recommend to remove the cross-cohort overlap first as it can have influences on the magnitude of pairwise contamination. Another limitation of the proposed model is the requirement of more than one reference dataset to accurately estimate the prior distribution. In the case that no reference data are available, a non-informative prior can be used as an alternative.
TCR sequencing (TCR-seq) has been widely applied to understand the immune response to various infections or diseases. Similar to other high-throughput sequencing, contamination may happen in several experimental steps.
We summarize the contamination of TCR-seq data into two sources: pairwise and cross-cohort overlaps.
We develop a computational tool, TCR-Broom, which can visualize and statistically identify the contaminated samples and sequences.
The proposed methods see robustness and accuracy over existing methods through extensive simulation studies.
The application in two TCR-seq datasets demonstrates the usage of the proposed method.
AUTHOR CONTRIBUTIONS STATEMENT
Z.L. and J.Z. conceived the idea. R.Li and Z.L. developed the model, conducted the simulations and wrote the manuscript. J.Z. and M.A. supported the TCR sequencing experiment. A.R. provided useful suggestions on TCR analysis. R.Lin provided useful suggestions on model formulation.
ACKNOWLEDGMENTS
This work has been partially supported by the National Cancer Institute of the National Institute of Health (R01CA234629 to J.Z., R03CA270725 to Z.L. and J.Z.).
DATA AVAILABILITY
The dataset that we used in for the study can be accessed through ImmunoSEQ database https://clients.adaptivebiotech.com/immuneaccess.
Author Biographies
Ruoxing Li is a Ph.D. student at the Department of Biostatistics and Data Science in the University of Texas Health Science Center at Houston.
Mehmet Altan, Alexandre Reuben and Hai Tran are Assistant Professors at the Department of Thoracic-Head and Neck Medical Oncology in the University of Texas MD Anderson Cancer Center.
John V. Heymach is the Chair of Thoracic-Head and Neck Medical Oncology in the University of Texas MD Anderson Cancer Center.
Runzhe Chen is a Postdoctoral Fellow at the University of Texas MD Anderson Cancer Center.
Latasha Little is the laboratory manager at the Department of Genomic Medicine in the University of Texas MD Anderson Cancer Center.
Shawna Hubert is the scientific project director at the Department of Thoracic-Head and Neck Medical Oncology in the University of Texas MD Anderson Cancer Center.
Jianjun Zhang is an Associate Professor at the Department of Thoracic-Head and Neck Medical Oncology in the University of Texas MD Anderson Cancer Center.
Ruitao Lin and Ziyi Li are Assistant Professors at the Department of Biostatistics in the University of Texas MD Anderson Cancer Center.
REFERENCES
Author notes
Ruoxing Li, Mehmet Altan, Alexandre Reuben contributed equally to this work.
