


Abstract
The ability to identify and track T-cell receptor (TCR) sequences from patient samples is becoming central to the field of cancer research and immunotherapy. Tracking genetically engineered T cells expressing TCRs that target specific tumor antigens is important to determine the persistence of these cells and quantify tumor responses. The available high-throughput method to profile TCR repertoires is generally referred to as TCR sequencing (TCR-Seq). However, the available TCR-Seq data are limited compared with RNA sequencing (RNA-Seq). In this paper, we have benchmarked the ability of RNA-Seq-based methods to profile TCR repertoires by examining 19 bulk RNA-Seq samples across 4 cancer cohorts including both T-cell-rich and T-cell-poor tissue types. We have performed a comprehensive evaluation of the existing RNA-Seq-based repertoire profiling methods using targeted TCR-Seq as the gold standard. We also highlighted scenarios under which the RNA-Seq approach is suitable and can provide comparable accuracy to the TCR-Seq approach. Our results show that RNA-Seq-based methods are able to effectively capture the clonotypes and estimate the diversity of TCR repertoires, as well as provide relative frequencies of clonotypes in T-cell-rich tissues and low-diversity repertoires. However, RNA-Seq-based TCR profiling methods have limited power in T-cell-poor tissues, especially in highly diverse repertoires of T-cell-poor tissues. The results of our benchmarking provide an additional appealing argument to incorporate RNA-Seq into the immune repertoire screening of cancer patients as it offers broader knowledge into the transcriptomic changes that exceed the limited information provided by TCR-Seq.
INTRODUCTION
Immunotherapy is an effective approach to treat a variety of advanced malignancies [1, 2]. The success of immunotherapy relies in part on the presence of CD8+ cytotoxic T cells, which recognize tumor antigens via their T-cell receptors (TCRs), and then induce targeted cell apoptosis [1]. The ability to characterize the TCR repertoire in patient samples is increasingly central to the field of immunotherapy and cancer research [3, 4]. Targeted TCR sequencing (TCR-Seq) approaches are currently used to measure the diversity and clonality of the TCR repertoire [5–9], which can be affected by immune checkpoint inhibitors and can serve as a surrogate measure of effectiveness and overall prognosis [10–12]. Furthermore, the ability to track genetically engineered T cells expressing chimeric TCRs that target specific tumor antigens is important to determine the persistence of these cells and corresponding clinical responses. However, TCR-Seq is not frequently done compared with RNA-Seq; thus, there is a significant amount of RNA-Seq data available that can be used to extract TCR data. RNA-Seq-based TCR profiling methods have been developed to bridge the gap [13–15]. For example, a recent study demonstrated that MiXCR could detect all TCRβ sequences with relative frequencies greater than 0.15% in one of T-cell-rich tissues [16]. However, despite the great promise of RNA-Seq-based TCR profiling methods, such methods were not systematically benchmarked and they were validated in extremely small numbers of samples and limited scenarios. Thus, the biomedical communities remain uninformed regarding the advantages and limitations of these RNA-Seq-based TCR profiling methods. In addition, the feasibility of applying these methods across various cancer tissue types and TCR repertoire types remains unknown.
Here, we performed a comprehensive benchmarking of existing RNA-Seq-based TCR profiling methods. The performance of these methods was investigated by using TCR-Seq as a gold standard across T-cell-rich and T-cell-poor tissues from different cancer tissue types and immune repertoire types. We have carefully examined the scenarios of low Shannon Diversity Index (SDI) (repertoires are dominated by one or a few clonotypes with high frequencies) and high SDI (repertoires are composed of clonotypes with frequencies nearly evenly distributed) TCR repertoires under which such tools can leverage RNA-Seq data and provide reliable estimates of TCR repertoires, which is currently unknown. Our results show that RNA-Seq-based TCR profiling methods are able to effectively capture the majority of TCR-Seq confirmed clonotypes in low SDI repertoires. These methods are also capable of precisely estimating the overall TCR repertoire diversity and clonotype frequencies in T-cell-rich low SDI repertoires. However, in the case of low SDI repertoires, the small number of receptor reads that capture major clonotypes is enough to estimate diversity even in T-cell-poor tissues. Moreover, bulk RNA-Seq stored both TCRα and TCRβ chain information; these methods offered the possibility to characterize both TCRα and TCRβ repertoires. However, cautions need to be taken for T-cell-poor tissues as the results typically were less accurate because of the lack of ability of RNA-Seq-based methods to detect clonotypes with low frequencies. To conclude, we have examined the ability of RNA-Seq-based TCR profiling methods in different types of tissues and repertoires, thus providing a comprehensive guide in which tissues RNA-Seq-based TCR profiling methods are feasible to deliver comparable results to targeted TCR-Seq.
RESULTS
We assembled the largest multi-cohort dataset which was composed of 19 samples and 5 tissue types (Table 1, Supplementary Table 1, Supplementary Figure 1). These samples include peripheral blood mononuclear cells (PBMCs) (N = 5), melanoma biopsy samples (N = 9) [12, 17], renal clear cell carcinoma (N = 3) [18] samples and melanoma specimens from the ileocecal lymph node (N = 1) and the small intestine (N = 1) [16]. All the samples were sequenced by both TCR-Seq (only for TCRβ chain) and RNA-Seq. The samples have different T-cell levels based on deconvolution results provided by the Gene Expression Deconvolution Interactive Tool (GEDIT) [19], and different diversity levels based on SDI and clonality. We defined the samples with SDI <2 as low SDI samples, otherwise high SDI samples (Supplementary Figure 2). The distribution of clonotypes in the samples is shown in Supplementary Figure 3. Available RNA-Seq-based repertoire profiling methods that are designed to assemble the complementarity-determining regions 3 (CDR3) from RNA-Seq data were included in this benchmarking study, which includes MiXCR [13], ImReP [14], TRUST4 [15] and CATT [20] (Table 2, Supplementary Table 2). We excluded IMSEQ [21] because it was originally designed for TCR or immunoglobulin (Ig) sequencing, but not for RNA-Seq. The details of the samples and methods are described in the method section.
Overview of the gold standard dataset. We had different cohorts from five different tissue types in total. We documented the average number of TCR-Seq reads in million (indicated in the column ‘Average number of TCR-Seq reads’), the average number of RNA-Seq reads in million (indicated in the column ‘Average number of RNA-Seq reads’), RNA-Seq read length (indicated in the column ‘Length of RNA-Seq reads’), the fraction of T cells in certain tissue type (indicated in the column ‘Fraction of T cells in tissue’), the number of samples from each tissue type (indicated in the column ‘Number of samples ’), the number of low SDI samples and high SDI samples from each tissue type (indicated in the column ‘Number of low SDI/high SDI samples’)
| Tissue type | Number of TCR-Seq reads (millions) (mean ± SD) | Number of RNA-Seq reads (millions) (mean ± SD) | Length of RNA-Seq reads (bp) | Fraction of T cells in tissue | Number of samples | Number of low SDI/high SDI samples | Resources |
|---|---|---|---|---|---|---|---|
| PBMC | 0.122 + 0.1 | 66.8 + 24.4 | 150 | High | 5 | 3/2 | In-house |
| Melanoma biopsy | 0.951 + 0.523 | 74.7 + 15.9 | 100 | Low | 9 | 1/8 | In-house |
| Renal cell | 0.0102 + 0.007 | 88.3 + 28 | 50 | Low | 3 | 0/3 | TCGA |
| Lymph node | 3.26 | 66 | 100 | High | 1 | 0/1 | SRA |
| Small intestine | 3.05 | 72.7 | 100 | Low | 1 | 0/1 | SRA |
Overview of evaluated RNA-Seq-based TCR profiling methods’ parameters, publication details and technical characteristics. RNA-Seq-based TCR profiling methods are sorted by the year of publication (indicated in the column ‘Published year’). We documented the name of the methods (indicated in the column ‘Method’), the version of methods that were used in this benchmarking project (indicated in the column ‘Version’), the alignment algorithms (indicated in the column ‘Alignment/Assembly algorithm’), the programming language (indicated in the column ‘Programming language’), the input file type (indicated in the column ‘Input file type’), the types of sequencing data accepted by the method (indicated in the column ‘Types of sequencing data’), the organism accepted by the method (indicated in the column ‘Organism’), the journal that the method was published in (indicated in the column ‘Journal’), the computational tools that the method was compared with in the publication (indicated in the column ‘In the publication compared to’), the method webpage (indicated in the column ‘Method webpage’)
| Method | Version | Alignment/assembly algorithm | Published year | Programming language | Input file type | Types of supported data | Organism | Journal | In the publication compared to | Webpage |
|---|---|---|---|---|---|---|---|---|---|---|
| MiXCR | 3.0.13 | Modified Smith–Waterman and Needleman–Wunsch | 2015 | Java | FASTA, FASTQ, FASTQ[.gz] Paired-end FASTQ[.gz] | AIRR-seq, RNA-seq | Human, mouse, rat | Nature Methods | MiTCR, Decombinator, IgBLAST, IMGT/HighV QUEST | https://mixcr.com |
| ImReP | 1.0 | Not required | 2020 | Python | BAM | RNA-seq | Human, mouse | Nature Communication | MiXCR, IMSEQ, IgBLAST | https://github.com/Mangul-Lab-USC/ImReP |
| CATT | 1.9.1 | BioAlignments | 2020 | Julia | BAM, FASTQ | RNA-seq | Human, mouse, swine | Bioinformatics | MiXCR, IMSEQ, LymAnalyzer, TraCeR, RTCR | http://bioinfo.life.hust.edu.cn/CATT |
| TRUST4 | 1.0.2 | Seed-extension | 2021 | C/C++ | BAM, FASTQ | AIRR-seq, RNA-seq | Human | Nature Methods | MiXCR, CATT, TRUST3 | https://github.com/liulab-dfci/TRUST4 |
RNA-Seq-based TCR profiling methods were able to successfully capture TCRβ low SDI repertoires across various T-cell-rich tissues
First, we have investigated the ability of RNA-Seq-based TCR profiling methods to characterize TCRβ repertoires across different repertoire types and tissue types. The capturing ability of the RNA-Seq-based methods was examined based on the sum of the TCR-Seq confirmed TCRβ clonotypes frequencies that each method was able to capture. Each distinct amino acid sequence was considered as one unique clonotype in the TCRβ repertoire.
The surveyed RNA-Seq-based methods were able to capture 93.2% of clonotypes in T-cell-rich low SDI samples and 76.45% in T-cell-poor low SDI samples on average. The portions of clonotypes that could be captured were much lower in high SDI samples. The results of the portions from each tool were similar across T-cell-rich samples. CATT and TRUST4 had statistically significant higher portions in T-cell-poor high SDI samples than MiXCR (Supplementary Table 3).
In Figure 1, we present the average fraction of cumulative frequencies of assembled TCR clonotypes by RNA-Seq-based methods with clonotype frequency greater than the value shown on the x-axis. Similar to the previous study [16], we observed that MiXCR, TRUST4 and CATT were able to capture all the clonotypes with frequencies above 0.03% in T-cell-rich low SDI samples. All surveyed methods captured all the clonotypes with frequencies above 0.036% in T-cell-rich low SDI samples and clonotypes with frequencies above 2.66% in T-cell-poor low SDI samples (Figure 1A–D). Moreover, they were able to capture all the clonotypes with frequencies above 1.553% in T-cell-rich high SDI samples (Figure 1E–H). However, only TCRβ clonotypes with relatively high frequencies in the T-cell-poor high SDI samples were captured by ImRep, TRUST4 and CATT, but not by MiXCR. Among ImRep, TRUST4 and CATT, TRUST4 and CATT achieved the best performance compared with ImReP in the T-cell-poor high SDI samples, with TRUST4 and CATT being able to capture all the TCRβ clonotypes with frequencies greater than 10.1%, while this threshold was 40.5% for ImReP (Figure 1E–H). One reason that may have caused this was that on average TCRβ-derived reads from RNA-Seq reads in T-cell-poor tissues were much smaller than those in T-cell-rich tissues (4.1 versus 655.3 TCR-derived reads per million RNA-Seq reads) (Supplementary Table 4, Supplementary Table 5, Supplementary Figure 4). The results for individual samples are shown in Supplementary Figure 5.
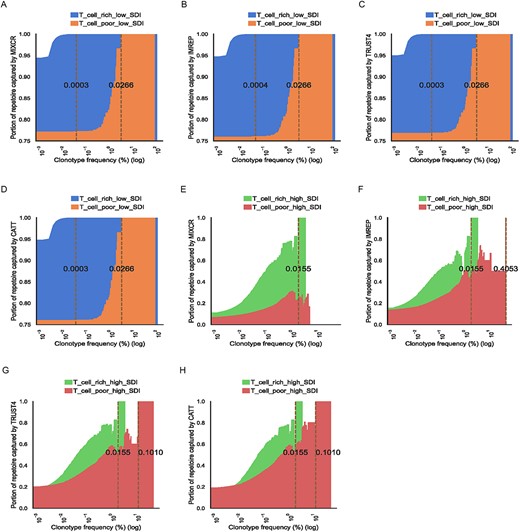
The ability to capture TCR-Seq confirmed clonotypes by RNA-Seq-based methods in low SDI samples (A–D) and high SDI samples (E–H). The x-axis corresponds to TCR-seq confirmed clonotypes with a frequency of Z on a log scale. The y-axis corresponds to the average fraction of assembled TCR clonotypes by RNA-Seq-based methods with clonotype frequency greater than Z across samples. The samples with no clonotype (by RNA-Seq or TCR-Seq) at a given frequency are excluded to compute the average portion. The brown dash lines indicate the minimal clonotype frequency above which all the clonotypes are captured. The numbers on the brown dash lines are the actual values for the threshold. Area plots show the proportion of the TCR clonotypes captured by MiXCR, ImReP, TRUST4 and CATT based on clonotype frequencies. Results from T-cell-rich low SDI samples, T-cell-poor low SDI samples, T-cell-rich high SDI samples and T-cell-poor high SDI samples are shown in blue, orange, green and red, respectively.
We further examined the ability of the surveyed methods to capture the most abundant clonotypes (top 5 and top 10 clonotypes in each sample) in T-cell-rich tissues. MiXCR, TRUST4 and CATT were able to capture the entire set of the top five clonotypes in T-cell-rich low SDI samples, while ImReP was able to capture 93.3% of those clonotypes. For the top 10 clonotypes in T-cell-rich low SDI samples, MiXCR, ImReP, TRUST4 and CATT were able to capture 93.3, 86.7, 96.7 and 93.3%, respectively, while in the T-cell-rich high SDI samples, 68.3% of the top 5 clonotypes and 54.2% of the top 10 clonotypes were captured by these methods on average.
RNA-Seq-based TCR profiling methods were able to effectively estimate clonality in T-cell-rich tissues
We evaluated the ability to effectively estimate the diversity of TCR repertoire by RNA-Seq-based methods. The diversity is estimated by SDI and the absolute error is used to examine the feasibility of the methods to estimate diversity. The differences between the SDI estimated from TCR-Seq results and RNA-Seq TCR-derived results were measured using the absolute error. The average absolute error of diversity estimation from RNA-Seq-based methods compared with TCR-Seq results in T-cell-rich tissues was 2.48. The best performance was achieved by TRUST4 with an absolute error of 2.07. When we compared the absolute error of diversity estimation in different types of repertoires among T-cell-rich samples, all the methods offered more precise diversity estimation in low SDI samples than in high SDI samples. The average absolute error in T-cell-rich low SDI samples was 0.57, while the average absolute error in T-cell-rich high SDI samples was 4.4 (Figure 2A). Notably, MiXCR had the best performance in estimating diversity in low SDI samples but worse performance in high SDI samples (Figure 2A). These tools had similar performance in estimating diversity among low SDI samples (Supplementary Table 6). In contrast to T-cell-rich low SDI samples, all RNA-Seq-based TCR profiling methods showed poor performance in high SDI samples (Figure 2A). Among the T-cell-poor low SDI samples, the average absolute error was 2.23 across the surveyed methods, which was larger than in T-cell-rich low SDI samples (Figure 2A). TRUST4 had statistically significantly better estimation of diversity in both T-cell-rich and T-cell-poor high SDI samples than MiXCR and CATT (Supplementary Table 6). For example, TRUST4 had smaller absolute error of SDI compared with CATT in T-cell-rich high SDI samples (TRSUT4: 3.49, CATT: 5.43, P = 0.041).
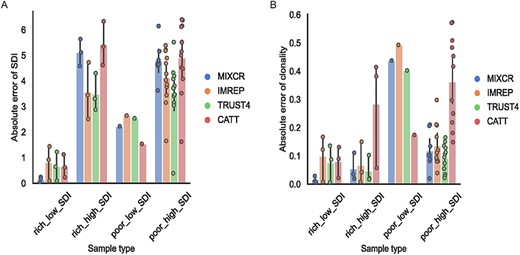
TCR-Seq-based TCRβ and RNA-Seq-based diversity and clonality comparison. (A–B) Bar plot of absolute error between diversity (A) and clonality (B) estimated based on RNA-Seq data and TCR-Seq data in T-cell-rich low SDI samples (rich_low_SDI), T-cell-rich high SDI samples (rich_high_SDI), T-cell-poor low SDI samples (poor_low_SDI) and T-cell-poor high SDI samples (poor_high_SDI). Each dot on the bar represents each sample. The results from MiXCR are represented in blue, the results from ImReP are represented in orange, the results from TRUST4 are represented in green and the results from CATT are represented in red.
T-Cell level and SDI classification can be confounded by each other. For example, T-cell level affects the SDI, especially for high SDI samples. We examined the fraction of the top 10 TCR clonotypes in each sample (Supplementary Table 7). On average, the fraction of the top 10 TCR clonotypes was higher in T-cell-rich tissues than it was in T-cell-poor tissues (49.2 versus 29.87%). Therefore, we also calculated clonality to account for the substantial differences in the number of clonotypes which the SDI does not account for directly. All these methods provided precise estimates of clonality for low SDI samples of T-cell-rich tissues with an average absolute error of 0.0677 (Figure 2B). Among the surveyed methods, MiXCR provided the most precise estimates for both clonality and diversity in T-cell-rich low SDI samples, with average absolute errors of 0.015 and 0.141, respectively. However, these were not statistically different (Supplementary Table 6 and Supplementary Table 8). Different from T-cell-rich tissues, all the survey methods were not able to provide accurate clonality estimates in T-cell-poor tissues, with average absolute errors of 0.184 in high SDI samples and 0.376 in low SDI samples (Figure 2B). MiXCR and TRUST4 provided statistically more accurate clonality estimates in T-cell-poor high SDI samples than CATT (Supplementary Table 8). In addition, we observe consistent estimates of diversity and clonality across different SDI thresholds to classify low or high SDI samples (Supplementary Table 9).
In addition, we investigated the ability of RNA-Seq-based methods to accurately estimate the diversity and clonality when singleton (clonotypes supported by a single read) TCRs were included. The presence of singletons in the sample decreases the accuracy of estimation for all methods. The average absolute error of SDI in T-cell-rich tissues across all methods was slightly higher than the samples excluding singleton TCRs, with values of 2.67 and 2.48, respectively. Similar to the samples excluding singleton TCRs, the surveyed methods provided reliable estimates of diversity in T-cell-rich low SDI samples (Supplementary Figure 6a). Except for CATT, other methods (MiXCR, ImRep and TRUST4) had precise clonality estimates in T-cell-rich tissues regardless of repertoire types (Supplementary Figure 6b).
Furthermore, we have employed the Hill curves to access a broad spectrum of diversity metrics, allowing systematically examining the ability of RNA-Seq-based methods to accurately estimate the TCR diversity of a sample. Hill curves approach [22] represents an array of diversity indices corresponding to various q values using different diversity metrics (Supplementary Table 10). These diversity metrics include the exponential of the SDI (when q value is 1) and the inverse Simpson index (when q value is 2). Hill curves simultaneously account for the total number of clonotypes and expansion of the clonotypes [23]. As the q value increases, the clonotypes with high relative abundance have a larger contribution to the overall diversity estimates. We have used pyTCR [24] to compute and plot the Hill curves. To evaluate the ability of RNA-Seq-based methods to accurately estimate the TCR diversity, we have compared the RNA-Seq-based diversity estimates across various q values to the diversity estimates based on TCR-Seq results, of which the latter was considered the gold standard. The closer the estimates to the TCR-Seq-based results, the more accurate the diversity estimates were considered. According to all diversity metrics provided by Hill curves, RNA-Seq-based methods provided the most accurate estimates of TCR diversity for T-cell-rich low SDI samples compared with other tissue types and repertoire types (Supplementary Figure 7a–c). We noticed that RNA-Seq-based methods overestimated the diversity of TCR repertoires when the q value was 1 in low SDI samples, and the estimations were more precise when q values were greater than 1 (Supplementary Figure 7a–d). Even though the absolute errors of SDI estimates were relatively small in low SDI samples, the exponential of the SDI (corresponds to the diversity estimate when the q value is 1) may exaggerate the differences between diversity estimates. For high SDI samples, RNA-Seq-based profiling methods underestimated the diversity regardless of the q values or tissue types (Supplementary Figure 7e–s).
Even though these methods captured much fewer clonotypes compared with TCR-Seq results in T-cell-rich high SDI samples, if the clonotype counts were taken into account by calculating clonality, these methods were able to offer comparable clonality estimates in T-cell-rich high SDI samples as they were in T-cell-rich low SDI samples, with absolute errors of 0.113 and 0.068, respectively.
RNA-Seq-based TCR profiling methods were able to successfully estimate relative frequencies of clonotypes in low SDI samples
Although differences in diversity and clonality estimates were observed, we further examined whether the surveyed methods were able to provide accurate estimates of the frequency of assembled clonotypes in different types of repertoires. The results showed that all four RNA-Seq-based methods accurately estimated the relative frequencies in low SDI samples (Figure 3A–H), especially in T-cell-rich tissues (MiXCR: r = 1, P < 0.001; ImReP: r = 0.9999, P < 0.001; TRUST4: r = 0.9999, P < 0.001; CATT: r = 0.9999, P < 0.001). MiXCR had the best linear correlation between RNA-Seq-based clonotype frequencies and TCR-Seq-based clonotype frequencies compared with other methods. The linear correlations between the clonotype frequencies measured by TCR-Seq and RNA-Seq in T-cell-rich low SDI samples are shown in Supplementary Figure 8. In addition, the clonotype frequencies between results from TCR-Seq and from RNA-Seq were positively correlated in T-cell-rich high SDI samples (MiXCR: r = 0.7942, P = 7.3e−85; ImReP: r = 0.7335, P < 0.001; TRUST4: r = 0.7205, P < 0.001; CATT: r = 0.8226, P = 3.1e−245) (Figure 3I–L). When comparing the clonotype frequencies in T-cell-poor high SDI samples, the positive correlations were weaker compared with other tissue and repertoire types (MiXCR: r = 0.7334, P = 4.2e−28; ImRep: r = 0.5225, P = 6.6e−23; TRUST4: r = 0.5859, P = 3e−48; CATT: r = 0.518, P = 4.6e−27) (Figure 3M–P).
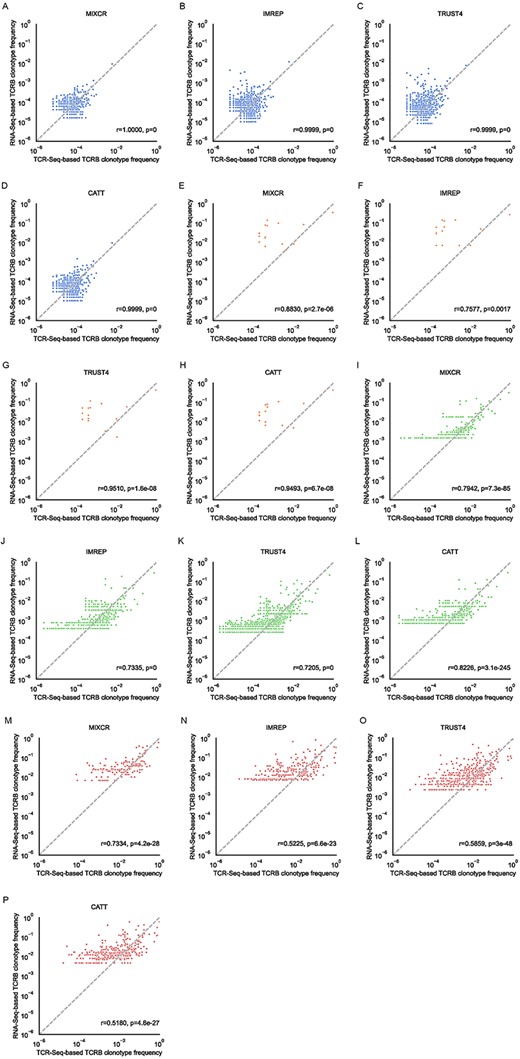
Correlation of TCRβ clonotype frequency based on the TCR-Seq data (x-axis) and the TCR-derived reads from RNA-seq (y-axis). Only clonotypes assembled from both TCR-Seq and RNA-Seq data are presented. The clonotype frequencies are renormalized to only the set of clonotypes in the TCR-Seq and RNA-Seq repertoire space. The clonotype frequencies are log-transformed. Pearson correlation coefficients and the corresponding P-values are calculated and reported. (A–D) The results of T-cell-rich low SDI samples (blue). (E–H) The results of T-cell-poor low SDI samples (orange). (I–L) The results of T-cell-rich high SDI samples (green). (M–P) The results of T-cell-poor high SDI samples (red).
We also examined the scenario when singleton TCRs were included in the samples. In this case, the correlations between RNA-Seq-based frequencies and TCR-Seq-based frequencies were similar to the cases when singleton TCRs were filtered out (Supplementary Figure 9). Furthermore, we noticed that including singletons had a positive effect on the ability to estimate clonotype frequencies in T-cell-rich high SDI samples (MiXCR: r = 0.908, P < 0.001; ImReP: r = 0.8857, P < 0.001; TRUST4: r = 0.9121, P < 0.001; CATT: r = 0.9263, P < 0.001) (Supplementary Figure 9i–l).
These findings suggested that all surveyed RNA-Seq-based methods were able to provide accurate estimations of relative frequencies of the detected clonotypes in low SDI samples, while the positive correlations were weaker in high SDI samples. CATT provided the best result in the correlation of clonotypes in T-cell-rich high SDI samples than those provided by other methods.
Fewer clonotypes were detected by RNA-Seq-based TCR profiling methods compared with TCR-Seq-based methods
Next, we compared the number of clonotypes detected by RNA-Seq-based methods compared with TCR-Seq-based methods. On average, TRUST4 captured the most clonotypes among four RNA-Seq-based methods with 4451 in T-cell-rich low SDI samples and 1038 in T-cell-rich high SDI samples, while MiXCR had the lowest with 1723 in T-cell-rich low SDI samples and 145 in T-cell-rich high SDI samples (Supplementary Figure 10a). The clonotype counts detected by MiXCR were statistically significantly smaller than the clonotype counts detected by other methods in T-cell-rich low SDI samples (Supplementary Table 11). When we considered the absolute count of the TCR-Seq confirmed clonotypes, TRUST4 had the largest number of clonotypes confirmed by TCR-Seq, while MiXCR had the lowest (Supplementary Figure 10b). For example, on average, TRUST4 detected 538 TCR-Seq confirmed clonotypes and MiXCR only detected 317 in T-cell-rich low SDI samples. However, these results were not statistically different when compared across tools (Supplementary Table 12). These TCR-Seq confirmed clonotypes were highly overlapped across the survey methods in T-cell-rich low SDI samples compared with high SDI samples (Supplementary Figure 10c–f). However, when we considered the fraction of validated TCRs from RNA-Seq-based methods when varying clonotype abundance thresholds, ImRep and TRUST4 captured all the hyperexpanded clonotypes in T-cell-rich low SDI samples. MiXCR had the highest percentage of detecting large clonotypes in all samples. CATT had the lowest fractions of TCR-Seq confirmed hyperexpanded and large clonotypes in the majority of the tissue types and repertoire types (Supplementary Figure 10g–j). Combined with our findings above, these results suggested that ImRep, TRUST4 and CATT were able to detect more clonotypes and TCR-Seq confirmed clonotypes than MiXCR in T-cell-rich tissues. However, CATT had higher portions of the detected hyperexpanded and large clonotypes that were not confirmed by TCR-Seq than all other surveyed methods in T-cell-rich tissues and T-cell-poor high SDI samples.
The effect of the number of TCR-derived reads on the performance of RNA-Seq-based TCR profiling methods
We examined how the number of receptor-derived reads from RNA-Seq data influences the diversity estimates and capturing ability of the RNA-Seq-based methods. TCR-derived reads were calculated by the total number of TCR reads matching the assembled clonotypes detected by RNA-Seq-based TCR profiling methods. To investigate the effect of TCR-derived reads, we subsampled the RNA-Seq TCR-derived reads from the original to 310, which represents the average TCR-derived reads in T-cell-poor tissues, based on the original RNA-Seq assembled TCR clonotype frequencies obtained from surveyed methods in three T-cell-rich low SDI samples. We first measured the ability of RNA-Seq-based methods to estimate the diversity among these computationally modified samples by using the SDI. The results indicated that an increased number of TCR-derived reads resulted in a more precise diversity estimate (Supplementary Figure 11a).
We then investigated the portion of repertoire captured by these methods depending on the number of TCR-derived reads presented in the sample. As the number of receptor-derived reads decreases, the methods were more likely to miss the clonotypes with low abundance. For example, all TCRβ clonotypes with frequencies above 0.094% were captured across all four surveyed methods when the number of TCR-derived reads was 310 (Supplementary Figure 11b–e), while, without reducing TCR-derived reads, all TCRβ clonotypes with frequencies greater than 0.045% were captured. The fact that the surveyed methods failed to detect low abundant clonotypes also contributed to the reduced accuracy in estimating diversity with the reduced number of TCR-derived reads.
The effect of read length on the performance of RNA-Seq-based TCR profiling methods
We investigated the effect of RNA-Seq read length on the ability of RNA-Seq-based methods to characterize the TCR repertoires by measuring the portion of clonotypes that can be captured as well as diversity estimates. The length of RNA-Seq read was computationally reduced to 50 and 75 bp for PBMC samples. We were able to generate results from MiXCR, ImRep and TRUST4 with reduced read length; however, CATT failed to produce the result for one 50 bp T-cell-rich low SDI sample.
RNA-Seq-based methods were able to capture the majority of the clonotypes in T-cell-rich low SDI samples even with the reduced read length (Supplementary Figure 12a–d). Except for CATT, other methods captured at least 91.8% of the clonotypes regardless of the read length that we examined in T-cell-rich low SDI samples. MiXCR, ImRep and TRUST4 captured all the clonotypes with clonotype frequencies greater than 0.094% when the RNA-Seq samples had 50 bp read length in T-cell-rich low SDI samples, which this threshold was 0.036% with the original read length of 150 bp. The portions of TCR clonotypes that can be captured were similar in T-cell-rich low SDI samples among all read lengths by MiXCR, ImRep and TRUST4. However, such portions dropped substantially with reduced read length in high SDI samples (Supplementary Figure 12e–h). Only MiXCR captured all abundant clonotypes with reduced read lengths in T-cell-rich high SDI samples. Furthermore, when we examined the diversity estimate in the reduced read length samples, we noticed that the diversity estimates were only reliable in T-cell-rich low SDI samples with reduced read length with an average absolute error of 0.58 in 50 bp read length samples and 0.48 in 75 bp read length samples (Supplementary Figure 12i). In T-cell-rich high SDI samples, the accuracy of estimating diversity was worse. The absolute error decreased with an increased RNA-Seq read length in ImReP results, whereas the accuracy was similar between MiXCR results from 75 to 150 bp (Supplementary Figure 12j). Selected RNA-Seq-based TCR profiling methods provided reliable results in T-cell-rich low SDI samples across a variety of sequencing parameters.
Complement the TCRβ chain analysis with TCRα chain analysis
TCR-Seq requires separate library preparation and sequencing for α and β chains, while RNA-Seq can capture all four TCR chains (α, β, γ and δ chains) at the same time with single library preparation and sequencing. We compared the results for the TCRα chain with the TCRβ chain across different tissue types and repertoire types. However, we have determined that delta and gamma chains did not have enough reads to be reliably profiled.
First, we compared the number of TCRα- and TCRβ-derived reads from RNA-Seq. Except for CATT, the average number of TCRα chain reads derived from RNA-Seq was higher than the number of TCRβ chain reads derived from RNA-Seq in T-cell-rich low SDI samples, while there were more reads from β chains than α chains in T-cell-rich high SDI samples (Supplementary Figure 13a and b). The number of TCRα- and TCRβ-derived reads was highly positively correlated in T-cell-rich low SDI samples across MiXCR, ImRep and TRUST4, but not CATT (MiXCR: r = 0.9998, P = 0.013; ImReP: r = 0.9956, P = 0.06; TRUST4: r = 0.9855, P = 0.11; CATT: r = 0.549, P = 0.63).
Next, we compared the number of TCRα and TCRβ clonotypes. Similar results were observed that more TCRα and TCRβ clonotypes were captured by RNA-Seq-based methods in low SDI samples than in high SDI samples among T-cell-rich tissues (Supplementary Figure 13c and d). Other than CATT, the number of clonotypes from α and β chains was comparably similar across repertoire types by RNA-Seq-based methods. All methods provided highly similar numbers of TCRα and TCRβ clonotypes in T-cell-rich tissues. In addition, the clonotype count correlations estimated by MiXCR and TRUST4 were highly positive in T-cell-poor high SDI samples.
Performance of RNA-Seq methods in the samples from healthy individuals
To examine whether the RNA-Seq-based TCR profiling methods perform differently between cancer and non-cancer RNA-Seq samples, we performed the same analyses as described above on 10 PBMC samples from healthy individuals (Supplementary Table 13). Based on the SDI values and predicted T-cell levels, these samples were classified as T-cell-rich high SDI samples (Supplementary Figure 14). All four methods captured the clonotypes with frequencies above 2.39% (Supplementary Figure 15). The metrics were calculated and compared (Supplementary Figures 16–19); these showed similar results to those from samples from cancer patients.
Computational resources comparison across RNA-Seq-based tools
We compared the run time and required computational resources across MiXCR, ImRep, TRUST4 and CATT. We selected four samples with RNA-Seq reads ranging from 40 524 817 to 122 632 451 and recorded the central processing unit (CPU) time and memory usage for each tool to process these samples. In general, ImRep and TRUST4 had shorter processing time compared with MiXCR and CATT (Supplementary Figure 20a). TRUST4 required the least amount of memory across the samples we tested (Supplementary Figure 20b).
DISCUSSION
TCR-Seq is a powerful tool to profile TCR repertoires, gain novel insight into immunological phenomena and serve as a biomarker for immunotherapy efficacy. However, such technology is cost prohibitive in clinical cohorts and is often unable to be routinely applied in such settings [25]. In contrast, RNA-Seq is becoming a default technology to profile patient tissues in clinical pathology [26]. By utilizing an RNA-Seq approach to characterize the presence and relative frequency of TCR sequences within a given blood sample or T-cell-rich tissue sample, clinical samples can be more efficiently utilized without the need for additional dedicated sequencing experiments using TCR-Seq.
This study is the first one to benchmark the performance of RNA-Seq-based TCR profiling methods in both T-cell-rich and T-cell-poor tissues across the largest number of clinical samples. Although the previous study only included a certain type of TCR repertoire [16], we expanded the examination to a broad range of cancer tissue types and repertoire types. The repertoire category is highly relevant to the biological features of a sample. A low SDI sample is more predominated by one or a few TCR clonotypes. Such type of clonotype presentation is often observed in transgenic TCR cell therapies, where a TCR of interest has been inserted into a T cell via retroviral or lentiviral vectors, for the treatment of cancer or viral infections, or in situations where only a few TCR clonotypes are preferentially expanded in the setting of targeting cancer or viral antigens, thus reflecting their relative biological importance in a given sample. Conversely, a high SDI sample would be more reflective of circulating T cells which are not subject to the stressors of chronic antigen exposure, or tumor samples which have T-cell infiltrates directed at a wider variety of tumor neoantigens, which are diverse and unique to a given patient or individual tumor.
We determined the scenarios under which RNA-Seq analysis using RNA-Seq-based TCR profiling methods can offer a comparable quality of characterizing immune repertoires. Given tissue with a sufficient degree of T-cell level and with one or a few hyperexpanded clonotypes made up for the whole repertoires, and with adequate RNA sequencing depth and satisfactory quality, RNA-Seq-based TCR profiling methods are able to capture the majority of TCRβ clonotypes and effectively estimate the diversity of the repertoire. Despite the inability of RNA-Seq-based TCR profiling methods to capture the ultra-rare clonotypes supported by several TCR-Seq reads, these methods are generally able to capture the clonotypes with a frequency greater than 1.553% in T-cell-rich tissues. This suggests that RNA-Seq can potentially complement TCR-Seq technology in T-cell-rich tissues to successfully estimate the overall diversity of the sample and effectively detect clones with greater frequencies. The diversity estimated based on high-throughput measures usually underestimates true diversity [2, 5, 27, 28], but in cases where there is a major clonotype existing with high relative frequency than even capturing the small portion of the repertoire, one can estimate the diversity. However, when comparing different samples, the commonly used diversity measurement, SDI, is limited when comparing samples with different TCR repertoire sizes. On the other hand, clonality, which normalizes clonotype counts based on SDI, can be an appealing approach to estimate diversity [29].
In more heterogeneous tissues which are more relatively T-cell-poor tissues, such as tumor biopsies, RNA-Seq-based TCR profiling methods are only able to capture the dominant clonotypes with the highest frequencies. This results in unreliable estimates of diversity and clonality in such tissues. These suggested that extra caution needs to be taken when utilizing RNA-Seq-based TCR profiling methods in T-cell-poor tissues, especially in high SDI samples of the T-cell-poor tissues.
The ability to effectively characterize the TCR repertoire depends on the proportion of the total repertoire captured by a given technology. Even state-of-the-art high-throughput technologies fail to capture the entire diversity of the T-cell repertoire. Instead, they often focus on capturing the most common clones, as this is often sufficient to effectively characterize TCR diversity. Identification of dominant TCR clones within responding patient biopsies can be useful for the characterization of potential neoantigens being targeted by the TCRs. Capturing rare clones is extremely challenging due to the enormous diversity of the individual T-cell repertoire and the limited throughout of commercially available TCR-Seq protocols. As a result, rare clones can become unsampled and remain undetected in high-throughput measurements of the samples. This may lead to the missing of important TCR information in some autoimmune disease settings, such as autoimmune hepatitis [30] and patients with Sjögren’s syndrome [31]. In these diseases, clonotypes with low frequencies may relate to disease activity. In other disease settings, such as myelodysplastic syndrome, responsiveness to treatment with hypomethylating agents has been associated with rare and novel TCR clonotypes which manifest during treatment [32].
Diversity is measured based on the clonotypes that are present in the sequencing results and their relative frequencies. The surveyed methods are able to provide reliable diversity estimates in T-cell-rich low SDI samples but not so in high SDI samples. On average, the absolute errors of estimating diversity in different types of samples range from 0.57 to 4.4. As expected, the number of clonotypes and derived reads detected by RNA-Seq-based methods are always lower than those from TCR-Seq. Clonotypes with low frequencies are not captured by the RNA-Seq-based methods; this may have caused a systematic underestimated error in estimating diversity. In addition to the undetected clonotypes with low abundance, the differences in clonotype frequency estimation as well as in the number of detected clonotypes could be the reasons that cause differences in the accuracy of diversity estimates between various tissue types and repertoire types.
There are a few limitations of our study. First, there is no standardized method to distinguish between low SDI and high SDI TCR repertoires. We chose the SDI value of 2 as the threshold which represents the distribution of clonotypes in the samples that we used in the study. We explored various SDI thresholds to classify low or high SDI samples and observed consistent estimates of clonality and diversity across various thresholds. Second, the TCR-Seq sequencing protocols that were used were not consistent across different study cohorts. The lymph node and small intestine samples were sequenced by rapid amplification of 5′ complementary ends (5′RACE) approach, while all other samples were sequenced by immunoSEQ (Adaptive Biotechnology, Seattle, WA). The biases across multiplex PCR and 5′RACE are known [33, 34]; however, the differences between immunoSEQ and other TCR-Seq profiling methods were unknown. Third, TCR-Seq computational methods used for processing were different across study cohorts as well. TCR-Seq raw data from lymph node and small intestine samples were processed through MiXCR, while the others were processed via internal methods at Adaptive Biotechnology. Unfortunately, Adaptive Biotechnology does not share raw TCR-Seq data or bioinformatics methods [35], so we were not able to process all samples through the same bioinformatics software. The use of MiXCR for processing both TCR-Seq and RNA-Seq on lymph node and small intestine samples may lead to biases in the results. Fourth, TCR-derived reads corresponded to T-cell levels. However, RNA-Seq-based TCR profiling methods may also detect natural killer (NK) cells. Although NK cells were relatively rare compared with T cells, they could be added to the number of T cells that were deduced from the TCR reads. By utilizing GEDIT, we observed values of zeros in several samples, which may not indicate that there were no T cells in the samples; instead, these samples had low expressions which were below the detection limit. Fifth, the distribution of the samples is heavily biased toward T-cell-poor high SDI samples compared with other categories. The comparison between sample types with different numbers of samples may lead to over- or underestimating the differences in the results. Sixth, only two types of cancer were included in this study, which were melanoma and kidney renal clear cell carcinoma. The conclusions from different types of cancers are inherently biological-context dependent. Further validation is needed if more TCR-Seq and RNA-Seq data on the same samples become available. Last, we observed that there were TCR clonotypes discovered by RNA-Seq-based profiling methods that were not confirmed by TCR-Seq. These may be false positives of RNA-Seq-based methods or false negatives of the TCR-Seq method which are true TCR clonotypes that are not captured by TCR-Seq. However, the benchmarking approach used in this project is incapable of differentiating between false positives of RNA-Seq-based methods and false negatives of the TCR-Seq method. The presence of false positives in the results of RNA-Seq-based methods may limit the application of RNA-Seq-based TCR profiling in clinical settings.
Although available approaches require separate assays for the detection of the α and β chains of the TCR, RNA-Seq-based TCR profiling methods are able to detect both α and β chains simultaneously from a single library preparation, reducing the overall cost of the assay. With the increasing emphasis on personalized medicine, there is an increasing demand for cost-effective and reproducible measures to comprehensively characterize cancer cells and profile immune cell populations. This technique can be employed in large-scale clinical cohorts. Furthermore, the detection of TCR sequences at the RNA level provides increased assurances that such sequences are transcriptionally active and more likely to be biologically relevant. It also provides opportunities to reuse the existing RNA-Seq data instead of initiating new TCR-Seq. Finally, RNA-Seq has already been used in clinical specimens and provides an additional analysis tool for use on a variety of clinical samples. Overall, RNA-Seq-based methods are appealing alternatives for profiling TCR repertoires in T-cell-rich tissues and low SDI samples when TCR-Seq is not yet available.
METHODS
Gold standard datasets
PBMCs (N = 5) and melanoma biopsy samples (N = 9) were generated from patients at UCLA enrolled in transgenic NY-ESO-1 TCR adoptive cell therapy (IRB#12-000153 and 13-001624) [17] and PD-1 blockade clinical trials (IRB#11-003066) [12], as previously described. The studies were conducted in accordance with local regulations, the guidelines for Good Clinical Practice and the principles of the Declaration of Helsinki. Renal clear cell carcinoma (N = 3) [18] samples were acquired from The Cancer Genome Atlas (TCGA), and melanoma specimens from the ileocecal lymph node (N = 1) and the small intestine (N = 1) [16] were acquired from the Sequence Read Archive (SRA). For the PBMC samples, three were from patients that were transduced with a retroviral vector containing the NY-ESO-1 TCR [17], while another two were from patients being treated for melanoma [12]. The average number of RNA-Seq reads ranged from 66 to 88.3 million. The average numbers of TCR-Seq reads ranged from 0.01 to 3.26 million reads (Table 1, Supplementary Table 1, Supplementary Figure 1a and b). The number of clonotypes detected by TCR-Seq varied across different tissue types. Kidney samples had the lowest average number of clonotypes (1917) in the tissue samples analyzed. Note that the lymph node sample has an extremely high number of TCRβ clonotypes (202 869) compared with all other samples (Supplementary Figure 1c). Importantly, the cohorts we used correspond to various tissue types with substantially different levels of T cells and repertoire types. We computationally estimated the T-cell levels across all samples by GEDIT [19]. Samples with high levels of T cells were from PBMCs and lymph nodes, which were considered T-cell-rich tissues, while low levels of T cells were the samples from the renal cells, small intestine and melanoma biopsies, which were considered as T-cell-poor tissues.
We used SDI to classify TCR repertoires as low SDI or high SDI samples. The minimal value of SDI is 0, which value closer to 0 corresponds to the increased monoclonality of the TCR population. The three PBMC samples that were transduced with a retroviral vector containing the NY-ESO-1 TCR [17] and one melanoma biopsy sample were low SDI samples, while all other samples were high SDI samples. In our dataset, the clonotypes with frequencies greater than 0.01 (hyperexpanded clonotypes), which usually consisted of only one or a few TCRβ clonotypes, on average comprised 91.08% of all TCRβ clonotypes in low SDI samples, while the hyperexpanded clonotypes only comprised 24.36% of all TCRβ clonotypes in high SDI samples (Supplementary Figure 3).
Choice of RNA-Seq-based TCR profiling methods
MiXCR supports various sequencing technologies, while ImReP, TRUST4 and CATT are designed mainly for RNA-Seq data (Table 2). The input format varied across tools: MiXCR requires RNA-Seq raw reads, ImReP accepts only aligned reads, and TRUST4 and CATT accept both raw reads and aligned reads. The details on how the RNA-Seq-based methods were run are available in Supplementary Table 2.
Isolate genomic DNA and RNA
Genomic DNA and RNA from patient-derived transgenic NY-ESO-1 TCR PBMCs and normal control PBMCs [17] were isolated with an AllPrep DNA/RNA isolation kit according to the manufacturer’s instructions (Qiagen). For patient melanoma biopsies treated with anti-PD-1 blockade [12], genomic DNA was isolated from formalin-fixed, paraffin-embedded tumor biopsy shavings on an Anaprep 12 nucleic acid extraction platform (BioChain), while RNA was isolated from tumor samples which had been preserved in RNAlater (Qiagen) and stored at −80°C using an AllPrep RNA Isolation kit, as above. Melanin was then removed from visibly pigmented samples using a PCR Inhibitor Removal kit (Zymo Research, Irvine, CA).
Generate DNA-based TCR-Seq data
TCRβ alleles were sequenced at 100 000 reads by Adaptive Biotechnologies. Briefly, this process utilizes a synthetic immune repertoire, corresponding to every possible biological combination of Variable (V) and Joining (J) gene segments for each TCR locus, spiked into every sample at a known concentration. These inline controls enable rigorous quality assurance for every sample assayed and allow for correction of multiplex PCR amplification bias, providing an absolute quantitative measure of T cells containing the transgenic TCR relative to the other endogenous TCR clonotypes, with no difference in amplification efficiency [36]. Productive TCRβ sequences i.e. those that could be translated into open reading frames and did not contain a stop codon, were reported.
Analyze PBMC and melanoma biopsy TCR-Seq data
The assembled CDR3 sequences and corresponding VDJ recombinations were obtained from Adaptive Biotechnologies. We have only considered clones supported by at least two reads.
Only full-length clonotypes (starting with C and ending with F) were considered. Other clonotypes were filtered out.
RNA-Seq of PBMC and melanoma biopsy samples
For both PBMC and melanoma biopsy samples, mRNA libraries were generated using the Kapa Stranded mRNA kit (Roche) and were subjected to 150 bp paired-end sequencing (PBMCs) or 100 bp paired-end sequencing (melanoma biopsies) on a HiSeq 3000 platform.
Download renal carcinoma clear cell samples
We used RNA-seq data from the TCGA that correspond to three renal carcinoma clear cell samples sequenced by RNA-Seq and TCR-Seq. RNA-Seq data are from Illumina HiSeq sequencing of 50 bp paired-end reads. We downloaded the mapped and unmapped reads in BAM format from the TCGA portal (TCGA-CZ-5463-01A, TCGA-CZ-5985-01A, TCGA-CZ-4862-01A). The corresponding TCR-Seq data were downloaded from immuneACCESS portal (https://clients.adaptivebiotech.com/pub/Liu-2016-NatGenetics).
Download ileocecal lymph node and small intestine samples
We downloaded the RNA-Seq data of one sample of melanoma specimens from the ileocecal lymph node (SPX6730, run: SRR5233639) and another sample of melanoma specimens from the small intestine (SPX8151, run: SRR5233637) from SRA (accession: PRJNA371303). The corresponding TCR-Seq data were downloaded from https://figshare.com/articles/dataset/Antigen_receptor_repertoires_profiling_from_RNA-Seq/4620739?file=9787642.
Run RNA-Seq-based repertoire profiling tools
RNA-Seq-based repertoire profiling tools were run using the directions provided by each of the respective tools. Wrappers were then prepared to run each of the respective tools as well as create standardized log files. When running the tools, we have chosen the most appropriate parameters. For MiXCR, we used the single analyze shotgun command. MiXCR accepts the raw fastq files as input for generating a report of the clonotypes present within the sample. Starting with the RNA sequence data, we mapped the reads onto the human chromosome to generate the bam file. Together with the bam file and the indexed bam file generated from samtools, we ran ImReP, TRUST4 or CATT to extract TCR clonotypes and corresponding supporting reads. The computational pipeline to compare RNA-Seq-based repertoire profiling methods with the gold standard is open source, free to use under the MIT license and available at https://github.com/Mangul-Lab-USC/TCR-profiling-benchmark.
Estimate TCR diversity and relative frequency
To estimate the diversity within each sample, we only consider clonotypes that are supported by at least two reads. The relative frequency of each clonotype is then calculated as the number of supporting reads divided by the total number of reads supporting all clonotypes that occur at least twice.
SDI:
Clonality:
pi = frequency of clonotype i.
n = number of unique clonotypes in the sample.
Classify T-cell-rich and T-cell-poor tissues
We first ran Salmon [37] to quantify transcript levels from RNA-Seq data with the reference transcriptome for Homo sapiens. Then, we used the Ensembl Human genes (GRCh38.p13) as the reference. When converting transcript expression levels to gene expression levels, the isoform with the highest expression transcript was used. Later, we ran the GEDIT [19] v2.0 to estimate the T-cell fraction in each sample. Based on the recommendation of the benchmarking results [38], the Human Skin Signatures matrix was used as the reference in our study. We estimated the T-cell fraction as the sum of fractions of CD3, CD4 and CD8 cells. Samples with estimated T-cell fractions greater than 0.05 are considered from T-cell-rich tissues, otherwise from T-cell-poor tissues.
Generate Hill curves
We have used Hill curves functionality provided by pyTCR [24] to estimate TCR diversity and generate Hill curves. We computed the diversity estimates when q values varied from 1 to 6 across different RNA-Seq-based TCR profiling methods.
Computationally modify the properties of RNA-Seq samples
To reduce the length of RNA-Seq reads, we split each original sequence (150 bp) from the raw fastq files into two and three segments and got new 75 and 50 bp sequences. The sequences were written into new fastq files. We also computationally reduced the number of TCR-derived reads to generate in silico samples based on the T-cell-rich low SDI samples. The clonotypes that can be detected by the RNA-Seq-based methods were randomly selected, in proportion to the original clonotype frequency in the samples. The total numbers of TCR-derived reads from each tool were reduced to around 310, 1300, 2600, 13 500 and 28 000.
Additional dataset from healthy individuals
Ten samples from PBMC samples collected from healthy individuals were sequenced by TCR-Seq via 5′RACE with unique molecular identifiers and RNA-Seq technologies. The use of human materials was approved by the Office for the Protection of Research Subjects at the University of Southern California (IRB#HS-16-00274). TCR-Seq data were processed with MiXCR for clonotype identification and quantification. The overview of the additional dataset is recorded in Supplementary Table 13.
Compare computational resources across RNA-Seq-based repertoire profiling tools
We ran MiXCR, ImRep, TRUST4 and CATT separately on four selected samples (sample02, sample05, sample13, TCGA-CZ-5463). The CPU time and RAM usage were recorded. A high-performance computing cluster was utilized to acquire the results. We set up the bash file by one node, eight cores per node, and 16 GB Memory Efficiency for each run. The CPU time was recorded in seconds and the RAM was computed in gigabytes (GB).
RNA-Seq-based TCR profiling methods are able to effectively capture the majority of TCR-Seq confirmed clonotypes in low SDI samples
RNA-Seq-based TCR profiling methods are able to accurately estimate the diversity and clonality of the repertoire in T-cell-rich low SDI samples
RNA-Seq-based methods are appealing alternatives for profiling TCR repertoires in T-cell-rich tissues and low SDI samples when TCR-Seq is not yet available
Extra caution needs to be taken when utilizing RNA-Seq-based TCR profiling methods in T-cell-poor high SDI samples
ACKNOWLEDGEMENTS
The authors acknowledge the Center for Advanced Research Computing (CARC) at the University of Southern California for providing computing resources that have contributed to the research results reported within this publication. URL: https://carc.usc.edu.
FUNDING
K.P. and S.M. are supported by the National Science Foundation grants 2041984 and 2135954, and National Institutes of Health grant R01AI173172. T.S.N. is supported by the National Institutes of Health grant K08 CA241088 and the Hyundai Hope on Wheels Hope Scholar Award.
CODE AVAILABILITY
All code required to produce the figures and analysis performed in this paper is freely available at https://github.com/Mangul-Lab-USC/TCR-profiling-benchmark.
DATA AVAILABILITY
All RNA-Seq data used in the paper are available on Sequence Read Archive (SRA) or The Cancer Genome Atlas (TCGA) portal. RNA-Seq data for five PBMC samples are available in SRA (BioProject ID: PRJNA812076). RNA-Seq data for three renal carcinoma clear cell samples are available in the TCGA portal (TCGA-CZ-5463-01A, TCGA-CZ-5985-01A, TCGA-CZ-4862-01A). RNA-Seq data for one sample of melanoma specimens from the ileocecal lymph node are available in SRA (SPX6730, run: SRR5233639) and another sample of melanoma specimens from the small intestine are available in SRA (SPX8151, run: SRR5233637). TCR-Seq data for three renal carcinoma clear cell samples are available at https://clients.adaptivebiotech.com/pub/Liu-2016-NatGenetics, and TCR-Seq data for one sample of melanoma specimens from the ileocecal lymph node and another sample of melanoma specimens from the small intestine are available at https://figshare.com/articles/dataset/Antigen_receptor_repertoires_profiling_from_RNA-Seq/4620739?file=9787642.
DECLARATION OF INTERESTS
T.S.N. has received honoraria from consulting with Allogene Therapeutics, PACT Pharma and Adaptive Biotechnologies. K.M.C. receives consulting fees from PACT Pharma and Tango Therapeutics, and is a shareholder in Geneoscopy LLC. A.R. has received honoraria from consulting with Amgen, Bristol-Myers Squibb, Chugai, Genentech, Merck, Novartis, Roche and Sanofi; is or has been a member of the scientific advisory board and holds stock in Advaxis, Arcus Biosciences, Bioncotech Therapeutics, Compugen, CytomX, Five Prime, FLX-Bio, ImaginAb, Isoplexis, Kite-Gilead, Lutris Pharma, Merus, PACT Pharma, Rgenix and Tango Therapeutics; and has received research funding from Agilent Technologies and Bristol-Myers Squibb through Stand Up to Cancer.
All analysis and results presented in this manuscript belong to the authors alone, and not any companies from which they received research funding or consulting fees. All authors have no other relationships or activities that may influence the results of this manuscript.
REFERENCES
Author notes
Kerui Peng and Theodore S. Nowicki contributed equally to this work.
