


Abstract
Protein–deoxyribonucleic acid (DNA) interactions are important in a variety of biological processes. Accurately predicting protein-DNA binding affinity has been one of the most attractive and challenging issues in computational biology. However, the existing approaches still have much room for improvement. In this work, we propose an ensemble model for Protein-DNA Binding Affinity prediction (emPDBA), which combines six base models with one meta-model. The complexes are classified into four types based on the DNA structure (double-stranded or other forms) and the percentage of interface residues. For each type, emPDBA is trained with the sequence-based, structure-based and energy features from binding partners and complex structures. Through feature selection by the sequential forward selection method, it is found that there do exist considerable differences in the key factors contributing to intermolecular binding affinity. The complex classification is beneficial for the important feature extraction for binding affinity prediction. The performance comparison of our method with other peer ones on the independent testing dataset shows that emPDBA outperforms the state-of-the-art methods with the Pearson correlation coefficient of 0.53 and the mean absolute error of 1.11 kcal/mol. The comprehensive results demonstrate that our method has a good performance for protein-DNA binding affinity prediction.
Availability and implementation: The source code is available at https://github.com/ChunhuaLiLab/emPDBA/.
INTRODUCTION
Protein–deoxyribonucleic acid (DNA) interactions play an important role in a variety of biological processes such as DNA transcription, replication and gene expression regulation [1]. Protein-DNA affinity is a key factor in enabling their interactions and defining structure–function relationships that drive biological processes [2]. Accurate measurement of binding affinity is crucial for understanding protein-DNA recognition and interaction mechanisms and designing drugs with high affinity and specificity.
Currently, the binding affinity can be measured through experimental methods such as Electrophoretic Mobility Shift Assay [3], Filter Binding Assay [4], Fluorescence Spectroscopy [5], Isothermal Titration Calorimetry [6] and Surface Plasmon Resonance [7]. These methods cannot be applied on a large scale due to cost and constraints. Therefore, accurate computational methods are urgently needed to predict protein-DNA binding affinity.
Various computational methods for binding affinity prediction have been developed in the past decades. The classical methods include free energy perturbation [8], thermodynamic integration [9] and Molecular Mechanics Poisson-Boltzmann Surface Area [10]. These methods need molecular dynamics simulations to sample conformational ensembles, which is time consuming especially for large-sized systems. Besides the classical ones, other methods include force field-based scoring function [11], knowledge-based potential functions [12–14], empirical scoring functions [15–17] and descriptor-based machine learning methods [18–20]. These methods have been applied to protein–protein/ligand binding affinity prediction. Few methods have been developed for protein-DNA binding affinity prediction due to the lack of experimentally determined affinity data and the complexity of protein-DNA interactions [21]. In 2010, Zhao et al. developed an atomic pairwise statistical potential DDNA3 [22] from 179 protein-DNA complex structures based on a distance-scaled, finite ideal-gas reference [13] state and applied it as a binding affinity evaluation to the prediction of DNA binding proteins with a Matthews correlation coefficient of 0.76. Later in 2020, Yang et al. constructed a protein-DNA binding affinity dataset containing 100 complex structures and corresponding experimental affinity data, and proposed PreDBA algorithm to predict binding affinity, where the complexes are classified into five types and multiple features are learned by a stacking regression model [23]. The utilized features in PreDBA including protein secondary structure types, DNA nearest neighbor bases and so on, are all extracted from single molecules, and the features from interfaces and interaction energies are not considered. We think considering these features is helpful for the prediction improvement. As we know, the interfacial geometric complementarity is closely related to the molecular binding affinity. Generally, the native protein-DNA interfaces are of a good geometric complementarity, which facilitates the formation of favorable interaction energies [24]. A study on protein–protein binding affinity has shown that the number of interface residue pairwise contacts and buried surface area are highly correlated with the binding affinity with the correlation coefficients of −0.59 and − 0.46, respectively, indicating that considering interfacial geometric complementarity will contribute favorably to binding affinity prediction [17]. Additionally, the importance of considering nonbonding interaction energies and statistical potential to protein-ligand binding affinity prediction has also been validated in many methods [11, 22, 25].
In this work, we propose an ensemble model for Protein-DNA Binding Affinity prediction (emPDBA), where complexes are classified into four types, and the considered features involve the interface information, nonbonding interaction energies, the statistical potential developed by us, as well as sequence and structural features from binding partners. These features are learned by an ensemble machine learning regression model.
MATERIALS AND METHOD
Datasets
We collected available protein-DNA binding affinity data (dissociation constant Kd under temperature T) from PDBbind database [21], ProNAB database [26] and the dataset constructed by Yang et al. in 2020 [23]. After removing the redundancy of complex structures according to 40% protein sequence similarity with Cluster Database at High Identity with Tolerance (CD-HIT) program [27], a total of 340 samples were finally obtained. From them, 36 samples were selected randomly as an independent testing set PD36, and the remaining ones as a training set PD304.
The binding affinity is measured using Gibbs free energy (ΔG) [28], which is calculated as following equation:
where T is the temperature, R is the gas constant (1.987 × 10⁻³ kcal mol−1 K−1) and Kd the dissociation constant. The average binding free energy in the training/testing set PD304/PD36 is −9.95/−10.16 kcal/mol, with the minimum being −18.05/ −15.00 kcal/mol and the maximum −0.77/−6.87 kcal/mol.
Classification of complexes
The complexes are classified into four types based on the DNA structure and the percentage of interface residues. First based on DNA structure, the complexes are classified into two types: the complexes with double-stranded DNAs (Double) and miscellaneous complexes (MISC). And then, the Double complexes are classified into three types (Double I, Double II and Double III) based on the percentage of interface residues in protein (≤10%, 10–20% and ≥20%). Here, an interface residue is defined as the one that has at least one atom closer than 5.0 Å to any atom of its partner DNA. The complexes in the training/testing dataset are divided into four types, including 64/2 Double I, 73/12 Double II, 97/17 Double III and 70/5 MISC types of complexes, with the detailed information listed in Tables S1 and S2, respectively.
Here, it is necessary to mention the reason for the complex classification. As we know, DNA molecules generally fold into double- or single-stranded (sometimes miscellaneous) forms, which makes them interact with proteins in different ways. Different from double-stranded DNAs that mainly use their backbones to interact with proteins due to that their bases all pair up with each other, the single-stranded or miscellaneous DNAs can form, besides backbone interactions, extensive hydrogen bonding and aromatic ring stacking interactions with proteins using their free and exposed bases, which is the main reason for our distinguishing MISC from Double types. For Double types, they are further divided into three types based on the percentage of interface residues in protein due to the fact that the binding affinity is closely related to the interface area which has been proven in protein–protein interactions [17, 29]. And it has been found that the classification according to the percentage of binding site residues in protein can effectively improve the correlation between the characteristics and affinity in each type and improve prediction performance [30]. A similar classification method has been adopted in a protein-DNA binding affinity prediction [23].
Feature extraction
A set of 106 features are extracted from protein, DNA and their complex structure for a protein-DNA complex. The specific features are described below.
Features from protein
A total of nine sequence- and 22 structure-based features are extracted from the protein side. The former contain molecular mass, and the numbers and percentages of four types of residues including nonpolar residues (Ala, Val, Leu, Ile, Phe, Trp, Met and Pro), polar uncharged residues (Thr, Ser, Cys, Asn, Gln, Tyr and Gly), positively charged residues (Lys, Arg and His) and negatively charged residues (Asp and Glu). The latter contain the number and percentage of residues in each of the eight types of secondary structures including α-helix, β-bridge, β-ladder, 310-helix, π-helix, turn, bend and the irregular, amounts and molecular masses of α-helix and β-sheet, solvent accessible surface area (SASA) [31] and the volume of protein. The programs Define Secondary Structure of Proteins (DSSP) [32] and Accessibility Calculation (NACCESS) [33] are used to obtain protein secondary structure information and SASA, respectively.
Features from DNA
A total of 33 sequence- and two structure-based features are extracted from DNA side. The former contain the amounts and percentages of 16 types of dinucleotides (like cytosine-guanine dinucleotides (CG), adenine-thymine dinucleotides (AT) and so on), as well as molecular mass of DNA. The latter contain the SASA and volume of DNA.
Features from complex
A total of 18 interface-based features, 16 energy-based features and six other features are extracted. Interface-based features contain the amount and percentage of each type of residues (four types mentioned above) and nucleotides (four types) at binding interface, interface area and the amount of hydrogen bonds between protein and DNA obtained by Visual Molecular Dynamics (VMD) [34]. Energy-based features contain one knowledge-based statistical potential, seven physical energy items and the eight energy features calculated by Matched interface and boundary-based Poisson–Boltzmann equation solver (MIBPB) program [25] including the reaction field energies and electrostatics solvation energies of protein, DNA and their complex, respectively, and the differences of the two energies of protein and DNA between their monomers and complex.
The 60 × 4 residue-nucleotide pairwise potential (Erp) with protein secondary structure information considered was extracted by us from 1545 non-redundant protein-DNA complexes. We collected all the 5387 protein-DNA complex structures from Nucleic Acid database in October 2020. After removing the redundancy of complex structures according to 70%/90% protein/DNA sequence similarity, the non-redundant database was constructed. Based on the analysis of the interface preferences of protein secondary structures, it is found that the preferences of different secondary structures vary greatly. Thus, based on their interface preferences (>1, ≈1 and <1), they were classified into three types. Thus, considering protein secondary structure information, the 60 × 4 amino acid-nucleotide pairwise preferences were calculated according to the formula:
where a is the type of 20 kinds of amino acids, i is the type of three kinds of protein secondary structures, b is the type of four kinds of nucleotides, |${N}_{ai-b}^I$| represents for the number of ai-b pairs at the interfaces, |$\sum \limits_{ai b}{N}_{ai-b}^I$| represents for the number of all amino acid-nucleotide pairs at the interfaces, |${N}_{ai}^S$| is the number of a amino acid in i secondary structure at surfaces, |$\sum \limits_{ai}{N}_{ai}^S$| is the number of all amino acids at surfaces, |${N}_b^S$| and |$\sum \limits_b{N}_b^S$| are the numbers of b nucleotide and all nucleotides at surfaces, respectively. Here, an amino acid-nucleotide pair is defined as the pair having at least one atom within 5.0 Å distance from each other. According to Boltzmann distribution principle, pairwise preferences were converted into corresponding statistical potential energies. When evaluating the statistical potential energy of a complex, the energy contributions of all interface pairs were summed up.
The seven physical energy items include van der Waals attractive (|${E}_{vdw}^{attr}$|) and repulsive (|${E}_{vdw}^{rep}$|) energies, electrostatic short-range attractive (|${E}_{ele}^{sa}$|) and repulsive (|${E}_{ele}^{sr}$|) energies, electrostatic long-range attractive (|${E}_{ele}^{la}$|) and repulsive (|${E}_{ele}^{lr}$|) energies and the electrostatic energy (|${E}_{ele}$|) [35]. The modified Lennard-Jones 6–12 potential [36] is adopted for van der Waals attractive and repulsive energies:
where rs,ij is the sum of van der Waals radii of heavy atoms i and j from the interacting partners, respectively, rij is the distance between the two atoms, and εij is the square root of the product of well depths. The van der Waals energy is continuous at rij = 0.89 × rs,ij. The electrostatic energy is calculated by the Coulomb model adopted in RosettaDock [37]:
where Rij = max (rij, 3 Å) to avoid singularities while rij is too small. Interactions are divided into attractive and repulsive categories according to the negative and positive interactions, as well as short-range (rij<5 Å) and long-range (rij ≥ 5 Å). All the parameter values are taken from the CHARMM19 [38] force field.
Other features contain the volume of complex and five topological features including average degree, average cluster coefficient, average degree centrality, average closeness centrality and average betweenness. Topological features are calculated by Python package NetworkX. In network construction, Cα atom and P atom are used to represent an amino acid and nucleotide, respectively, and the cutoff values of 7 Å, 13 Å and 10 Å are used to determine whether there are connections between amino acids, between nucleotides and between amino acid and nucleotide, respectively.
Feature selection
Feature selection can not only avoid overfitting but also make the model more interpretable by reducing the redundant and irrelevant features. Here the sequential forward selection (SFS) [39] combined with the Gradient Boosted Regression Trees (GBRT) [40] with default parameters is adopted to determine the optimal feature combination. SFS is a greedy algorithm that iterates to obtain the optimal subset of features. In each iteration, the best new feature is selected out based on the cross-validation score to add to the subset of features. It is started with an empty subset of features and the best single feature with the highest score is added in each iteration. The process is repeated until the score does not improve any more, or the number of selected features reaches a set point (here 20). The optimal subset of features is selected through maximizing the determination coefficient R2 (defined in section of Performance evaluation) via 3-fold cross-validation for 10 times on the training dataset.
Ensemble regression model
Stacking method, an ensemble learning strategy, is to combine multiple basic models to get a better learning model. In our work, a double-layer stacking model is used to predict protein-DNA binding affinity, where Decision Tree Regression (DTR) [41], Random Forest Regression (RFR) [42], Adaboost Regression (AdaR) [43], Bootstrap aggregating Regression (BagR) [44], GBRT [40] and Extreme Gradient Boosting Regression (XGBR) [45] are used to learn the feature matrices of the input, and then the Linear Regression (LR) is used to fit the relationship between the outputs of these models and the sample labels.
Architecture of emPDBA algorithm
The emPDBA predictor is trained on the protein-DNA binding affinity dataset PD304. First protein-DNA complexes are classified into four types based on the rules mentioned in MATERIALS AND METHOD. And then multiple features from proteins, DNAs and their complexes are extracted for feature selection. The subset of optimal features is selected out for each type of complexes by the SFS method and then is utilized to train the stacking ensemble regression model. Finally, four different ensemble models are obtained to predict the protein-DNA binding affinity of the corresponding type of complexes. The flowchart of emPDBA is shown in Figure 1.
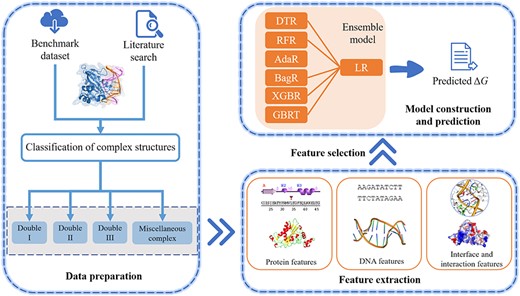
Flowchart of emPDBA for protein-DNA binding affinity prediction. First, the dataset of 304 complexes is used as the training set, which are divided into four types: complexes with double-stranded DNAs (Double I, Double II, Double III) and MISC. Next, multiple features are extracted, including interface and interaction features as well as sequence- and structure-based features from binding partners. And then, a set of optimal features are selected out by the SFS algorithm, and used to train the ensemble regression model constructed by six base models DTR, RFR, AdaR, BagR, XGBR, GBRT and a meta-model LR. Finally, the model performance is evaluated on the independent testing dataset including 36 complexes.
Performance evaluation
The emPDBA is tuned on the training dataset PD304 using 5-fold cross-validation and tested on the independent testing dataset PD36. The predictive performance of the regression model is assessed with Pearson correlation coefficient r, determination coefficient R2 and mean absolute error MAE that are defined as follows:
where n is the number of samples, |${\hat{y}}_i$| and yi are the predicted and actual values of the ith sample, and |$\overline{\hat{y}}$| and |$\overline{y}$| represent the mean of predicted and actual values, respectively.
RESULTS AND DISCUSSION
Comparison in prediction performance of models trained on classified and unclassified training datasets
In order to detect the effect of protein-DNA complex classification on the prediction performance, we trained ensemble regression models on the unclassified and classified data from PD304 training dataset with 5-fold cross-validation process, respectively. The scatter plots of the experimental and predicted ΔG for the two models are shown in Figure 2 (A) and (B), respectively. From Figure 2, the predictions from the model trained on the classified data [Figure 2 (B)] fit the diagonal line more nicely with the correlation coefficient r of 0.66 (P-value = 2.80 × 10−38) and MAE of 1.24, much better than the corresponding values 0.12 (P-value = 0.04) and 1.64 for the predictions from the model trained on the unclassified data [Figure 2 (A)]. In addition, the results on the independent testing set show that the predictions from the former model are also much better than those from the latter one, with the correlation coefficients of 0.53 and 0.12, respectively. The above results indicate that the complex classification significantly improves the prediction performance of the ensemble model for protein-DNA binding affinity. The reason, we think, is that there exist different interaction modes/mechanisms in protein-DNA complexes, and our adopted classification rules can well distinguish the differences (see the section of Analyses of selected features from different types of complexes for detailed analyses), which is beneficial for the feature selection scheme and ensemble model to learn the modes/mechanisms within each type of complexes.

Scatter plots of the experimental and predicted ΔG from the prediction models trained on the unclassified (A) and classified (B) data from the training dataset.
Analyses of selected features from different types of complexes
Considering the improved prediction performance of the model trained on the classified complexes, it is worth analyzing which features are selected from different types of complexes. Table S3 lists the selected features by feature selection procedure for each type of complexes.
For Double I type, the selected features worthy of note include average degree centrality, interface area, amounts of bend and turn residues in protein, percentage of β-bridge residues in protein, percentage of positively charged residues in binding sites, among which average degree centrality and percentage of β-bridge residues in protein have the highest correlation (−0.26) with binding affinity.
For Double II type, those features include interface area, van der Waals repulsive energy, electrostatic short-range attraction energy and percentage of polar uncharged residues in binding sites, among which the latter two have the highest correlation of 0.33 and −0.32, respectively, implying that the electrostatic interactions are very important for stabilizing the type of complexes. Figure S1 (a) shows the interaction interface for an example (PDB ID 4QPQ) in this type, where the percentage of polar uncharged (mainly involving tyrosine and serine) amino acids reaches 44.16%. Residues tyrosine and serine have been found to be key residues for specific recognition with DNA [46].
For Double III type, those features include amount of interfacial hydrogen bonds, percentage of polar uncharged residues in protein, amount of α-helix residues in protein and mass and amount of α-helices in protein. It seems that α-helix plays an important role for the intermolecular interactions of this type. Figure S1 (b) shows an example (PDB ID 1JJ4) for this type where the helix motifs are inserted into the DNA major grooves to form extensive hydrogen bond interactions.
For MISC type, the complex structures are more complicated, including the complexes with single-stranded DNAs and the ones with multiple DNA strands. The selected features worthy of note include percentages of nucleotides A and C in binding sites, percentages of dinucleotides GA and TG, amount of nonpolar residues in protein, percentage of nonpolar residues in binding sites and percentage of 310-helix residues in protein, among which percentage of nucleotide A in binding sites (−0.31), as well as amounts of dinucleotides thymine-guanine (TG) (−0.24) and guanine-adenine (GA) (−0.23) have high correlations with binding affinity. It seems that the component features from DNA contribute important roles to intermolecular interactions of this type, which is worthy of exploring in the future study.
To sum up, there do exist differences in the key factors contributing to intermolecular interactions of different complex types. The complex classification is beneficial for important feature extraction used for protein-DNA binding affinity prediction.
Comparison with other single regression methods
To illustrate the effectiveness of the ensemble model, we compared the prediction performances of emPDBA and its six single regression models including DTR [41], RFR [42], AdaR [43], BagR [44], GBRT [40] and XGBR [45] on the training set PD304, with the results listed in Table 1. All the models were tuned on the four types of complexes via 5-fold cross-validation process. From Table 1, generally GBRT has the best performance among the six single models, while the other five have their own advantages. For example, for Double I and Double II types, AdaR and XGBR obtain the best performances respectively. GBRT is an iterative tree model, where each iteration learns the residuals of the previous iteration results and achieves a better prediction accuracy through powerful loss functions. As expected, the ensemble model emPDBA is significantly better than any single model regardless of the types of complexes on which they are tested.
Comparison of the correlation coefficients obtained by the ensemble model with single regression models on training dataset
| Complex Type | DTR | RFR | AdaR | BagR | XGBR | GBRT | emPDBA |
|---|---|---|---|---|---|---|---|
| Double I | 0.33 | 0.60 | 0.64 | 0.58 | 0.63 | 0.63 | 0.72 |
| Double II | 0.41 | 0.57 | 0.55 | 0.55 | 0.62 | 0.61 | 0.73 |
| Double III | 0.42 | 0.46 | 0.51 | 0.49 | 0.52 | 0.54 | 0.62 |
| MISC | 0.37 | 0.42 | 0.41 | 0.40 | 0.52 | 0.53 | 0.55 |
The bold values indicate the best results.
Besides, we further compared the predictions from different combinations of models, with the results shown in Figure S2. We tried different combinations of models, including the combinations of the best three models (GBRT + XGBR + AdaR), the best four models (GBRT + XGBR + AdaR + BagR), the best five models (GBRT + XGBR + AdaR + BagR + RFR) and all the six models (our ensemble model). From Figure S2, each of the combinations is better than all the single ones. With the increasing of the number of models considered in the combination, the prediction performance has a slight improvement with average R2, r and MAE being ⁓0.40, 0.60 and 1.30, respectively. Combining the six single models, the ensemble model has the best performance with average R2, r and MAE being 0.44, 0.66 and 1.24, respectively.
Comparison of emPDBA with state-of-the-art approaches
We compared the performances of our method with DDNA3 [22] and PreDBA [23] on the independent testing dataset PD36, with the results shown in Figure 3 and Table 2. DDNA3 is a knowledge-based potential for protein-DNA binding affinity prediction, and PreDBA is a stacking machine learning approach utilizing GBRT, AdaR and BagR single regression models with sequence and structure information from monomer protein and DNA considered. From Figure 3, most of the predictions from emPDBA are closer to the diagonal line with correlation coefficient r of 0.53 (P-value = 9.56 × 10⁻⁴) and MAE of 1.11 kcal/mol, much better than the corresponding values 0.09 (P-value = 0.624)/0.30 (P-value = 0.07) and 1.80/2.05 kcal/mol from DDNA3/PreDBA (Table 2). Therefore, our method outperforms existing methods in predicting protein-DNA binding affinity on the independent dataset.
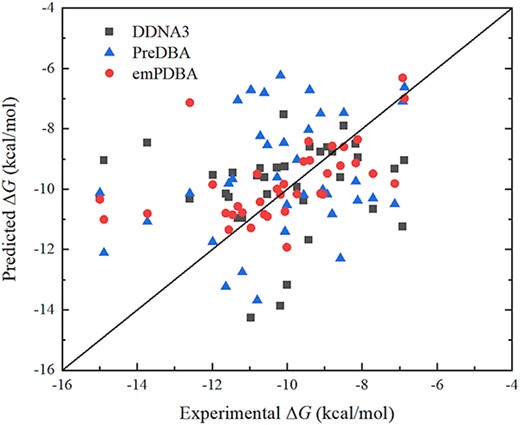
Scatter plot of experimental and predicted ΔG by DDNA3, PreDBA and emPDBA on the independent testing dataset.
Comparison of the evaluation metrics obtained by emPDBA with DDNA3 and PreDBA on the independent testing set
| Method | r | MAE (kcal/mol) |
|---|---|---|
| emPDBA | 0.53 | 1.11 |
| PreDBA | 0.30 | 2.05 |
| DDNA3 | 0.09 | 1.80 |
| Method | r | MAE (kcal/mol) |
|---|---|---|
| emPDBA | 0.53 | 1.11 |
| PreDBA | 0.30 | 2.05 |
| DDNA3 | 0.09 | 1.80 |
The bold values indicate the best results.
Figure 4 displays each prediction result of our emPDBA on the 36 samples from the independent testing set. Obviously, from Figure 4 almost half of the samples are accurately predicted, and only several samples mainly with low binding affinity are not well predicted. It is found that there are 66.67% of the samples that have the absolute error is ˂1.00 kcal/mol.
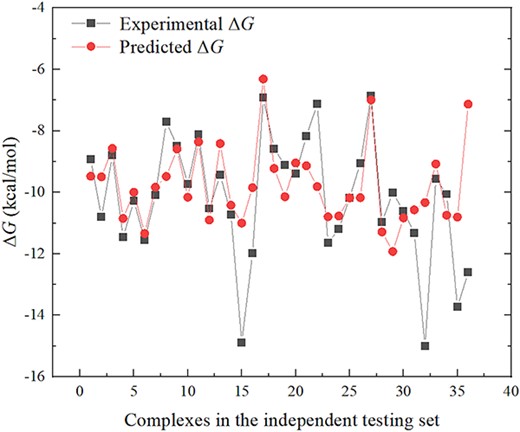
Point plot of the experimental and predicted ΔG by emPDBA for each sample from independent testing set.
Our method emPDBA outperforms other methods, and the likely reasons we think are mainly from two aspects. One aspect is our construction of a new and larger dataset of 340 protein-DNA complexes with binding affinity data, and the corresponding numbers are 179 and 100 in DDNA3 and PreDBA methods. Much more training data can make the model learn more comprehensive interaction patterns within the complexes. Another aspect is the methodological improvement. In method DDNA3, a statistical energy function is trained based on the atomic pairwise information of proteins and DNAs in complexes to predict binding affinities. Compared with DDNA3, emPDBA utilizes more interface and interaction features (including number of hydrogen bonds, complex network features, electrostatic and van der Waals interaction energies, our own developed statistical potential, etc.) as well as the respective sequence and structural features of proteins and DNAs. And the complexes are classified into four types and the feature selection is performed individually for each complex types, which makes different key features for binding affinities selected out for different complex types. These all largely improve the binding affinity prediction performance. Compared with PreDBA, emPDBA adopts the similar complex classification and ensemble model strategies, but more interface and interaction features mentioned above are introduced in emPDBA. PreDBA only uses the characteristics of proteins and DNA monomers. Some protein–protein [17] and protein-ligand binding affinity prediction works [11, 22, 25] also indicate that the interface and interaction characteristics can improve the performance of binding affinity prediction.
CONCLUSION
We propose an ensemble machine learning approach emPDBA to predict protein-DNA binding affinity. Considering the differences in protein-DNA binding modes, we classify complex structures into four types. The multiple features, including not only sequence- and structure-based features from monomer protein and DNA, but also interfacial and interaction features from the complex structure, are extracted and learned by the ensemble regression model. The analyses on feature contributions indicate that different important features can be captured for different types of complexes, which is beneficial for binding affinity prediction. The prediction performance of emPDBA on the independent testing dataset achieves Pearson correlation coefficient of 0.53 and the mean absolute error of 1.11 kcal/mol. The emPDBA algorithm outperforms the state-of-the-art approaches, giving a much better prediction for protein-DNA binding affinity.
As for application, the structure-based emPDBA for protein-DNA binding affinity prediction has several important applications. First, our method can provide a binding affinity reference for the protein-DNA complexes with known structures but no binding affinity data and also for their mutants. For the latter, users need to perform a simple energy optimization on the mutated complex before using emPDBA. Besides, the binding affinity can also be used for the evaluation of docking decoys, and therefore our method can serve as a scoring function for protein-DNA docking. Moreover, emPDBA can also be applied to the template-based prediction of DNA binding proteins. Zhou et al. found that the template-based prediction of DNA binding proteins requires not only structural similarity between target and template structures but also prediction of binding affinity between the target and DNA to ensure binding, and their method with the two aspects considered shows a substantial improvement over the methods based on sequence comparison (PSI-BLAST), and structural alignment (TM-align) [22].
Currently, the lack of experimentally determined affinity data is still a major obstacle for the development of prediction algorithms. We hope that more reliable predictors can be proposed with the increasing of experimental data. Additionally, as for the prediction accuracy improvement, there are two points that maybe need to be considered. One is the experimental conditions, since it is common that experimental data are obtained in different conditions. The other is the molecular conformational changes that often occur in different extents upon complex formation, and the energies involved in the changes are the parts of the binding affinity. We believe that considering these factors will be helpful for the promotion of prediction accuracy of protein-DNA binding affinity in the future.
Accurately predicting protein-DNA binding affinity has been one of the most attractive and challenging issues in computational biology. In this work, we develop an ensemble machine learning regression model called emPDBA for the binding affinity prediction, which combines six base models with one meta-model. The results show that the ensemble strategy can effectively improve the prediction performance, which is better than any single model.
Considering the good robustness of the interresidue pairwise preference potential, we extracted 60 × 4 residue-nucleotide pairwise potential with protein secondary structure information considered from the new constructed non-redundant database containing 1545 protein-DNA complexes. The pairwise potential is used to predict protein-DNA binding affinity, which has an excellent performance.
emPDBA shows a promising prediction power, generally surpassing the state-of-the-art methods DDNA3 and PreDBA. This work is helpful for strengthening the understanding of protein-DNA interactions, and has a potential application in complex structure prediction and drug discovery and evaluation.
CODE AND DATA AVAILABILITY
Data and code would be available upon request.
AUTHOR CONTRIBUTIONS STATEMENT
S. Y. and C. L. designed the research. S. Y. wrote the program of emPDBA model. S. Y., W. G., T. Z., X. S., W. Z. and L. C. participated in the construction of datasets and performed data analyses. C. L. validated the results. S. Y. and C. L. wrote the manuscript. All authors have given approval to the final version of the manuscript.
FUNDING
This work was supported by the National Natural Science Foundation of China (32271294, 31971180).
Author Biographies
Shuang Yang is a master student from Beijing University of Technology, China. His research interest is the development of machine learning methods for protein-DNA interaction prediction.
Weikang Gong is a PhD student from Beijing University of Technology, China. His research interests are the development of machine learning methods for protein function prediction and protein structure–function relationship study.
Tong Zhou is a master student from Beijing University of Technology, China. His research interest is the development of machine learning methods for protein-RNA interaction prediction.
Xiaohan Sun is a PhD student from Beijing University of Technology, China. Her research interests are the development of machine learning methods for protein mutation stability prediction and protein-ligand specific recognition.
Lei Chen is a master’s student from Beijing University of Technology, China. Her research interest is the protein dynamics-function relationship study.
Wenxue Zhou is a master student from Beijing University of Technology, China. Her research interest is the protein-RNA recognition dynamics.
Chunhua Li is a professor at Beijing University of Technology, China. Her research interests focus on the studies of protein dynamics, folding and allostery and protein-ligand/RNA interactions.
