


Abstract
Alternative splicing (AS) is a key transcriptional regulation pathway. Recent studies have shown that AS events are associated with the occurrence of complex diseases. Various computational approaches have been developed for the detection of disease-associated AS events. In this review, we first describe the metrics used for quantitative characterization of AS events. Second, we review and discuss the three types of methods for detecting disease-associated splicing events, which are differential splicing analysis, aberrant splicing detection and splicing-related network analysis. Third, to further exploit the genetic mechanism of disease-associated AS events, we describe the methods for detecting genetic variants that potentially regulate splicing. For each type of methods, we conducted experimental comparison to illustrate their performance. Finally, we discuss the limitations of these methods and point out potential ways to address them. We anticipate that this review provides a systematic understanding of computational approaches for the analysis of disease-associated splicing.
INTRODUCTION
Alternative splicing (AS) is a key transcriptional regulation pathway in eukaryotes [1]. To date, 95% of multi-exon human genes has been estimated to undergo alternative spliced [2]. AS can be divided into five types, namely, exon skipping (ES), alternative 3’ splice site (A3SS), alternative 5’ splice site (A5SS), intron retention (IR) and mutually exclusive exons (MXE) [3].
AS has been shown to be associated with cancers and other complex diseases. For example, Blencowe et al. found that AS has the potential to serve as a new biomarker in oncology and provide a large number of new targets for drug development, which can be beneficial to improve cancer patient prognosis and reduce cancer heterogeneity [4]. Love et al. analyzed the transcriptome of Alzheimer’s disease (AD) using RNA-seq and real-time quantitative polymerase chain reaction. The result showed that genes specifically associated with AD pathology including amyloid AS of precursor protein (APP) and apolipoprotein E (APOE) can lead to up-regulation or down-regulation of gene expression, which cause disease [5]. Zhang et al. explored the role of IR in AS in lung adenocarcinoma. They found that genes with tumor-specific IR are likely to be overexpressed in tumors and are likely the drivers of lung cancer. IR may suppress overexpression of genes that promote cancer development by triggering a nonsense-mediated decay mechanism [6].
In recent years, a number of tools have been developed for the analysis of disease-associated AS events. These tools can be divided into three categories based on usage scenarios, namely, differential splicing analysis, aberrant splicing detection and splicing-related network analysis, which are described below. (a) Differential splicing analysis is mainly used to identify splicing events that are differential between two groups of samples. Any of the AS events could change between conditions. Taking ES as an example, the same exon of the same gene in AD patients may have a mean PSI=0.8, while its PSI may be 0.2 in control samples. To date, many computational methods have been developed to identify and quantify differential splicing. For example, MISO [6] is a classic differential splicing method, which can be used for the comparison of a pair of samples. rMATS takes into account not only the sampling uncertainty of a single replicate, but also the variability between replicates [7]. (b) Aberrant splicing detection is aimed to detect individuals with rare diseases. An example is Bisbee [8], which integrates detection of differential splicing, identification of splicing outliers and prediction of splicing events. It takes protein-level effects on AS into account which are often overlooked by other methods. (c) Splicing-related network analysis systematically analyzes the association between splicing events or the association between splicing events and AS pathways at the network level. For instance, SpliceNet [9] is a method for inferring isoform-specific co-expression networks from RNA-seq data at the exon level. It goes beyond differentially expressed genes and infers variation in splice subtype networks between normal and disease samples.
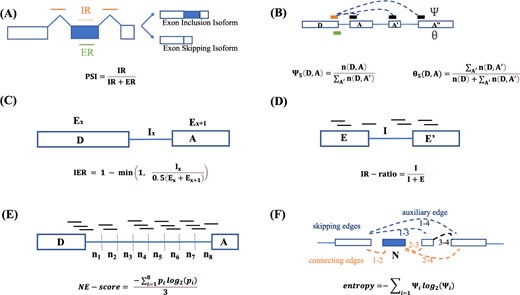
Illustration of metrics for characterizing alternative splicing events. The schematic diagram of (A) PSI ; (B) |$\Psi $| and |$\theta $| (The black bar indicates A’ in Eq (2) and Eq (4)); (C) IER; (D)IR-ratio; (E)NE-score; (F)entropy in Whippet.
Previous studies have shown that genetic variants are important regulators of AS [10][11][12][13]. Moreover, these splicing-altering variants are one of the most important genetic determinants in disease [14][15]. Various approaches have been proposed to probe genetic influences on the regulation of AS. PVAAS [16] is designed to detect single nucleotide polymorphism (SNP) associated with aberrant AS directly from RNA-seq data, which has the advantage of efficiently handling large-scale data. SpliceAI [17] accurately models mRNA splicing from genomic sequences via deep neural networks and can predict noncoding recessive splice mutations in patients with rare genetic diseases.
In this work, we performed a systematic review of the methods for detecting disease-associated splicing events. First, we summarized several metrics used to characterize AS events, such as the percent spliced in (PSI). Second, we introduced three types of methods for analyzing AS events for different scenarios, namely, differential splicing analysis, aberrant splicing detection analysis and splicing-related network analysis. Third, to further explore genetic variation affecting splicing events, we reviewed the analytical methods for identifying genetic variation affecting AS. Finally, we discussed the advantages and limitations of these methods, with the hope of providing useful guidance for future studies in this field.
METRICS FOR CHARACTERIZING ALTERNATIVE SPLICING
Many metrics have been developed to characterize AS events. These metrics can be widely used in a variety of disease-associated AS event analysis methods, such as differential splicing analysis, aberrant splicing detection and splicing-related network analysis. Each metric has its own advantage and focus. An illustration and summary of state-of-the-art metrics are provided in Figure 1 and Table 2, respectively. Their concepts, meaning and formula are detailed in the following text.
Summary of the metrics for characterizing alternative splicing.
| Metric | Description | Advantage | Method and References | Method’s code |
|---|---|---|---|---|
| PSI(|$\Psi $|) | The efficiency of splicing a specific exon into the transcript population of a gene. | PSI can simply quantify the ratio of a certain exon into transcript quantification, and can be used for a single sample or comparison of multiple samples between groups. | PSI [18] | ——— |
| |$\Psi _{5}(D,A)$| | The ratio of the number of split reads spanning the intron between donor D and acceptor A to all acceptors that spliced with the donor of interest | PSI is divided into two metrics, |$\Psi _{5}(D,A)$| and |$\Psi _{3}(D,A)$|, based on the 5’ and 3’. The advantage of having two separate metrics is that they resolve two different fundamental behaviors of the splicing reaction. | bam2ssj [20] | https://github.com/pervouchine/bam2ssj |
| |$\Psi _{3}(D,A)$| | The ratio of the number of split reads spanning the intron between donor D and acceptor A to all donors that spliced with the acceptor of interest | PSI is divided into two metrics, |$\Psi _{5}(D,A)$| and |$\Psi _{3}(D,A)$|, based on the 5’ and 3’. The advantage of having two separate metrics is that they resolve two different fundamental behaviors of the splicing reaction. | bam2ssj [20] | https://github.com/pervouchine/bam2ssj |
| |$\theta _{5}(D,A)$| | The ratio of the number of all acceptors that spliced with the donor D to non-split and split reads spanning the exon-intron boundary of donor D | Splicing efficiency is divided into two metrics, |$\theta _{5}(D,A)$| and |$\theta _{3}(D,A)$|, based on the 5’ and 3’. The advantage of having two separate metrics is that they resolve two different fundamental behaviors of the splicing reaction. | bam2ssj [20] | https://github.com/pervouchine/bam2ssj |
| |$\theta _{3}(D,A)$| | The ratio of the number of all donors that spliced with the acceptor A to non-split and split reads spanning the exon-intron boundary of acceptor A | Splicing efficiency is divided into two metrics, |$\theta _{5}(D,A)$| and |$\theta _{3}(D,A)$|,based on the 5’ and 3’. The advantage of having two separate metrics is that they resolve two different fundamental behaviors of the splicing reaction. | bam2ssj [20] | https://github.com/pervouchine/bam2ssj |
| |$ SE$|-|$score $| | The ratio of the number of split reads to the number of split and non-split reads | SE-score can compare spliced and unspliced intron rates directly. | Splice-q [21] | https://github.com/vrmelo/SPLICE-q |
| |$ IER $| | The ratio of intron expression to exon expression | IER focuses on the median coverage of each base of all involved genomic elements (exon and intron sequences), not just splice junctions. Therefore, IER can characterize splicing efficiency more accurately | Splice-q [21] | https://github.com/vrmelo/SPLICE-q |
| |$ IR$|-|$ratio$| | The ratio of the intronic abundance to the sum of intronic abundance and exonic abundance | IR-ratio simply quantifies the ratio of intron abundance to normal splicing abundance | IRFinder [22] | https://github.com/williamritchie/IRFinder |
| |$ NE$|-|$score$| | The normalized entropy score to characterize the ‘flatness’ of intronic reads | |$ NE$|-|$score$| takes into account the influence of the ”flatness” of intronic reads and characterizes this influence by |$p_{i}$|. | iREAD [23] | https://github.com/genemine/iread |
| |$ entropy $| | A |$\Psi $|-dependent measure of AS complexity using Shannon’s entropy | |$ entropy $| conveniently formalizes the total number of possible outcomes for an event and the degree of their proportional contribution to the transcriptome in a read-depth-and read-length-independent manner | Whippet [24] | http://github.com/timbitz/Whippet.jl |
The threshold values and the number of differential genes of each differential splicing analysis method on the APP mutant mouse dataset.
| Method | Threshold | Number of differential genes |
|---|---|---|
| MISO | Bayesian factor > 10 and |delta-PSI|> 0.05 | 232 |
| rMATs | |delta-PSI|> 0.05 and FDR < 0.05 | 211 |
| Splice-q | |delta-SE|> 0.05 and P value > 0.95 | 207 |
| Leafcutter | FDR<0.05 | 35 |
| DEXSeq | |log2FoldChange|> 0.05 and FDR < 0.05 | 23 |
| DARTS | |IncLevelDifference|> 0.05 and FDR < 0.05 | 19 |
Percent Spliced In. PSI [18] is used to characterize the relative proportion of a gene feature (such as an exon or an intron) that is spliced into transcript isoforms (Figure 1A). PSI represents the efficiency of splicing specific exons into the gene transcriptome [19]. Taking exons as an example, the PSI is defined in Eq (1):
where IR refers to the number of inclusion reads, and ER is the number of exclusion reads.
Splicing index. Pervouchine et al. [20] measured the splicing index at the 5’ and 3’ ends of introns (Figure 1B). The |$\Psi _{5}(D,A)$| can be regarded as an estimator for the conditional probability of splicing from D to A, and it is defined in Eq (2):
where |$n(D, A)$| refers to the number of split reads spanning the intron between donor D and acceptor A, and |$n(D, A^{\prime})$| is the split reads of donor D and acceptor A’, where A’ run over all acceptor sites and A’ includes A.
Similarly, |$\Psi _{3}(D, A)$| is the relative frequency of D-to-A splicing with respect to the splicing events in which A is used, and it is defined in Eq (3):
where |$n(D^{\prime}, A)$| is the split reads of acceptor A and donors D’, where D’ run over all donor sites and D’ includes D.
Splicing efficiency. |$\theta _{5}$| and |$\theta _{3}$| represent the completeness of splicing index. Similarly, the splicing efficiency metrics are split into two metrics |$\theta _{5}$| and |$\theta _{3}$|, which are also shown in Figure 1B, and |$\theta _{5}(D, A)$| is defined in Eq (4):
where |$n(D)$| is the number of non-split reads spanning the exon-intron boundary of donor D.
The |$\theta _{3}(D, A)$| is defined in Eq (5):
where |$n(A)$| is the number of non-split reads spanning the intron-exon boundary of acceptor A.
Splice-q [21] uses split and unsplit junction reads to quantify AS, defining a splicing efficiency score (|$SE$|-|$score$|) in Eq (6). However, unlike |$\theta _{5}(D, A)$| and |$\theta _{3}(D, A)$|, |$SE$|-|$score$| only considers the reads of a specific donor or acceptor and the corresponding acceptor or donor, and does not consider the reads of other alternative acceptors or donors.
where |$S$| is the number of split reads of intron, and |$N$| is the number of non-split reads of intron.
Intron expression ratio. Splice-q also characterizes the ratio of intron expression to exon expression (Figure 1C), which is inverse intron expression ratio (IER). IER as an alternative measure for splicing effciency, and the IER is defined in Eq (7):
where |$I_{x}$| is the median read coverage per base for the xth intron of a particular transcript, and |$E_{x}$| and |$E_{x+1}$| represent the median coverage of the corresponding exons.
IR-ratio. IR is a type of AS event. Studies have shown that IR has been found to be associated with complex diseases such as cancer [25][26][27]. In IRFinder [22], the key metric for IR quantification is the IR-ratio (Figure 1D). The IR-ratio is defined in Eq (8):
where |$I$| is the intronic abundance,and |$E$| is the exonic abundance.
NE-score. Based on information theory, iREAD [23] develops a score to characterize the ‘flatness’ of intronic reads (Figure 1E). This score is obtained by first dividing each intron into eight bins and recording its reads to obtain a vector r = (|$n_{1}$|, |$n_{2}$|,..., |$n_{8}$|). The probability mass distribution for a particular bin is calculated as the read of that bin(|$n_{i}$|) divided by the sum of the reads of the eight bins. The normalized entropy score is defined in Eq (9):
Splicing complexity. The currently widely used AS event characterization metrics only consider known types of AS events, but do not consider the characterization of complex AS events. Whippet [24] can accurately and efficiently detect and quantify the complexity of AS events.
Whippet models transcriptome structure by constructing ‘Continuous Splicing Graphs’ (CSGs). CSGs are directed graphs. Their nodes are non-overlapping exon sequences, and their edges are splice junctions or adjacent exonic regions. Based on CSGs, AS events are defined as aggregated sets of nodes skipping or connecting edges. In Whippet, the PSI of a node is calculated as the sum of the proportional abundances of the paths containing that node, and the authors used the maximum likelihood estimation of the expectation maximization (EM) algorithm to determine the proportional abundance of each path (Figure 1F). The PSI (|$\Psi $|) is defined in Eq (10):
where |$i$| is an AS event path; |$I_{m}$| is the path containing node m.
Next, Whippet uses K(n) and entropy to quantify the complexity of events. The n refers to the number of alternative exons sandwiched between flanking constitute exon. First, for each event, it calculates n based on the number of paths to the event, and then classifies the event into K(n). Specifically, the event complexity level is divided into six levels, which are K1, K2, K3, K4, K5, K6. The n is defined in Eq (11):
where |$s$| is the enumeration path numbers of AS events, and |$\lceil . \rceil $| means rounded up.
Second, it computes a |$\Psi $|-dependent complexity measure using Shannon’s entropy. And the entropy is defined in Eq (12):
METHODS FOR DETECTING DISEASE-ASSOCIATED SPLICING EVENTS
In recent years, many tools have been used to detect disease-associated AS events. Here, we introduce three categories of splicing event analysis methods, which are differential splicing analysis, aberrant splicing detection analysis and splicing-related network analysis. An illustration and summary of state-of-the-art methods are provided in Figure 2.
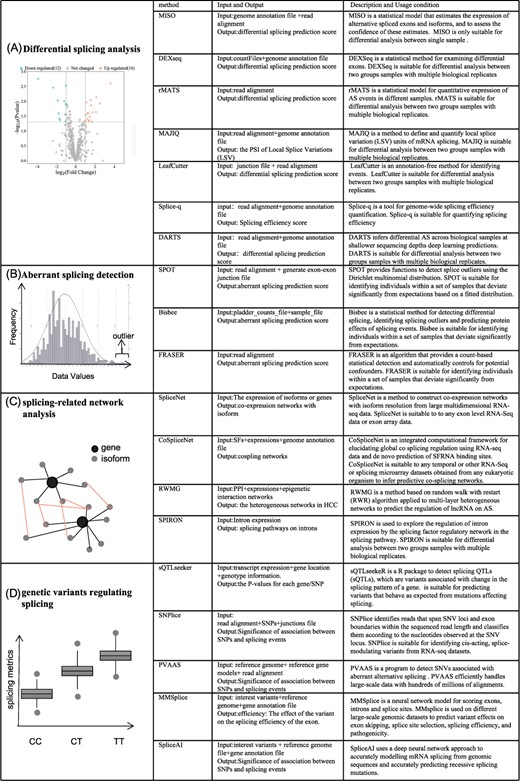
Illustration of methods for detecting disease-associated alternative splicing events. The schematic diagram of (A) Methods of differential splicing analysis; (B) Methods of aberrant splicing detection; (C) Methods of splicing-related network analysis; (D) Methods for detecting splicing-associated genetic variants.
Differential splicing analysis
Differential splicing analysis is a fundamental approach for splicing analysis. Here, we introduce several differential analysis methods, which are MISO, DEXSeq [28], rMATS, MAJIQ [29], LeafCutter [30], Splice-q and DARTS [31].
MISO
The Mixture-of-isoforms (MISO) is a statistical model that estimates the expression of alternative spliced exons and isoforms, and to assess the confidence of these estimates.
The method designs a Markov chain Monte Carlo (MCMC) inference scheme and uses a hybrid MCMC sampler that combines the Metropolis-Hastings (MH) algorithm with a Gibbs sampler. Since the computation of intergenic isoform expression level estimation is independent, MISO can be run on a cluster for a high degree of parallelization. However, MISO cannot directly handle experiments with multiple biological replicates due to the fact that its differential analysis method relies on single-sample analysis. This problem can be solved by merging all BAM files or extracting the isoform reads assigned during the single-sample analysis phase as input to other differential analysis software, such as edgeR [32] and DEXSeq2 [28].
Applying MISO to RNA-seq data from normal cells and hnRNPH knockdown cells, it was observed that in the presence of hnRNPH, the short 3’ UTR isoforms expressed higher genes, especially those with large BF values [6]. There was a higher density of CLIP (cross-linking–immunoprecipitation sequencing) labels near the distinct polyadenylation sites (PASs). This suggested that hnRNPH1 activates the broad regulation of poly-adenylation (APA) in human genes by binding to nearby core PAS. Overall, the application of MISO suggested a role for the RNA splicing factor hnRNPH1 in the regulation of selective cleavage and polyadenylation.
DEXSeq
DEXSeq is a statistical method for examining differential exons. DEXSeq performs exon variance analysis by obtaining a table of overlapping exon reads, and the steps of the DEXSeq method are as follows. First, DEXSeq classifies exons by a list of coordinate intervals of a set of exons, called ‘exon counting bins’. Second, for each BAM file, DEXSeq counts the number of reads that overlap with the exon counting bins to obtain the list. Third, for each gene DEXseq matches a generalize linear model (GLM) to test DEUs. DEXSeq can also replace exon coordinates with intron coordinates for IR detection.
DEXSeq was used to analyze differences in exon usage in different tissues of chimpanzees [28]. The prefrontal cortex samples from five chimpanzees and cerebellum samples from two other chimpanzees were considered. DEXSeq found significant differences in exon usage across 866 count bins from 650 genes. And the gene PRKCZ was only expressed in its first four exons in the cerebellum, but not in the prefrontal cortex. This suggested that PRKCZ loses its ability to bind to chaperone proteins in the prefrontal cortex.
rMATS
The rMATS algorithm solves the intra-individual sampling uncertainty problem by normalizing reads mapped to exon inclusion or skip isoform by the effective length of the isoform at the time of computation. rMATS uses a hierarchical model to compute the PSI of each event and accounts for intra-individual sampling uncertainty and inter-sample variability. The rMATS statistical model quantifies the expression of AS events for different samples with biological replicates, and then the likelihood-ratio test is used to calculate P-value to indicate the difference between the two groups of samples at the inclusion level. rMATS can identify five types of AS events, skipped exon (SE), A5SS, A3SS, MXE and IR.
To compare the performance of rMATS [7] with Cufflinks (2.2.1) [33] and DiffSplice (0.1.1) [34], the authors conducted a simulation study based on read count distributions from The Cancer Genome Atlas Program (TCGA) RNA-seq data. Receiver operating characteristic (ROC) curves showed that rMATS outperforms Cufflinks and DiffSplice, with an area under the curve (AUC) of 86|$\%$| for rMATS, 83|$\%$| for Cufflinks and 81|$\%$| for Diffsplice. rMATS had a lower false positive rate (<0.2) in the critical region of the ROC curve, and the difference was more significant, with an 8|$\%$| and 15|$\%$| higher true positive rate than Cufflinks, respectively.
MAJIQ
MAJIQ is a method to define and quantify local splice variation (LSV) units of mRNA splicing. The steps of the method are as follows. First, RNA-seq reads are combined with an annotated transcriptome to create a splicing map. Then MAJIQ quantifies the LSV and compares the quantification between different conditions. Under specific conditions, quantification of LSV is based on the marginal percent selected index (PSI, |$\Psi $|) of each junction involved in LSV, while comparison of experimental conditions is based on the relative change in PSI (dPSI, |$\bigtriangleup $||$\Psi $|). MAJIQ uses read rate modeling, Bayesian modeling and bootstrapping to estimate the posterior |$\Psi $| and |$\bigtriangleup $||$\Psi $| distributions for each LSV. Finally, MAJIQ visualizes the output and graph the estimated value of PSI (|$\Psi $|) or dPSI (|$\bigtriangleup $||$\Psi $| ).
To explore the role of CAMK2 in AD, the authors used MAJIQ to analyze RNAseq data from three control brains and three AD brains [29]. The results demonstrated a significant 38|$\%$| reduction in neuron-specific isoforms of mouse LSV, a complex developmental regulation of AD brains in CAMK2D. This suggested that the novel splicing variants detected by MAJIQ are important for the exploration of disease mechanisms.
LeafCutter
LeafCutter is an annotation-free method for identifying events. It can both detect differential splicing between sample groups and map splicing quantitative trait loci (sQTL). The major steps are as follows. First, short reads are mapped to the genome. Reads are then extracted from the BAM files to identify the selectively excised intron clusters, and to summarize the intron usage as counts or ratios. Finally, LeafCutter uses the read counts in intron clusters to model jointly with the Dirichlet-multinomial generalized linear model, which identifies intron clusters with differentially excised introns between two user-defined groups.
The authors applied LeafCutter to all tissues of the genotype-tissue expression (GTEx) [30]. As a result, 5070 tissue-regulated splicing clusters were identified, with estimated absolute effect sizes greater than 1.5. And when using 220 samples (110 brains versus 110 muscles), LeafCutter identified 1906 differentially spliced clusters. This showed that LeafCutter has good performance for both large and small samples.
Splice-q
Splice-q is a tool for genome-wide splicing efficiency quantification. The workflow of Splice-q includes the following steps. First, the genomic features from the GTF file are analyzed. Meanwhile, the introns and splice junctions from the exon coordinates of the GTF file are located and annotated. Then it filters introns based on genomic element overlap levels and calculates coverage based on the reads concise idiosyncratic gapped alignment report, selecting split and non-split reads at the splice junctions to calculate coverage. Finally, splicing efficiency is calculated. If the user chooses to include the inverse intron expression ratio, the median coverage per base of the intron and its companion exon and the inverse intron expression ratio will need to be calculated.
To explore the mechanism of prostate cancer, the authors applied Splice-q to the data from prostate cancer samples and their matched normal tissues [21]. The median SE-score was 0.96 in both tumor and normal samples. This indicated that the average splicing strength level did not change between normal and tumor tissues. But for prostate cancer associated 3 (PCA3), a long noncoding RNA highly expressed in prostate cancer, its second intron had an SE-score of 0.57 in normal tissues and 0.90 in tumors. This suggested that PCA3 may be not only overexpressed but also spliced more efficiently in prostate cancer patients.
DARTS
One major limitation of AS analysis is that it is very dependent on sequencing depth. Here, DARTS infers differential AS across biological samples at shallower sequencing depths deep learning predictions. The steps of the method are as follows. First, DARTS BHT (flat) analyzes large-scale RNA-seq sequence data with non-informative priors to generate training labels for high-confidence differences or invariant splicing events between conditions, which are then used to train DARTS DNN. Second, DARTS DNN predicts whether two conditions are differential alternatively spliced based on exon-specific sequence features and sample-specific regulatory features. Finally, DARTS BHT (info) model infers differential variable clipping by integrating deep learning-based predictions as prior information.
The authors used the DARTS model to study AS events associated with the epithelial-mesenchymal transition (EMT) in two different human cell culture lines (PC3E and GS689 prostate cancer cell lines) [31]. The result showed that the DARTS DNN scores of these two cell lines were highly correlated, suggesting that DARTS DNNs can capture a core EMT-related splicing signature.
Comparison of differential splicing analysis methods
Among the methods used to analyze differential splicing, we compared six methods, including MISO, rMATs, Splice-q, Leafcutter, DEXSeq and DARTS. MAJIQ is not compared, because the installation file of MAJIQ is incomplete, and we failed to run MAJIQ.
In order to compare the differential splicing analysis methods on real datasets, we chose the dataset that was generated from APPPS1 mouse models of amyloidosis, which was produced in the Accelerating Medicines Partnership-Alzheimer’s Disease Project. Brain samples were sequenced using Illumina HiSeq 2000 to obtain paired-end reads with a sequencing depth of approximately 100 million and a read length of 101 bp. We selected 16 samples from the APP mice in the study, following the work by Zheng et al [35]. Among them, eight normal samples served as the control group, and eight APP mutant samples served as the experimental group.
We ran the six methods on APP mutant mouse dataset. Finally, we compared the performance of these methods by comparing the number of differential genes and their intersection. The threshold values adopted by these methods and the number of differential genes is shown in Table 2, and their comparison is shown in Figure 3.

UpSet diagram comparing the detected differential genes of each method on the APP mutant mouse dataset.
Aberrant splicing detection
Aberrant AS is a major cause of rare diseases. Therefore, how to detect these aberrant AS events is an important research. Many methods have been developed to study the mechanism of rare diseases, and here we introduce these methods. Here, three methods for detecting aberrant splicing from transcriptome data are presented, namely, SPOT [36], Bisbee and FRASER.
SPOT
SPOT provides functions to detect splice outliers using the Dirichlet multinomial distribution. SPOT directly applies a Dirichlet multinomial distribution to the read counts of alternatively spliced exon–exon junctions for each gene. Then it uses this fitted distribution to identify individuals that deviate significantly from expectations. If the median outlier statistic for an individual exceeds a selected threshold across all measured tissues, it will be referred to as a multi-tissue outlier. For a given LeafCutter cluster in a given tissue, the method defines a matrix |$\mathbf{X}$| where each row corresponds to one sample and each column corresponds to J clusters of exon-exon junctions. And the P-value can be calculated by the method given in the article, indicating the abnormal degree of a given sample for a given cluster.
To assess the impact of rare genetic variants on gene expression, Nicole et al. detected sOutliers in 49 tissues using SPOT [36]. Applying SPOT to 838 genome-wide and transcriptome samples of GTEx.v8 to assess rare gene variants affecting AS, the authors identified dozens of rare variants affecting the well-studied disease genes APOE, FAAH and MAPK3.
Bisbee
Bisbee is a statistical method for detecting differential splicing, identifying splicing outliers and predicting protein effects of splicing events. Bisbee’s splicing event protein sequence prediction is achieved by the following steps. The event junction coordinates are first compared with the exon coordinates of the protein-coding transcript of the gene (retrieved using the python package pyEnsembl) to determine whether any known transcripts are present for each isoform of the event. Regions where amino acids have been changed are then found from the searched sequences. Bisbee’s splicing test uses the beta binomial model to test the deviation of PSI, and obtains the beta distribution parameters by maximizing the sum of the log probability densities of a set of reference samples. The beta binomial model implemented in Bisbee can detect significant low-coverage events in PSI and smaller high-coverage events in PSI.
To examine the utility of the Bisbee software package in research and clinical applications, the authors applied Bisbee to the uveal melanoma dataset to explore the regulatory mechanism of the splicing factor SF3B1 [8]. When examining the total number of splicing outliers per patient, the author observed a significant increase in outliers at A3SSs for SF3B1 mutations, as well as a significant increase in the burden of ES, IR and MXE outliers.
FRASER
FRASER is an algorithm that provides a count-based statistical detection and automatically controls for potential confounders. First, the method generates a splice site map based on RNA-seq split reads. For each junction, FRASER computes splicing metrics, such as |$\Psi _{5}$|, |$\Psi _{3}$| and |$\theta _{5}$|, |$\theta _{3}$|. A statistical model is then fitted according to the BB distribution (beta-binomial distribution) for each splicing index, and the parameters are fitted with an auto-encoder and |$P_{ij}$| is calculated for each junction. Data points that deviate significantly from the fitted model are detected as outliers. Finally, FRASER uses the genome browser to visualize the candidates.
FRASER was applied to RNA-seq samples of 119 skin fibroblasts from 48 GTEx tissues [37]. An IR event in the MCOLN1 gene that was missed by LeafCutter was detected. This suggested that FRASER can detect AS events more comprehensively and sensitively considering that non-split reads can detect IR events.
Experiment of aberrant splicing detection methods
Among the three methods of abnormal splicing, we did not run the Bisbee and SPOT methods for the following reasons: (1) Bisbee misses some running files such as ‘|$h5py/\_objects.pyx$|’ and cannot run. (2) The rare disease data introduced in the work of FRASER [38] and leafcutterMD [39] are not available. Therefore, we can only use the simulated data generated with the method described in FRASER [38], but the simulated data are not applicable to SPOT. So we just ran FRASER.
In order to get the simulation data set, we used the outlier-generating method described in FRASER [38] to inject artificial outliers in 80 elderly control brain samples. The data of 80 elderly control samples are from the article by Li et al [40]. For convenience, we refer to this dataset as ‘Human Brain RNA-seq Dataset’. According to the injection method, we first selected 50 000 sites in 80 samples, and then used a ratio of 0.01 to obtain 80|$\times $|500=40 000 aberrant sites. If the site is regarded as a sample, with aberrant sites labeled as positive and normal sites as negatives, then the simulated data set has a total of 4000 000 samples, and the ratio of positive and negative samples is set to 1: 99.
Finally, we found the optimal latent space dimension q (q=6) using the auto-encoder in the FRASER method, which can maximize the precision-recall of detecting in silico injected splicing outliers. The AUPRC of FRASER on the simulated data set is 0.60.
Splicing-related network analysis
The methods mentioned above are used to analyze the dominant individual AS events, without paying attention to the relationship between splice events. In this section, moreover, we introduce methods to analyze the connections between AS events and the connections between splicing events or connections between splicing events and splicing pathways at the network level. These methods are SpliceNet, CoSpliceNet [41], RWMG [42] and SPIRON [40].
SpliceNet
SpliceNet is a method to construct co-expression networks with isoform resolution from large multidimensional RNA-seq data. In this network, the nodes are the isoforms corresponding to the gene of interest, and the edges are the pairwise dependencies between the isoforms of different genes obtained by identifying RNA-seq.
The expression of isoforms or genes is first represented as a matrix. Then, a large-dimensional tracking test (LDT) is employed to recover the corresponding pairwise dependencies. Co-expression edges are inferred by accepting or rejecting the null hypothesis centered on the variance matrix of the corresponding isomorphic expression (the exon expression matrix). Compared with other methods, this method exploits large-dimensional theory to assume an asymptotic distribution on variance matrix trajectories, making it more robust to differences between exon number and RNA-seq sample size. And SpliceNet performs well when the total number of exons (dimension) per gene is larger than the sample size. Furthermore, the edges of the SpliceNet are determined by hypothesis testing rather than arbitrary thresholds.
To investigate the association of Bcl-x with the SIVA1 gene, the authors constructed gene-level networks for cancer samples and normal samples, respectively [9]. The results showed no differences between gene-level networks from cancer and normal samples. Therefore, it was imperative to study isoform interactions to decode potential tumorigenic molecular interactions. The authors therefore proceeded to construct a differential network with isoform resolution. The association of Bcl-xwith SIVA1 was first analyzed. Compared with normal samples, the edges of Bcl-xL and SIVA1-NM006427 were lost in cancer samples, suggesting a possible loss of interaction between Bcl-xL and SIVA1-NM006427.
CoSpliceNet
CoSpliceNet is an integrated computational framework for elucidating global co-splicing regulation using RNA-seq data and de novo prediction of SFRNA binding sites.
CoSpliceNet constructs a co-splicing network through the following steps. First, the set of transcripts that is highly correlated with at least one SRP is identified. Second, the 30-nucleotide region surrounding each exon/intron splice junction (R1 to R4) is extracted for each transcript co-expressed with any selected RNA binding protein (RBP). Specifically, R1 means the accepter’s intronic region; R2 means the accepter’s exonic region; R3 means the donor’s exonic region; R4 means the donor’s intronic region. Third, MEME analysis is performed separately for each SF group on the resulting sequences to find consensus motifs. Fourth, transcripts containing significantly enriched motifs on each region (P-value <0.05) are retrieved from the MEME results. Fifth, for each transcript with significantly enriched motifs in at least one R region (such as R1 and R3 of co-expressed genes X and Y), CoSpliceNet built a graph. The nodes of the graph were each splicing factor (SF) and its potential product in Cytoscape and the edges were weighted based on log (P-value).
CospliceNet was applied to an RNA-seq dataset during Arabidopsis embryonic development to predict associations between splicing factors and their products [41]. The result showed that the spliceosome protein U2AF35 bound to sr45 is associated with U2AF35 in the R2 of the co-splicing group, a unique binding motif exists in the R2 and R4 regions. In addition, the motifs in the R2 and R3 regions of the SC35 co-splicing group were identified that are also unique.
RWMG
Random walk multi-graphic (RWMG) is a method based on random walk with restart (RWR) algorithm applied to multi-layer heterogeneous networks to predict the regulation of lncRNA on AS.
The network first constructs a co-expression network to connect n RNAs with l AS-associated genes, then constructs a regulatory network to connect these n lncRNAs with another k AS-associated genes and finally integrate the co-expression network, lincRNA regulatory network, and PPI network. The author first creates a graph G (V, |$E_{k}$|) with N nodes for each network, and then merges the networks with overlapping node features and edge unions into an undirected associative network MG(V, E). Then, the author calculates the connectivity scores (|$E_{i,j}$| ) and transition probabilities (|$B_{i,j}$|) of nodes in the graph MG. Among them, |$E_{i,j}$| is the average value of all included edge scores connecting nodes i and j, and |$B_{ij}$| is the transition probability from node j to node i, which is calculated by |$E_{i,j}$|. Based on these two metrics, the RWMG model presupposes genes known as ‘seed’ nodes to play a role in AS network regulation, and predicts ‘new’ nodes based on the probability of moving from the current node to any randomly selected neighbor.
The authors used RWMG to explore the association of HAND2-AS1 with HCC [42]. The results indicated that the HAND2-AS1 gene exhibited a consistent AS pattern at the start and end sites of METTL7B. Among them, METTL7B was a membrane-associated protein present in hepatic lipid droplets. This may be because HAND2-AS1 activates the spliced isoform lipid disorder of METTL7B.
SPIRON
In order to explore the regulation of intron expression by the splicing factor regulatory network in the splicing pathway, the authors constructed the network SPIRON. The edges of this network connect an intron to its corresponding splicing factor, and the weight of the edge represents the regression coefficient between the intron. The regression coefficient is calculated by the LASSO model. The method uses Monte Carlo methods to identify splicing factors that could robustly predict intron expression.
Four SPIRONs were constructed using human and mouse AD and control samples [40]. The results showed that mouse SPIRON and human SPIRON were similar. Major splicing factors such as Snrnp70, Prpf40b, Acin1, Srrm1, Thoc2 and Fus were present in both networks. Additionally, AD and control SPIRONs of both species were highly structured, with most introns associated with a single splicing factor. In addition to this similarity, there were also differences between the human and mouse networks. For example, HSPA2 was only present in human SPIRON. Rnps1 was associated with several introns in mice but not in humans.
Comparison of splicing-related network analysis methods
Among the four AS network analysis methods, since the source codes of RWMG and SpliceNet are missing, here we only compare the coSpliceNet and SPIRON methods on the same dataset.
In order to compare the coSpliceNet and SPIRON methods, the ‘Human Brain RNA-seq Dataset’ as described above was used to construct AS networks according to the coSpliceNet and SPIRON methods.
The nodes of the final output network of coSpliceNet and SPIRON are different. The node of coSpliceNet is transcript, and the node of SPIRON is intron and its corresponding splicing factor (gene). To compare the two methods, we map the transcripts nodes and the introns nodes to genes for comparison. At last, the number of mapped genes of isoforms in the splicing network obtained by SPIRON and coSpliceNet are 774 and 1880, and the comparison of the results of the two methods is shown in Figure 4.

UpSet diagram showing the comparison of mapped genes by splicing-related network analysis methods.
Genetic variants regulating splicing
One of the main mechanisms affecting the splicing process is nucleotide variation, so exploring the effect of genetic variation on AS events can lead to deeper insights into disease mechanisms [43][44][45][46]. Here, we describe five approaches to identify genetic variants that affect gene splicing patterns, namely, sQTLseeker [47], SNPlice [48], PVAAS, MMSplice [49] and SpliceAI.
sQTLseeker
sQTLseeker is a method to identify AS-related sQTL. The specific analysis steps are as follows. First, the gene splicing ratio of a specific gene is calculated. Second, the Hellinger distance is used to measure the distance between two observations. Third, for each gene–SNP pair, a test similar to MANOVA is used for position comparison using Anderson. The aim of the previous step is to assess the association between the genotype of a given SNP and the splicing rate of a given gene. The test does not assume any probability distribution of splicing ratios, but instead uses a pseudo-F ratio score to measure the relative difference between within-group and between-group variability and to assess its significance. Finally, after testing all the considered gene–SNP pairs, the P-value for all genes and all SNPs are pooled together to obtain a significant sQTL.
Compared with sQTLseekeR, sQTLseekeR2 [50] improves the accuracy and speed of P-value calculations and allows additional covariates to be considered before testing for association with genotype, while maintaining multivariate statistical tests in sQTLseekeR.
A total of 465 lymphoblastoid cell line (LCL) samples from five populations were analyzed using sQTLseekeR [47]. In each population, an average of about 1.3M SNPs and 10 012 genes were detected. There were 140 SNPs per gene on average. At FDRs of 5|$\%$| and 1|$\%$|, there were an average of 2900 and 1950 significant associations, respectively.
SNPlice
SNPlice identifies reads that span SNV loci and exon boundaries within the sequenced read length and classifies them according to the nucleotides observed at the SNV locus. For each SNV site and exon-intron boundary, four types of read counts are calculated: NVARee, NVARei, NREFEe and NREFei. NVARee represents the number of reads carrying variant nucleotides that do not cross an exon–intron boundary. NVARei represents the number of reads carrying variant nucleotides that cross an intron boundary. NREFEe represents the number of reads carrying a reference nucleotide that does not cross an exon–intron boundary. And NREFei represents the number of reads carrying the reference nucleotide and crossing the boundary. The log odds ratio is calculated from these four values. Fisher’s exact test is used to determine its statistical significance, and the P-value is corrected by estimating FDR. Finally, the SNVs of interest are visually inspected by the integrated genome viewer.
With 65 human transcriptomes processed by SNPlice, the result showed that 141 unique variants significantly were associated with intronic reads (FDR <0.05), of which 36 were present in two or more unrelated samples [48]. In addition, about one-third of the heterozygous sample variation was significant. 0 to 18 variants were found in each individual sample.
PVAAS
PVAAS is a program to detect SNVs associated with aberrant AS directly. It can efficiently handle large-scale data with hundreds of millions of alignments. PVAAS takes commonly used BAM files as input, and extracts split reads from them, then annotates them using the provided reference gene model. Then PVAAS classifies splicing events into three categories: canonical splicing (known at both ends), semi-canonical aberrant splicing (with one end known) and novel aberrant splicing (both unknown). ‘Semi-canonical aberrant splicing’ and ‘novel aberrant splicing’ are considered abnormal splicing events. Finally, Fisher’s exact test was used to assess the significance of the association between sequence variants (SNPs or indels) and aberrant splicing events. The Benjamini–Hochberg procedure was used to control for FDR.
Applying this method to TCGA prostate cancer RNA-seq data, 215 SNVs significantly associated with aberrant splicing could be detected [16]. And it could be found that A-to-G (or T-to-C) variants account for 32|$\%$| of semi-canonical aberrant splicing, while G-to-A (or C-to-T) transitions account for 34|$\%$| of novel aberrant splicing. SNVs associated with semi-canonical aberrant splicing were predominantly located at exon boundaries, whereas SNVs associated with novel aberrant splicing were evenly distributed across exons.
MMSplice
MMSplice is a neural network model for scoring exons, introns and splice sites. MMsplice can predict the effect of variants on ES, splice site selection, splicing efficiency and pathogenicity by training on different large-scale genomic datasets. First, MMSplice consists of six modules, and the corresponding modules are obtained by neural network training on the sequences of donor, acceptor, exon and intron sites. The modules are then combined with linear models to score variant effects on ES, alternative donor or alternative acceptor sites and splicing efficiency;also, they are combined with logistic regression models to predict variant pathogenicity.
The author benchmarked under 10-fold cross-validation on all the 10 715 variants to compare the performance of MMSplice [49] with MaxEntScan [51], HAL [52] and LaBranchoR [53]. The result showed that MMSplice (AUROC = 0.940) outperformed SPANR (AUROC = 0.821) and the ensemble model combining MaxEntScan, HAL, LaBranchoR (AUROC = 0.928). And adding MMSplice to the ensemble model could further improve the AUROC to 0.954.
SpliceAI
SpliceAI uses a deep neural network approach for accurately modeling mRNA splicing from genomic sequences and accurately predicting recessive splicing mutations. This method uses a residual network with 32 dilated convolutional layers to identify sequences with very large spans for analysis. First, for each position in the pre-mRNA transcript, SpliceAI-10k uses 10 000 nucleotides of flanking sequence as input. It obtains a score and predicts whether the position is a splice acceptor, a splice donor or neither. Then SpliceAI-10k predicts the acceptor and donor scores of each position in the pre-mRNA sequence of the gene with or without mutation, where the |$\bigtriangleup $|score of the mutation is the maximum change in the score within 50nt of the mutation. Finally, a threshold of |$\bigtriangleup $|score is set to determine whether AS leads to mutation.
The authors applied SpliceAI to RNA-seq data from LCLs from 28 individuals [17]. A total of 21 aberrant splicing events associated with predicted cryptic splicing mutations were found. Of the 21 aberrant AS events, nine new junctions were observed, eight ES, four IR and more complex splicing aberrations were observed.
Experiment of methods for detecting splicing-associated genetic variants
Among the five methods for exploring genetic variation regulating splicing, we only ran sQTLseeker and SpliceAI. We did not run the other three methods for the following reasons: (1) SNPlice misses some files such as files with suffix whl and cannot be run; (2) PVAAS reported a bug with ‘768961 abort (core dumped)’, and it cannot be run; (3) We tested MMsplice on different machines, including a machines with a large memory (256G), and we found that the program were all killed halfway.
For the sQTLseeker, we used ‘Human Brain RNA-seq Dataset’ as input dataset. Finally, we used the pv.svQTL generated by sQTLseeker as a threshold (pv.svQTL > 0.8), and we obtained 44 genes significantly associated with 956 SNPs.
For Splice AI, the results can be directly downloaded in the URL provided by the author (https://basespace.illumina.com/s/5u6ThOblecrh), so we directly got the results of the Splice AI. Finally, we used delta score as the threshold (delta score > 0.9), and we obtained 20 442 genes significantly associated with 3207520 SNPs.
Finally, we show the comparison of the genes obtained by the two methods in Figure 5. The intersection of the two methods is four genes, namely, ENSG00000160145, ENSG00000189223, ENSG00000227617 and ENSG00000233452.
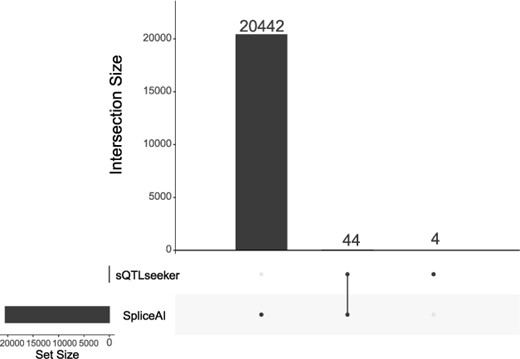
UpSet diagram showing the experiment of methods for detecting splicing-associated genetic variants
DISCUSSION
AS has been receiving more and more attention due to its association with disease. This review focuses on disease-associated AS events. We first summarize the metrics that characterize AS events; then we introduce three categories of methods for different analysis purposes; finally, we do not limit the analysis of AS to RNA level, but at the DNA level to study the effects of genetic variants on it, in order to analyze AS events in more depth.
About the metrics introduced in this article, these metrics can be widely used in a variety of disease-associated AS event analysis, such as differential splicing analysis, aberrant splicing detection and splicing-related network analysis. We also introduce metrics for characterizing complex AS events, which have been shown to be associated with diseases [24]. Although several methods have been developed for characterizing complex splicing events, how to effectively detect and quantify complex splicing events is still challenging and developing novel methods is in need.
Among the disease-associated AS event analysis methods, many methods have been applied to discover disease mechanisms. Among the differential analysis methods, Splice-q was applied to find the difference in SE scores between prostate cancer patients and control samples [21]. And DARTS was applied to study AS events associated with the epithelial-mesenchymal transition (EMT) in prostate cancer cell lines [31]. Of the methods to detect aberrant splicing, FRASER was applied to reprioritize a pathogenic aberrant exon truncation in TAZ from a rare disease dataset [37]. Among the splicing-related network analysis methods, SpliceNet was applied to construct networks for cancer samples and normal samples, respectively, which can help investigate the association of Bcl-x with the SIVA1 gene [9]. For the methods of analyzing the influence of genetic variants on AS events, PVAAS was applied to TCGA prostate cancer RNA-seq data, and 215 SNVs significantly associated with aberrant splicing were detected [16].
At present, there are studies showing that complex AS events are more common in diseases [24]. Therefore, the development of tools to accurately detect and quantify complex AS events is of great significance for the discovery of new disease mechanisms and drug targets. For example, in future work, first we can consider characterizing AS events as a collection of contiguous splice graphs (CSGs) like Whippet [24], but we need to think about how to improve the quality of CSGs by taking into account factors such as read coverage significance that support the edge in CSGs. Then we may use graph complexity characterization methods and graph-based algorithms, such as Graph Embedding, Graph Convolutional Network (GCN) to further characterize complex AS events.
Among the methods used to analyze differential splicing, although most methods have been developed so far, most of them use traditional statistical methods rather than the currently emerging deep learning methods. Applying machine learning and deep learning algorithms to differential splicing analysis, such as DARTS, is a promising direction for future development. Traditional AS-related differential analysis only conducts differential analysis at expression values, while ignoring a large number of biological function annotations (GO functions and KEGG pathways). Pathway analysis is particularly important in the study of disease mechanisms. In future research, we may consider integrating biological function annotations (GO function and KEGG pathway) and expression data. We can then analyze differentially expressed genes and differentially activated pathway.
Among the methods used to detect aberrant splicing, the outlier detection methods are usually used to identify abnormal samples and the features that contribute most to the abnormality of the abnormal sample. However, most of the existing aberrant splicing detection methods are based on significance test, and these methods usually perform the significance test for different features separately, without considering the interaction between the features. Therefore, in future research work, it might be useful to model the interaction between features. For example, first, we can use some feature selection methods, such as methods based on Mutual information and maximal information coefficient (MIC), to find aberrant related feature subsets. We then integrate these features to construct suitable metric to characterize anomalies. Finally, we can perform significance test based on the metric to obtain aberrant splicing-related genes.
In splicing-related network analysis methods, the main problem encountered at present is how to find the network nodes and edges related to the disease. We can use the network-based differential analysis method to solve this problem in the future. First, we can use network construction methods, such as SPIRON, to build networks for two groups of samples such as the control group and the disease group. Then we can develop graph-theory-based methods to analyze the difference between the two networks. An example is to use node centrality to analyze the difference in the importance of each node of the two networks. Finally, we get the disease-related nodes and edges based on the difference between the two networks.
In the methods of analyzing the influence of genetic material on AS events, usually only the link between a single AS event and the corresponding single genetic variant is considered. However, the influence of multiple genetic variants on AS events and the association between these variants have not been well considered. Methods that address this issue is of value to be developed in the future. For example, first, we can detect disease-related AS events through various methods. Then we analyze the association between these AS events and SNPs. Because AS events may be potentially regulated by multiple SNPs, we can analyze the SNPs related to AS events through multivariate analysis methods, such as sparse Partial Least Squares (PLS) which has a built-in functionality of feature selection.
At present, studies on AS mainly focus on bulk RNA-seq, while ignoring the heterogeneity among single cells. AS is an important source of inter-cell gene expression heterogeneity; the analysis of AS events in the single-cell RNA domain can more effectively discover disease mechanisms and understand cell differentiation [54]. But it remains an understudied area due to the lack of computational tools to analyze AS at single-cell resolution. The current bottleneck in the development of AS analysis methods in the field of single cells is that the number of single cells is huge, and methods such as DEXSeq [28] and rMATs [7] cannot be used for pairwise comparisons. And the nonuniform transcript coverage of scRNA-seq (Single-cell RNA sequencing) datasets cannot use other methods that reconstruct isoforms or estimate read dispersion (Cufflflinks [55], TIGAR2 [56]). Therefore in the future, it is hoped that there will be more approaches focusing on AS events in the single-cell domain, such as MARVEL [57] and Expedition [58]
CONCLUSIONS
This work provides a comprehensive overview of computational approaches for analyzing disease-associated splicing. The contributions of this review are summarized next.
First, to the best of our knowledge, the reviews on AS events only focus on a single type of analysis methods. For example, a review written by Joan E Hooper on Human Genomics in 2014 ‘A survey of software for genome-wide discovery of differential splicing in RNA-Seq data” focuses on differential splicing [59]. In contrast to other reviews, we did not limit ourselves to a single type of analysis, but instead described three categories of AS analysis methods, namely, the method for differential splicing analysis, the method for aberrant splicing detection and the method for splicing-related network analysis.
Second, our review provides a systematic overview of AS, from metrics to methods for detecting disease-associated splicing events to genetic variation that influence splicing. We finally discuss the limitations of each type of methods and put forward potential solutions to improve.
Third, in addition to the systematic description of these calculation methods, we also conducted experiments on each type of methods to further compare these methods.
We hope that this review can provide a systematic understanding of computational approaches for analyzing disease-associated splicing, which is useful for future research efforts.
A comprehensive review of metrics and tools for the analysis of alternative splicing events is lacking. We review the metrics for characterizing alternative splicing, the methods for detecting disease-associated splicing events and the methods for analyzing the effects of genetic variants on alternative splicing events.
We summarize a variety of metrics to characterize different features of alternative splicing events.
We divide the tools for analyzing alternative splicing events into three types, namely differential splicing analysis, aberrant splicing detection and splicing-related network analysis. Three types of tools can be used to analyze alternative splicing events for different analysis scenarios.
We summarize methods for analyzing the effects of genetic variation on alternative splicing events, which can help people to further study the mechanism of alternative splicing.
We conducted experimental comparison for each type of methods to illustrate their performance.
AUTHOR CONTRIBUTIONS STATEMENT
HDL and JL: conceptualization. JL: Investigation, writing original draft. CXL, WH, YG, JL, and HDL: review and editting. JL, XZ and ZL: data collection and experiments.
FUNDING
The authors thank the anonymous reviewers for their valuable suggestions. This work is supported by STI2030-Major Projects (No. 2022ZD0213700) and the Natural Science Foundation of Changsha (No. kq2202105). The computational resource at the High Performance Computing Center of Central South University is also gratefully acknowledged.
DATA AVAILABILITY
Data used in this study were downloaded from public databases that have been described in the main text.
Author Biographies
Jiashu Liu received the BEng degree from Central South University, China in 2021. She is currently a master student in bioinformatics at Central South University. Her research area is alternative splicing events detection.
Cui-Xiang Lin received the BEng and MEng degrees both from Central South University in 2008 and 2010, respectively. She is currently a PhD candidate at Central South University. Her research interests include identification of biomarkers of disease and disease mechanism.
Xiaoqi Zhang is currently a master student in School of Computer Science and Engineering, Central South University, Changsha, Hunan, P.R. China. His research area is computational biology.
Zongxuan Li received the BSng degree from Northeastern University, China in 2022. He is currently a master student in bioinformatics at Central South University. His research area is computational biology. Wenkui Huang received the BEng degree from Central South University, China in 2021. He is currently a master student in bioinformatics at Central South University. His research area is computational biology.
Jin Liu received the Ph.D. degree in computer science from Central South University, Changsha, Hunan, China, in 2017. He is currently an Associate Professor at the School of Computer Science and Engineering, Central South University. His current research interests include medical image analysis, bioinformatics, and machine learning.
Yuanfang Guan is an associate professor of Computational Medicine and Bioinformatics. Her researches are published in top journals including Science, Nature Machine Intelligence and Nature Communications. Her team has written the majority of the best-performing/award-winning algorithms in DREAM challenges, the largest systems biology benchmark study.
Hong-Dong Li received the BEng and PhD degrees both from Central South University. He is currently an associate professor at School of Computer Science and Engineering, Central South University. His research interests include bioinformatics and machine learning. He has published over 80 papers in journals including Nature Genetics, Alzheimer’s Dementia and Briefings in Bioinformatics. According to Google Scholar, his publications have received over 6000 citations with H-index=32.
References
Author notes
Jiashu Liu and Cui-Xiang Lin contributed equally to this work.
