


Abstract
Cooperative driver pathways discovery helps researchers to study the pathogenesis of cancer. However, most discovery methods mainly focus on genomics data, and neglect the known pathway information and other related multi-omics data; thus they cannot faithfully decipher the carcinogenic process. We propose CDPMiner (Cooperative Driver Pathways Miner) to discover cooperative driver pathways by multiplex network embedding, which can jointly model relational and attribute information of multi-type molecules. CDPMiner first uses the pathway topology to quantify the weight of genes in different pathways, and optimizes the relations between genes and pathways. Then it constructs an attributed multiplex network consisting of micro RNAs, long noncoding RNAs, genes and pathways, embeds the network through deep joint matrix factorization to mine more essential information for pathway-level analysis and reconstructs the pathway interaction network. Finally, CDPMiner leverages the reconstructed network and mutation data to define the driver weight between pathways to discover cooperative driver pathways. Experimental results on Breast invasive carcinoma and Stomach adenocarcinoma datasets show that CDPMiner can effectively fuse multi-omics data to discover more driver pathways, which indeed cooperatively trigger cancers and are valuable for carcinogenesis analysis. Ablation study justifies CDPMiner for a more comprehensive analysis of cancer by fusing multi-omics data.
INTRODUCTION
Cancer, one of the most deadly diseases, has a very complex formation and development mechanism; it involves whole genetic levels of life activities, such as genome, transcriptome and epigenome [1]. With the development of high-throughput sequencing technology, large-scale cancer genome projects (i.e. The Cancer Genome Atlas (TCGA) [2] and International Cancer Genome Consortium (ICGC) [3]) have accumulated abundant high-throughput multi-omics cancer data, which enables researchers to study cancer pathology at the molecular level. Existing studies have recognized that cancer is caused by the accumulation of mutations. These mutations that promote the occurrence of cancers are called driver mutations, and the genes with driver mutation sites are called driver genes [4]; they are key genetic markers for deciphering the pathogenesis of cancers. These drivers have important clinical and application values in many aspects, including cancer diagnosis, drug development and personalized treatment [5]. However, it is too expensive and infeasible to identify drivers by solely wet-lab experiments. Hence, developing computational methods to effectively discover cancer drivers has attracted increasing attention.
Earlier research mainly focuses on identifying single driver genes with high frequency mutations [6]. However, cancer is an extremely complex disease caused by the combination of multiple genetic factors, with great heterogeneity of mutations among genes. It is difficult to explore the pathogenesis of cancer by individual driver genes. Recent studies have confirmed that driver genes usually work together in biological pathways, and the heterogeneity of genes tends to affect only a very limited number of pathways. Cancer is often triggered by the disorder of only a small number of pathways, which are termed as driver pathways [7]. It is more plausible to study cancer’s genetic mechanisms by recognizing these driver pathways.
Mutations are the root cause of cancer. The preliminary study confirms that a driver pathway has the following two mutation characteristics [8]: (i) high coverage, most patients have some mutations of genes in the pathway; (ii) high exclusivity, genes in the pathway are generally not mutated at the same time for the same patient. Based on these characteristics, Dendrix [8] defines a weight function to directly measure the high coverage and exclusivity, and identifies the gene sets with the largest weight as driver pathways. MDPfinder [9] further uses gene expression data based on Dendrix and binary linear programming (BLP) to more accurately solve the weight problem.
The aforementioned methods mainly focus on identifying individual/single pathways. However, the formation and development of cancers are more impacted by the synergy of multiple pathways with genetic regulation or functional cooperation [10]. Therefore, discovering cooperative driver pathways can more comprehensively decipher the pathology of cancer. Multi-Dendrix [11] extends Dendrix and uses integer linear programming to simultaneously detect multiple gene sets as the cooperative driver pathways. CoMDP [12] combines the high co-occurrence between modules with the high coverage and exclusivity within modules, and uses BLP to identify the gene sets as the cooperative driver pathways. MCSS [13] redefines the maximum weight gene set problem as a combinatorial optimization problem with continuous and non-convex relaxation cost function to discover driver pathways. CDPath [14] firstly obtains gene sets with high exclusivity, then employs the relationship between genes and known pathways to discover cooperative pathways. CoPath [15] identifies gene sets with the same downstream events, then applies biclustering on these sets and takes the sets grouped into the same cluster as cooperative driver pathways.
Although these methods have made some progress and achieved promising results, they neglect the important genetic pieces of information in verified biological pathways, such as crucial molecular regulations and known inter-pathway cooperations [16], which describe key life activities necessary for oncogenic transformation and thus are essential for cancer research. Furthermore, they mainly use the gene-related data, and disregard other key molecules (i.e. micro RNAs (miRNAs) and long noncoding RNAs (lncRNAs)) in carcinogenesis, which also contain rich genetic information for deciphering cancer [17, 18]. Under these considerations, CDPLP [19] firstly uses hierarchical clustering to obtain the cooperative gene sets, then uses link prediction on a multiplex network composed of genes, pathways and miRNAs to enrich the relations between pathways. CDPathway [20] firstly quantifies the driver weight of genes, then decomposes the block affinity matrices of a heterogeneous network composed of genes, pathways and miRNAs to reconstruct the cooperation between pathways. They both confirm the significance of pathway and miRNA information, but they only use the links between molecules, and disregard the pathways topology and rich/heterogeneous attributes of these molecules, which help to more comprehensively explore cancer-related information and discover driver pathways.
To solve these problems, we propose CDPMiner to discover cooperative driver pathways by attributed multiplex network embedding, which can integrate multi-type omics data at a finer granularity. CDPMiner first optimizes gene–pathway relations based on the pathway internal topology to avoid the negative influence of unimportant genes, which is usually ignored by existing methods. Then, it performs deep joint matrix factorization to embed an attributed multiplex network composed of nodes of molecules (i.e. genes, miRNAs and lncRNAs) and pathways and reconstructs the pathway interaction network using the embedding nodes. This factorization and reconstruction can fuse the link and attribute information of multi-type molecules, and mine more essential information of cooperative pathways. After that, CDPMiner leverages the reconstructed network and mutation data to quantify driver weight between pathways and to discover cooperative pathways. Experimental results on Breast invasive carcinoma (BRCA) and Stomach adenocarcinoma (STAD) datasets show that CDPMiner can more effectively fuse multi-omics data to accurately discover cooperative driver pathways and driver genes than competitive methods [8, 9, 11–13, 20]. Moreover, the discovered pathways are involved in carcinogenesis and several key biological processes, which indeed drive target cancers, worthy of further exploration and analysis. Ablation study justifies CDPMiner on more comprehensively analyzing carcinogenesis process by integrating multi-type omics data.
METHODS
CDPMiner aims to discover cooperative driver pathways by integrating multi-type omics data. It first uses the topological relations of genes in the pathways to optimize gene–pathway relations. Then, it constructs an attributed multiplex network to model the relational and attribute data, and embeds them by deep joint matrix factorization, then reconstructs the pathway interaction network. Finally, it defines comprehensive driver weight with reference to multiple criterion of driver pathways and reconstructed pathway network to discover the cooperative driver pathways. The overall workflow of CDPMiner is illustrated in Figure 1. The following subsections elaborate on its technical details. The mainly used notations are listed in Table 1.
Main notations and their meanings
| Notation | Definition |
|---|---|
| |$\mathcal{R}$|/|$\mathcal{X}$| | Collection of relational/attribute data matrices |
| |$\mathbf{R}_{i j}$|/|$\mathbf{\widehat{R}}_{i j}$| | Initial/Reconstructed relational data matrices between |$i$|-th and |$j$|-th object type |
| |$\mathbf{X}_{i t}$|/|$\mathbf{\widehat{X}}_{i t}$| | Initial/Reconstructed |$t$|-th attribute data matrix of the |$i$|-th object type |
| |$\mathbf{P}$|/|$\widehat{\mathbf{P}}$| | Initial/Reconstructed pathway interaction network |
| |$\mathbf{A}$|/|$\widehat{\mathbf{A}}$| | Initial/Weighted gene-pathway relational matrix |
| |$\mathbf{G}_{i}$| | Embedding vector of the |$i$|-th object type |
| |$\mathbf{U}_{it}$| | Embedding vector of |$t$|-th attribute type of the |$i$|-th object type |
| |$\mathbf{M}$|/|$\mathbf{M}^{p}$| | Mutation data matrix of all genes/pathway |$p$| |
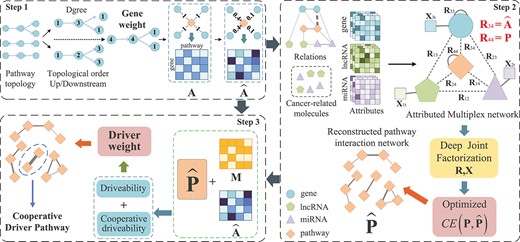
Workflow of CDPMiner for discovering cooperative driver pathways. Step 1: CDPMiner first optimizes gene–pathway relations |$\widehat{\mathbf{A}}$| by pathway topology. Step 2: CDPMiner constructs an attributed multiplex network and embeds it to fuse multi-omics data for reconstructing the pathway interaction network |$\widehat{\mathbf{P}}$|. Step 3: CDPMiner defines the driveability within and between pathways based on mutation data |$\mathbf{M}$| and reconstructed network |$\widehat{\mathbf{P}}$| to discover cooperative driver pathways.
Gene–pathway relations optimization
Due to limited pathway-level data in driver pathway discovery, researchers often map abundant genomics data to pathway-level via gene–pathway relations to enrich the cooperation between pathways [19, 20]. The gene–pathway relations are typically encoded by an indicator matrix |$\mathbf{A}\in \mathbb{R}^ {n_{g} \times n_{p}}$| (|$n_{g}$| and |$n_{p}$| are the number of genes and pathways). For gene |$g$| and pathway |$p$|, if |$g$| in |$p$|, |$\mathbf{A}_{gp}$| =1; otherwise, |$\mathbf{A}_{gp}$|=0.
Although |$\mathbf{A}$| preserves the affiliation between genes and pathways, it implies that each gene in a pathway is equally important, which is inconsistent with the biological fact. For instance, TP53 plays a more important role than other genes in the p53 pathway [21]. This defect may cause pathway-level studies being interfered by unimportant genes, making it difficult to reasonably utilize gene-level information. Therefore, CDPMinder quantifies the importance of each gene in each pathway based on the following pathway-related biological knowledge: (i) genes in an upstream position in the pathway can perturb downstream genes and have a greater impact on the pathway; (ii) genes with more functional interactions in the pathway are more important. Based on the regulation relationship of genes in the pathways, CDPMiner can construct gene regulatory network and obtain the pathway internal topology based on the regulatory network structure, including degree, topological order and up/downstream relationships of genes within the pathway, and evaluate the importance of different genes in a pathway as
where |$Dgree(g,p)$|, |$Down(g,p)$| and |$Order(g,p)$| are the degree, number of downstream genes and topological order of gene |$g$| within pathway |$p$|. |$Dgree(g,p)$| equals the number of genes directly interacting with |$g$| in regulation network. Downstream genes of |$g$| are the genes regulated by |$g$|. |$Order(g,p)$| equals the rank of |$g$| in topological sorting within the regulation network. In this way, genes with larger degree, more downstream genes and higher topological order (lower |$Order(g,p)$| value) are more consistent with the above knowledge; they have regulatory or cooperative relationships with more genes and are therefore more important for pathway-level analysis. The weighted gene–pathway relational matrix |$\widehat{\mathbf{A}}$| can reduce the interference of less important genes in the discovery of cooperative pathways. To simplify the computation and support the pathway-level analysis, we perform min–max normalization on each column of |$\widehat{\mathbf{A}}$| before its follow-up usage.
Multiplex network embedding
Besides genes, cancers are also regulated by other molecules (i.e. miRNAs and lncRNAs). These molecules interact with genes, and have abundant heterogeneous genetic features (gene expression/methylation, interactions between molecules). The rich cancer-related information contained in these molecules make them key components of pathways and the effective use of them is helpful for the study of carcinogenesis mechanisms.
Although several recent methods have noticed these important molecules [19, 20], they mainly focus on the relations between molecules or mutation profiles, and usually convert heterogeneous molecular data into intra-relational data to perform homogeneous network embedding for multi-omics data fusion. Moreover, these methods usually lack a good leverage of the rich attributes of molecules. Therefore, they usually suffer the loss of genetic information and have a compromised performance. To handle these issues, we first construct an attributed multiplex network [22] to comprehensively model these molecules and then fuse the topology and attributes of nodes by network embedding. An attributed multiplex network composed of |$m$| types of molecules can be described by two types of data matrices:
(i) Relational data matrices encode the intra/inter-relations between molecules of the same/different types. |$\mathcal{R}$| stores the collection of all relational data matrices. |$\mathbf{R}_{i j} \subset \mathcal{R}\left (\mathbf{R}_{i j} \in \mathbb{R}^{n_{i} \times n_{j}}\right )$| encodes links between |$n_{i}$| molecules of type |$i$| with |$n_{j}$| molecules of type |$j$|. If |$s\in \left \{1,2, \cdots , n_{i}\right \} $| and |$c\in \left \{1,2, \cdots , n_{j}\right \}$| have a link, |$\mathbf{R}_{i j}(s, c)>0 $|; otherwise, |$\mathbf{R}_{i j}(s, c)=0$|. So |$\widehat{\mathbf{A}}$| is a relational data matrix.
(ii) Attribute data matrices encode the heterogeneous attributes of molecules. |$\mathcal{X}$| stores the collection of all attribute data matrices. |$\mathbf{X}_{i t} \subset \mathcal{X}$| stores different attribute data matrices of |$i$|-th type molecules, where |$\mathbf{X}_{i t} \in \mathbb{R}^{n_{i} \times d_{i t}}, t \in \left \{1,2, \cdots , t_{i}\right \}$|, |$t_{i}$| is the number of attribute matrices for |$i$|-th type molecule and |$d_{i t}$| is the number of features for this matrix. For example, |$\mathcal{X}$| includes the gene expression/sequence data.
As shown in Figure 1, the attributed multiplex network includes four types of nodes: three types of molecules (genes, miRNAs and lncRNAs) and pathways. We first construct an attributed multiplex network based on the collected relational/attribute data. Then, based on mutation frequency and known cancer-related molecules (miRNAs and lncRNAs), we remove molecules and links not related to the studied cancer to obtain the multiplex network with reduced size and improved quality. More details of collected data and preprocessings are given in the Data and Code availability.
Most multiplex network-based methods usually convert attribute data matrices into homogeneous similarity networks, which causes information loss [23]. Some recent techniques based on joint matrix factorization address the problem, but they also have problem in exploring nonlinear relationships between nodes [22]. To more comprehensively fuse multi-omics data and mine the cancer-related information from attributed multiplex network, we propose a deep joint matrix factorization based solution to collaboratively decompose all data matrices to obtain low-dimensional representations of nodes, which can reduce the negative impact of noisy links and attributes. In particular, the relational and attribute data matrices are embedded as
where |$\mathbf{G}^{0}_{ij}$| and |$\mathbf{U}^{0}_{i t}$| are the initial embedding vectors obtained by principle component analysis on |$\mathbf{R}_{ij}$| and |$\mathbf{U}_{it}$|. |$\mathbf{N}_{i 1}$| and |$\mathbf{N}_{i t 1}$| are the first layer network parameter matrices for the |$i$|-th type of molecules and its |$t$|-th type of attributes, |$\mathbf{N}_{i L}$| and |$\mathbf{N}_{i t L}$| are parameter matrices for the |$L$|-th layer, respectively. |$b_{i 1}, b_{i t 1}, \cdots , b_{i L}, b_{i t L}$| are the biases. |$f_{i 1}, f_{i t 1}, \cdots , f_{i L}, f_{i t L}$| are activation functions, which help to mine nonlinear relationships between molecule nodes. Through Eq. (2), we can get |$\mathbf{G}_{i} \in \mathbb{R}^{n_{i} \times k}$| and |$\mathbf{U}_{it} \in \mathbb{R}^{d_{it} \times k}$| as the embedding vectors of the |$i$|-th type of molecules and its |$t$|-th type of attributes.
Following [24], we use these embedding vectors to reconstruct the multiplex network via cosine similarity:
where |$\mathbf{\widehat{R}}_{i j}\in \mathbb{R}^{n_{i} \times n_{j}}$|/|$\mathbf{\widehat{X}}_{i t} \in \mathbb{R}^{n_{i} \times d_{i t}}$| are the reconstructed relational/attribute data matrices. Since |$\mathbf{G}_{i}$| is shared and coordinated by relational and attribute data of multi-type molecules, the adopted deep joint matrix factorization can fuse multi-omics data in a more sensible way.
The derivation of Binary Cross Entropy (BCE) is simple and suitable for optimization via back propagation [25]. Since BCE can only be applied to binary data matrices, we further update it to fit our case to measure the difference between the initial matrices and the reconstructed ones. We use |$\mathbf{Z}$| to uniformly represent |$\mathbf{R}_{i j}$| or |$\mathbf{X}_{i t}$|:
where |$\mathbf{Z}$|/|$\mathbf{\widehat{Z}} \in \mathbb{R}^{n_{i} \times n_{j}}$| is the initial/reconstructed data matrix. The above equation forces the reconstructed |$\widehat{\mathbf{Z}}$| to approximate the initial |$\mathbf{Z}$|. The second term of Eq. (4) is always zero when |$\mathbf{Z}_{s c}>0$|, and optimizing the first term makes |$\widehat{\mathbf{Z}}_{s c}$| converging to |$\mathbf{Z}_{s c}$|. Similarly, the first term of Eq. (4) is zero when |$\mathbf{Z}_{s c}=0$|, and optimizing the second term makes |$\widehat{\mathbf{Z}}_{s c}$| converging to zero.
Based on the above definitions, we can define the loss function of deep joint matrix factorization for multiplex network embedding as
where |$\mathbf{P}$|/|$\widehat{\mathbf{P}}$| are the initial/reconstructed adjacency matrix of pathway interaction network. |$\lambda $| is a scalar parameter to control the proportion of |$\mathbf{P}$|-related loss. Each entry of |$\mathbf{W}^{r} \in \mathbb{R}^{m \times m}$| is used to adjust the loss of the corresponding relational data matrix except |$\mathbf{P}$|. Similarly, |$\mathbf{W}^{h} \in \mathbb{R}^{m \times \max _{i} t_{i}}$| stores the weights assigned to attribute data matrices. Compared with other network embedding-based methods [19, 20] that convert heterogeneous data matrices into homologous networks, Eq. (5) can directly and collaboratively embed the whole attributed multiplex network to more comprehensively mine multi-type omics data. In addition, the two weight matrices |$\mathbf{W}^{r}$| and |$\mathbf{W}^{h}$| can auto-weight relevant data matrices and reduce the negative impact of noisy ones. For |$\mathbf{R}_{i j} \notin \mathcal{R}$| or |$\mathbf{R}_{i j}=\mathbf{P}$|, |$\mathbf{W}_{i j}^{r}=0$|. For |$\mathbf{X}_{i t}$|, if |$t>\max _{i} t_{i}, \mathbf{W}_{i t}^{h}=0$|.
We randomly parameterize |$L$| layers neural network and set up the embedding vectors |$\mathbf{G}_{i}$| and |$\mathbf{U}_{it}$| by principle component analysis. Next, we reconstruct |$\mathbf{\widehat{R}}_{i j}$| and |$\mathbf{\widehat{X}}_{i t}$| to calculate the loss of Eq. (5), and use back propagation to optimize the loss, network parameters and embedding vectors in an iterative way. We finally obtain the reconstructed pathway interaction network |$\widehat{\mathbf{P}}$|, which encodes enriched cooperative relations between pathways for follow-up cooperative driver pathways discovery.
Cooperative driver pathways discovery
Cooperative driver pathways typically have the following characteristics [26]: (i) high mutation coverage and exclusivity within pathways; (ii) high mutation co-occurrence between pathways; (iii) strong functional cooperation between pathways. The first two can be measured from mutation data matrix |$\mathbf{M}$|, and the last one can be induced from the reconstructed pathway network |$\widehat{\mathbf{P}}$|. Hence, we leverage |$\mathbf{M}$| and |$\widehat{\mathbf{P}}$| to quantify the driveability within/between pathways.
Since |$\widehat{\mathbf{A}}$| weighs different genes and enriches the gene–pathway relations, for pathway |$p$|, we construct its unique mutation data as
where |$\mathbf{M}\in \mathbb{R}^ {n_{g} \times n_{s}}$| is the initial gene mutation data matrix, |$n_{g}$| and |$n_{s}$| are the number of genes and samples (patients), respectively. If gene |$g$| is mutated on sample |$s$|, |$\mathbf{M}_{g s}=1$|; otherwise |$\mathbf{M}_{g s}=0$|. |$\widehat{\mathbf{A}}_{\cdot p}$| is the |$p$|-th column of |$\widehat{\mathbf{A}}$|, which encodes the optimized relations between |$p$| and related genes. |$\mathbf{M}^{p}\in \mathbb{R}^ {n_{g} \times n_{s}}$| is the unique mutation data matrix of |$p$|, which will be used to measure the various mutation properties of |$p$|.
For a single pathway |$p$|, we use |$\mathbf{M}^{p}$| to optimize the weight function defined by Vandin et al. [8] to quantify its driveability by exclusivity and coverage as follows:
where |$max()$| represents the maximum value of the matrix by column, |$\Gamma (p)$| measures the coverage of |$p$| and |$\mathbf{M}^{p}_{g \cdot }$| is the |$g$|-th row |$\mathbf{M}^{p}$|. So |$\Gamma (p,g)$| measures the coverage of gene |$g$| in pathway |$p$|, |$\eta (p)$| quantifies the overlapped coverage of |$p$|, the higher the |$\eta (p)$| is, the lower the mutual exclusivity of |$p$| is. |$Driver(p) $| considers both high exclusivity and coverage of |$p$|, so it can more accurately measure the driveability of |$p$|.
For a given pathway pair |$p_{x}$| and |$p_{y}$|, we measure their cooperative driveability |$CoDriver(p_{x},p_{y})$| by functional cooperation and high mutation co-occurrence:
|$[\mathbf{M}^{p_{x}};\mathbf{M}^{p_{y}}]$| means the vertical splicing of |$\mathbf{M}^{p_{x}}$| and |$\mathbf{M}^{p_{y}}$|, |$\Gamma (p_{x}, p_{y})$| quantifies the coverage of pathway |$p_{x}$| and |$p_{y}$|, |$\mathbf{O}_{p_{x} p_{y}}$| measures the overlapping coverage (mutation co-occurrence) of |$p_{x}$| and |$p_{y}$|. |$\widehat{\mathbf{O}}$| represents the normalized |$\mathbf{O}$|, which is done for the convenience of parameter analysis and subsequent calculation. |$\widehat{\mathbf{P}}$| is the reconstructed pathway interaction network, and it encodes the cooperative functional interaction between pathways. Parameter |$\alpha $| is used to balance the effect of functional cooperation and mutation co-occurrence.
By integrating the driveability within/between pathways, we can define the composite driver weight to quantify the driveability of a pathway pair |$p_{x}$| and |$p_{y}$|.
where |$\widehat{\mathbf{E}}$| is the normalized |$\mathbf{E}$|, |$\beta $| balances the driveability and cooperative driveability. To this end, we can directly measure the cooperation between driver pathways and select the pathway pairs with high driver weights in |$\widehat{\mathbf{P}}$| as cooperative driver pathways.
For completely understanding CDPMiner, we summarize its overall algorithmic procedure in Algorithm 1. Line 1 optimizes the gene–pathway relations by pathway internal topology; Lines 2–14 embed the attributed multiplex network by deep joint matrix factorization and reconstruct the pathway interaction network using embedding nodes; Lines 15–17 define the driver weight of single pathways and pathway pairs by integrating the driveability within/between pathways; Line 18 discovers the cooperative driver pathways using the quantified weights.

RESULTS AND VALIDATION
We conduct experiments on TCGA BRCA and STAD datasets to evaluate the performance of CDPMiner; the details of used datasets are given in the Section of Data and Code availability. We adopt a three-layer neural network with LeakyReLU as the active function and set the embedding dimension |$k=70$| [22]. There are three important parameters: |$\lambda $| in Eq. (5) controls the proportion of |$\mathbf{P}$|-related loss, |$\alpha $| in Eq. (8) and |$\beta $| in Eq. (9) adjust the driver weight. In our experiments, |$\lambda $| is set as 10 on both datasets; |$\alpha $| and |$\beta $| are set as 0.3 and 0.3 on BRCA dataset; and as 12 and 7 on STAD dataset. Due to page limit, the settings of these parameters are given in the Supplementary file. We take the top 10 pathway pairs with the highest weights as cooperative driver pathways. Tables 2 and 3 report the results on BRCA dataset and STAD dataset and show the verified driver genes [27] of these pairs.
Cooperative driver pathways discovered by CDPMiner and verified genes in these pathways. Genes affiliated with both pathways are highlighted in boldface.
| No | Pathway | Verified genes |
|---|---|---|
| 1 | p53 pathway | AKT1, ATM, EP300, TP53 |
| IL12-mediated signaling events | MAP2K4, MAP3K1, MTOR PIK3CA, PIK3R1, RB1 | |
| 2 | Nectin adhesion pathway | CDH1,PIK3CA,PIK3R1 |
| ErbB receptor signaling network | ERBB2, ERBB3 | |
| 3 | EGFR-dependent Endothelin signaling events | AKT1,MTOR |
| C-MYB transcription factor network | CCND1, CDKN1B, EP300GATA3, KRAS, MYC, NCOR1 | |
| 4 | Signaling events mediated by focal adhesion kinase | AKT1, CCND1, ESR1KRAS, MAP2K4, MAP3K1PIK3CA,PIK3R1,PTEN |
| BARD1 signaling events | ATM,BRCA1,TP53 | |
| 5 | Rapid glucocorticoid signaling | / |
| HIF-2-|$\alpha $| transcription factor network | EP300 | |
| 6 | Effects of Botulinum toxin | ERBB2,ERBB3 |
| E-cadherin signaling in keratinocytes | AKT1, CDH1, ERBB2, ERBB3KRAS, PIK3CA, PIK3R1 | |
| 7 | Reelin signaling pathway | AKT1, ESR1, KRAS, PIK3CAPIK3R1, PTEN, RARA |
| Atypical NF-|$\kappa $|B pathway | PIK3CA, PIK3R1 | |
| 8 | Validated transcriptional targets of TAp63 isoforms | EP300 |
| PLK3 signaling events | ATM,TP53 | |
| 9 | PAR4-mediated thrombin signaling events | ERBB2, ERBB3, KRAS |
| Insulin-mediated glucose transport | AKT1 | |
| 10 | Validated transcriptional targets of |$\delta $|Np63 isoforms | ATM, BRCA2, RUNX1 |
| FOXA2 and FOXA3 transcription factor networks | AKT1, FOXA1, NF1 |
Cooperative driver pathways discovered by CDPMiner and verified genes in these pathways (STAD). Genes affiliated with both pathways are highlighted in boldface.
| No | Pathway | Verified genes |
|---|---|---|
| 11 | Direct p53 effectors | APC, CREBBP, EP300EPHA2, PMS2, PTEN, TP53 |
| IL2 signaling events mediated by STAT5 | MYC, PIK3CA, PIK3R1 | |
| 12 | p53 pathway | ABL1, ATM, ATR, CHEK2CREBBP, EP300, TP53 |
| IL12-mediated signaling events | BRAF, ERBB4, JAK2MTOR, PIK3CA, PIK3R1 | |
| 13 | C-MYC pathway | AXIN1, FBXW7, MYC |
| IL3-mediated signaling events | JAK2, PIK3CA, PIK3R1 | |
| 14 | Atypical NF-|$\kappa $|B pathway | PIK3CA, PIK3R1 |
| IL5-mediated signaling events | JAK2, PIK3CA, PIK3R1 | |
| 15 | Visual signal transduction: Rods | JAK2 |
| Validated targets of C-MYC transcriptional repression | CCND1, EP300, ERBB2MYC, SMAD2, SMAD4 | |
| 16 | IGF1 pathway | CDH1, CTNNB1, CTNND1EPHA2, ERBB2, ESR1, JAK2KRAS, MTOR, PIK3CA, PIK3CBPIK3R1, PTEN, RASA1, RHOA |
| PDGFR-|$\alpha $| signaling pathway | ERBB2, ERBB3, JAK2, KRASPIK3CA, PIK3R1, RHOA | |
| 17 | Visual signal transduction: Cones | JAK2 |
| IL23-mediated signaling events | ERBB4, JAK2, MTOR, PIK3CA, PIK3R1 | |
| 18 | PAR4-mediated thrombin signaling events | EPHA2, ERBB2ERBB3, KRAS, RHOA |
| FOXM1 transcription factor network | BRCA2, CCND1, CDK4, CHEK2CREBBP, EP300, ESR1, MYC | |
| 19 | Thromboxane A2 receptor signaling | CTNNB1, ERBB2, ERBB3, KRASNF1, PIK3CA, PIK3R1, RHOA |
| Calcineurin-regulated NFAT-dependent transcription in lymphocytes | CDK4, GATA3 | |
| 20 | Degradation of |$\beta $| catenin | APC, AXIN1, AXIN2CTNNB1, CUL1 |
| BARD1 signaling events | ATM, ATR, TP53 |
Results at the gene level
CDPMiner can discover significant cancer driver genes and pathways. At the gene level, there are 27 verified key BRCA driver genes and 39 verified key STAD driver genes within the driver pathways discovered by CDPMiner. Almost all (19/20=95%) driver pathways on BRCA dataset and all driver pathways on STAD dataset contain one or more driver genes, which are closely related to the occurrence and development of cancers. On BRCA dataset, for example, BRCA1 and BRCA2 are the representative driver genes of BRCA, and their germline mutations can increase the probability of breast cancer occurrence [28]. Overexpression of ERBB2 can make BRCA resistant to some chemotherapeutic agents [29]. Women with neurofibromatosis (germline NF1 mutations) have a significantly increased breast cancer risk [30]. The mutation of PIK3CA is one of the most common genetic aberrations in BRCA, which exists in more than one-third patients [31]. TP53 is the most well-known tumor suppressor gene, and its mutation status has high clinical value in BRCA [32].
Similarly, results on STAD dataset also contain abundant driver genes. APC is mutated in more than half of gastric cancer patients, and its inactivation plays an important role in the occurrence and development of STAD [33]. As a cancer predisposition gene, germline mutations in CDH1 may affect entire families of carriers and increase their risk of developing hereditary diffuse gastric cancer [34]. ERBB2 is amplified and overexpressed in various gastric cancer subtypes, and targeting it to inhibit cancer cell proliferation is a commonly used treatment for gastric cancer [35]. Similar to ERBB2, ERBB3 and ERBB4 also belong to the ERBB-family (HER-family), and they promote the occurrence of STAD. Activation of ERBB3 is essential for gastric cancer cell proliferation [36], and inhibition of ERBB4 expression can regulate gastric epithelial-mesenchymal transition and metastasis [37]. KRAS’s status correlates with the histological phenotype of gastric cancer, and has been identified as a therapy target for STAD [38]. PIK3CA and TP53, as the most well-known BRCA driver genes, are also important drivers of STAD. High-frequency amplification of PIK3CA is associated with poor prognosis of gastric cancer [39], and mutations in TP53 may lead to reduced immune activities in STAD patients, resulting in unfavorable clinical outcomes [40].
In addition to these verified driver genes, CDPMiner also find some potential driver genes. For instance, pathway pair five contains GNAS, and elevated expression of GNAS may promote the proliferation and migration of BRCA cells via the PI3K/AKT/Snail1/E-cadherin axis [41]. STAT3 in pathway pair 18 is constitutively activated in gastric cancer, and many cytokines and growth factors that promote gastric tumor growth are regulated by STAT3-dependent mechanisms [42]. These driver genes overlap or interact within the discovered cooperative pathway pairs, enable the pathways to cooperate with each other and trigger cancer. These biological facts prove the close relationship between cooperative pathways and studied cancers.
Results at pathway level
At the pathway level, there are also strong pieces of evidence to prove that the discovered driver pathways indeed play an important role in the occurrence and development of cancers. For BRCA, inactivation of TP53 in ‘p53 pathway’ in pathway pair 1(12) is one of the hallmarks of BRCA. Inducing apoptosis of tumor cells by activating the p53 pathway is a feasible option for the treatment of BRCA [21]. The activation of ‘ErbB receptor signaling network’ in pathway pair 2 can regulate EMT (Epithelial mesenchymal transformation) related to invasion and migration in breast epithelial cells, so as to promote the migration, infiltration and extravasation of tumor cells during metastasis [43]. For ‘BARD1 signaling events’ in pathway pair 4, it is essential for BRCA1 stability, intracellular localization and tumor suppressor function [44]. ‘Atypical NF-|$\kappa $|B pathway’ in pathway pair 7 is important for leukemia stem cell survival, and its inhibitors preferentially inhibit breast cancer stem-like cells [45]. ‘PLK3 signaling events’ in pathway pair 8 participates in checkpoint-mediated cell cycle arrest to ensure genetic stability, thereby inhibiting the accumulation of genetic defects to avoid carcinogenic transformation [46]. For ‘FOXA2 and FOXA3 transcription factor networks’ in pathway pair 10, FOXA2 can partially reverse the overexpressed mir-942, thereby reducing the activity, proliferation, migration and invasion of BRCA cells [47].
CDPMiner also finds out cooperative pathways that drive the occurrence of STAD. For ‘Direct p53 effectors’ in pathway pair 11 and ‘p53 pathway’ in pathway pair 12(1), the activation of these two pathways is essential to avoid abnormal proliferation and maintain the normal life state of cells. ‘C-MYC pathway’ in pathway pair 13 and ‘Validated targets of C-MYC transcriptional repression’ in pathway pair 15 can promote the growth and proliferation of gastric cancer cells and help tumor cells maintain malignant phenotype, and the knockdown of C-MYC can restrain the development of gastric cancer [48]. For ‘IGF1 pathway’ in pathway pair 16, IGF1 is a mitogenic and anti-apoptotic factor. By binding to its receptor, IGF-1 phosphorylates the downstream substrates, and plays a pivotal role in the proliferation, progression and metastasis of various cancers [49]. For ‘PAR4-mediated thrombin signaling events’ in pathway pair 18, PAR-mediated thrombin has been proven to be a key supporter of various cellular effects relevant to tumor growth and metastasis, as well as a potent activator of angiogenesis, which is essential for the growth and development of all solid tumor types [50]. For ‘Thromboxane A2 receptor signaling’ in pathway pair 19, Thromboxane A2 plays a very important role as a potent vasoconstrictor and inducer of platelet aggregation and activation through its receptors, and thus is involved in tumor progression, especially tumor cell proliferation, migration and invasion, which are key steps in cancer progression [51]. For ‘Degradation of |$\beta $| catenin’ in pathway pair 20, as a structural component of the E-cadherin-mediated cell–cell adhesion system, deregulated expression and mutation of |$\beta $|-catenin may reduce cell–cell adhesion and separate gastric cancer cells from each other, thereby promoting invasion and metastasis [52].
In addition, similar to the gene level, CDPMiner can also find some potential driver pathways. For pathway pair 5, although ‘Rapid glucocorticoid signaling’ contains no known BRCA driver genes, the activation of the glucocorticoid receptor may be associated with poor prognosis in estrogen receptor-negative breast cancer [53]. Similarly, ‘HIF-2-|$\alpha $| transcription factor network’ also lacks direct evidence of association with breast cancer, but it has been proven that known tumor suppressor Scgb3a1 expression is directly regulated by HIF-2|$\alpha $| in human lung adenocarcinoma cells [54], and both lung adenocarcinoma and breast cancer are adenocarcinomas with similar pathogenesis. Therefore, these pathways are also potential BRCA driver pathways. Moreover, although no experiment confirms that ‘IL23-mediated signaling events’ in pathway pair7 can directly drive the gastric cancer, it contains several STAD driver genes such as JAK2, MTOR, PIK3CA.etc, and IL23 can induce the secretion of IL17, which is involved in the progression of STAD by promoting angiogenesis in the tumor microenvironment [55], and thus may contribute to the pathogenesis of gastric cancer and is potential STAD driver pathway.
Further, these identified driver pathways truly have verified cooperations. For instance, for pathway pair 1(12), ‘p53 pathway’ and ‘IL12-mediated signaling events’, p53 can promote antigen-presenting cell-induced antitumor cytotoxicity by regulating IL-12, and activated antigen-presenting cells (APC) are necessary for cytotoxic T cells to differentiate into effector cells that destroy the tumor [56]. For pathway pair 6, ‘Effects of Botulinum toxin’ and ‘E-cadherin signaling in keratinocytes’, the infection of Botulinum toxin can disrupt the activity of E-cadherin, which maintains adherens junctions between epithelial cells like keratinocytes and is critical for inhibiting cancer proliferation and invasion [57]. For pathway pair 8, ‘Validated transcriptional targets of TAp63 isoforms’ and ‘PLK3 signaling events’, TAp63 and PLK3 both show clear pro-apoptotic activities, and TAp63 belongs to p53 family that is necessary for PLK3 to regulate cell cycle arrest and apoptosis [58]. For pathway pair 11, ‘Direct p53 effectors’ and ‘IL2 signaling events mediated by STAT5’, experiments show that p53 and IL2 have a synergistic effect on tumor regression, and treatment strategies combined delivery of immunomodulatory and antiproliferative genes may be effective [59]. For pathway pair 16, ‘IGF1 pathway’ and ’PDGFR-|$\alpha $| signaling pathway’, the overexpression of PDGFR-|$\alpha $| is responsible for acquiring resistance against BMS-754807, which is an IGF1R inhibitor and has been widely used in cancer therapy [60].
To illustrate the cooperation, we further analyze the pathway pair 1(12), which is identified by CDPMiner on both BRCA and STAD datasets. We visualize the cooperation between genes available on both datasets in pathway pair 1 based on STRING [61] in Figure 2. The solid and dotted lines denote the interactions within and between pathways, and the thickness represents the interaction strength. We can find that the genes within two pathways have strong interactions, which proves the strong pathway cooperation in pathway pair 1(12).
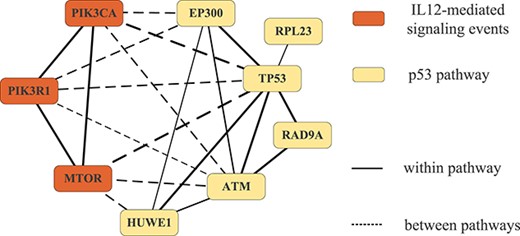
Interactions within/between ‘p53 pathway’ and ‘IL12-mediated signaling events’.
To more intuitively show the association between cooperative pathway pairs and cancers, Table 4 lists cancer-related GO functions [62, 63] and KEGG defined pathways [10] enriched by the cross-pathway interactions and the corresponding genes in pathway pair 1(12). We can find that there are significant cooperations between ‘p53 pathway’ and ‘IL12-mediated signaling events’, and the interactions between pathways are related to a variety of important cancer-related life activities. ‘PI3K-Akt signaling pathway’, ‘JAK-STAT signaling pathway’ and ‘FoxO signaling pathway’ are important cancer-related pathways [16]. ‘Viral carcinogenesis’, ‘Human cytomegalovirus infection’ and ‘Human immunodeficiency virus 1 infection’ are able to reduce people’s immunity and increase the risk of cancer [64, 65]. ‘Cellular senescence’, ‘Negative regulation of cell cycle’, ‘Positive regulation of cell death’ and ‘Positive regulation of cell migration’ are key life processes for carcinogenesis [66].
Cancer-ralated GO functions and KEGG defined pathways enriched by genes in pathway pair 1(12).
| Function/KEGG defined pathway | Genes in pathway pair 1(12) |
|---|---|
| PI3K-Akt signaling pathway | MTOR, PIK3CA, PIK3R1, TP53 |
| JAK-STAT signaling pathway | EP300, MTOR, PIK3CA, PIK3R1 |
| FoxO signaling pathway | ATM, EP300, PIK3CA, PIK3R1 |
| Viral carcinogenesis | EP300, PIK3CA, PIK3R1, TP53 |
| Human cytomegalovirus infection | MTOR, PIK3CA, PIK3R1, TP53 |
| Human immunodeficiency virus 1 infection | ATM, MTOR, PIK3CA, PIK3R1 |
| Cellular senescence | ATM, MTOR, PIK3CA, PIK3R1, RAD9A, TP53 |
| Negative regulation of cell cycle | ATM, EP300, MTOR, RAD9A, RPL23, TP53 |
| Positive regulation of cell migration | ATM, MTOR, PIK3R1 |
| Positive regulation of cell death | ATM, MTOR, RAD9A, TP53 |
Besides this pathway pair, we also choose another representative pathway pair (pair 18 ‘PAR4-mediated thrombin signaling events’ and ‘FOXM1 transcription factor network’ on STAD) as example, and show the cooperations of genes and pathways in this pair in Figure 3. We also list cancer-related GO functions and KEGG defined pathways enriched by cross-pathway interactions and the corresponding driver genes in pathway pair 18 in Table 5.
Cancer-ralated GO functions and KEGG defined pathways enriched by genes in pathway pair 8.
| Function/KEGG defined pathway | Genes in pathway pair 8 |
|---|---|
| Wnt signaling pathway | CCND1, CREBBP, EP300, ESR1, KRAS, MYC, RHOA |
| FoxO signaling pathway | CCND1, CREBBP, EP300, KRAS |
| PI3K-Akt signaling pathway | CCND1, CDK4, EPHA2, ERBB2, ERBB3, KRAS, MYC |
| ErbB signaling pathway | ERBB2, ERBB3, KRAS, MYC |
| TGF-|$\beta $| signaling pathway | CREBBP, EP300, MYC, RHOA |
| MAPK signaling pathway | EPHA2, ERBB2, ERBB3, KRAS, MYC |
| Viral carcinogenesis | CCND1, CDK4, CREBBP, EP300, RHOA |
| Human cytomegalovirus infection | CCND1, CDK4, KRAS, MYC, RHOA |
| Human T-cell leukemia virus 1 infection | CCND1, CDK4, CREBBP, EP300, KRAS, MYC |
| Cellular senescence | CCND1, CDK4, KRAS, MYC |
| Positive regulation of cell cycle | BRCA2, CCND1, CDK4, CHEK2, EP300, RHOA |
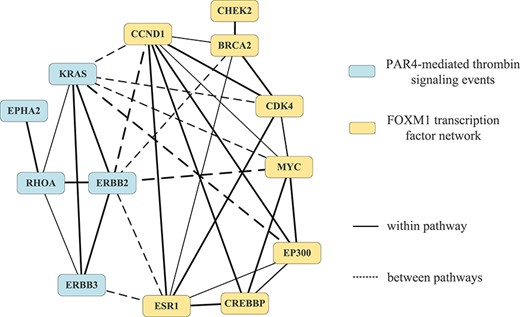
Interactions within/between ‘PAR4-mediated thrombin signaling events’ and ‘FOXM1 transcription factor network’.
Similarly, from Figure 3, we can find that the genes in ‘PAR4-mediated thrombin signaling events’ and ‘FOXM1 transcription factor network’ have strong interactions, which prove the pathway cooperation in pathway pair 18. Table 5 shows that the interactions between them are also related to some important cancer-related life activities. ‘Wnt signaling pathway’, ‘FoxO signaling pathway’, ‘PI3K-Akt signaling pathway’, ‘ErbB signaling pathway’, ‘TGF-|$\beta $| signaling pathway’ and ‘MAPK signaling pathway’ are important cancer-related pathways [16]. ‘Viral carcinogenesis’, ‘Human cytomegalovirus infection’ and ‘Human T-cell leukemia virus 1 infection’ are able to reduce people’s immunity and increase the risk of cancer [64, 67]. ‘Cellular senescence’ and ‘Positive regulation of cell cycle’ are key life processes for carcinogenesis [66].
The above experimental results and analysis show that the pathways discovered by CDPMiner not only indeed drive the occurrence of cancer, but also have verified cooperation within the pathway pairs, which can provide more guidance to the exploration of cancer pathogenesis. CDPMiner can discover the cancer-related cooperative driver pathways.
Comparative result analysis
To quantitatively and comparatively study the performance of CDPMiner, we compare it against six related methods, including Dendrix [8] and MDPfinder [9] for single pathway discovery, and Multi-Dendrix [11], CoMDP [12], MCSS [13] and CDPathway [20] for multiple pathways discovery. The parameters of these methods are set according to their original papers or shared codes. Each compared method repeats multiple times until finding out 10 pairs of pathways. For single pathway discovery methods, we run them twice to get a pair of pathways. We first compare them at the gene level, and Tables 6 and 7 list the number of verified driver genes identified by each method on BRCA dataset and STAD dataset. Precision and Recall are calculated from all identified genes and verified driver ones; F1-score is their harmonic mean, and P-value is calculated by hypergeometric test.
Number of driver genes identified by each method on BRCA dataset.
| Method | Number | Precision | Recall | F1-score | P-value |
|---|---|---|---|---|---|
| Dendrix | 15 | .1500 | .2307 | .1818 | 3.97e-08 |
| MDPfinder | 18 | .1800 | .2769 | .2182 | 6.56e-11 |
| Multi-Dendrix | 11 | .1100 | .1692 | .1333 | 5.54e-05 |
| CoMDP | 20 | .2000 | .3076 | .2424 | 5.98e-13 |
| MCSS | 19 | .1180 | .2923 | .1681 | 4.93e-08 |
| CDPathway | 21 | .1654 | .3231 | .2188 | 9.46e-12 |
| CDPMiner | 27 | .2432 | .4154 | .3068 | 8.42e-20 |
Number of driver genes identified by each method on STAD dataset.
| Method | Number | Precision | Recall | F1-score | P-value |
|---|---|---|---|---|---|
| Dendrix | 15 | .1500 | .1613 | .1554 | 7.30e-06 |
| MDPfinder | 19 | .1900 | .2043 | .1969 | 7.96e-09 |
| Multi-Dendrix | 14 | .1400 | .1505 | .1451 | 3.29e-05 |
| CoMDP | 20 | .2000 | .2151 | .2073 | 1.19e-09 |
| MCSS | 28 | .1250 | .3011 | .1767 | 7.57e-08 |
| CDPathway | 35 | .2035 | .3763 | .2642 | 1.59e-16 |
| CDPMiner | 39 | .3545 | .4194 | .3842 | 8.83e-24 |
According to Table 6, on BRCA dataset, among the compared methods, Multi-Dendrix has the worst performance. It not only recognizes the fewest driver genes, but also has the lowest Precision, Recall, F1-score and largest P-value. That is because it simply finds multiple gene sets with the largest weights, and disregards the cooperation between them. Dendrix performs better than Multi-Dendrix, but it does not identify multiple gene sets simultaneously. MDPfinder uses the gene expression data and considers the co-expression relationship between genes, and thus has a better performance than the first two methods. Among the remaining three methods, although MCSS can obtain multiple driver pathways at the same time by different initial values, its calculation of the initial values is easily trapped, and thus MCSS loses to the other two methods. CoMDP and CDPathway perform similarly, CoMDP introduces the mutation co-occurrence between pathways to help the discovery and CDPathway introduces miRNAs/known pathways data to optimize the cooperation between pathways.
As shown in Table 7, on STAD dataset, Multi-Dendrix again finds the fewest driver genes and gets the worst statistical performance. Dendrix only outperforms Multi-Dendrix. MDPfinder and CoMDP perform almost identically. MCSS obtains more driver genes than MDPfinder and CoMDP, but its corresponding statistical significance index is weaker than them. This may be because MCSS identified too many unverified genes. CDPathway obtains more driver genes and better correlation index than the other compared methods.
Among all methods, CDPMiner identifies more driver genes with the best Precision, Recall, F1-score and P-value. The statistical significance of the driver genes discovered by CDPMiner is extremely better than those of compared methods. That is because the results of compared methods contain too many unverified genes with less importance. CDPMiner avoids the problem by optimizing gene–pathway relations and weighing genes beforehand, thereby enabling more accurate identification of driver genes.
To study whether the identified driver pathways are functionally cooperative and true cancer drivers, we further analyze the KEGG/GO functional enrichment of results using KEGG [10] and GO [62, 63], to check whether the driver pathways identified by CDPMiner and all compared methods are functionally cooperative on both datasets. We use GSEA (Gene Set Enrichment Analysis) [68] to calculate the enrichment significance of cooperative driver pathways on KEGG and GO, expressed as |$p^{e}$|. Three criteria (|$p^{e}$| ¡0.05, |$p^{e}$|¡0.01, |$p^{e}$|¡0.005) are employed to judge whether the entries enriched by these pathways are significant in the enrichment test. We use the proportion of significant KEGG/GO entries within all entries to represent the functional cooperation between pathways under different conditions and report them in Figure 4 and Figure 5.
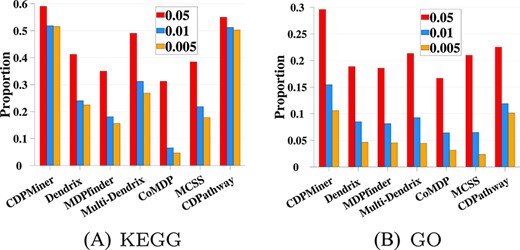
KEGG and GO functional enrichment (BRCA).
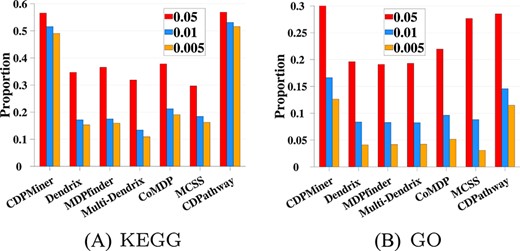
KEGG and GO functional enrichment (STAD).
On BRCA dataset, Figure 4 shows that CDPMiner achieves the best enrichment results on both KEGG and GO; it identifies the most significant entries under three different significance criteria, which confirms that its results have more functional cooperation. The performance of CDPathway is only slightly worse than that of CDPMiner, and is the best among compared methods. In the remaining five compared methods, Multi-Dendrix outperforms the other four methods. Dendrix and MCSS have similar performance, in which Dendrix is slightly better on KEGG, and MCSS is slightly better on GO. The remaining methods enrich the fewest entries, suggesting a lack of cooperation in their results.
On STAD dataset, as shown in Figure 5, the best enrichment results are again obtained by CDPMiner and CDPathway; they identify the most significant entries under three different significance criteria on KEGG and GO, respectively, which confirms that driver pathways discovered by them have broad functional cooperation. MCSS enriches more significant entries than the remaining five methods on GO, but it has the worst performance on KEGG. The other five methods perform similarly poor on KEGG and GO. These comparative experiments at the gene level/enrichment analysis show that the driver pathways discovered by CDPMiner not only contain more verified driver genes, but also have broader cooperative relationships.
Then, to further explore the relationship of the discovered pathways with studied cancers, we list the cancer-related pathways identified by each method in Table 8 and Table 9. We also list the number of pathways and highlight the pathways discovered by CDPMiner in boldface. For methods that just give the results of gene sets, we map their results to known pathways.
Cooperative driver pathways discovered by each method on BRCA.
| Method | Driver pathways | Number |
|---|---|---|
| Dendrix | Atypical NF-|$\kappa $|B pathway, FOXA1 transcription factor network | 8 |
| FOXA2 and FOXA3 transcription factor networks, BMP receptor signaling | ||
| Wnt signaling network, p38 MAPK signaling pathway, Ceramide signaling pathway | ||
| Validated transcriptional targets of |$\delta $|Np63 isoforms | ||
| MDPfinder | Nectin adhesion pathway, ErbB receptor signaling network, mTOR signaling pathway | 8 |
| FOXA2 and FOXA3 transcription factor networks, BARD1 signaling events | ||
| Wnt signaling network, FOXA1 transcription factor network, Regulation of RhoA activity | ||
| Regulation of nuclear beta catenin signaling and target gene transcription | ||
| Multi-Dendrix | Arf1 pathway, p53 pathway, BMP receptor signaling, LKB1 signaling events | 11 |
| ATM pathway, Wnt signaling network, C-MYC pathway, Notch signaling pathway | ||
| IL2 signaling events mediated by STAT5, ErbB receptor signaling network | ||
| FOXA2 and FOXA3 transcription factor networks | ||
| CoMDP | Nectin adhesion pathway, PLK3 signaling events, Wnt signaling network | 11 |
| AP-1 transcription factor network, FOXA1 transcription factor network | ||
| FGF signaling pathway, Atypical NF-|$\kappa $|B pathway, PLK1 signaling events | ||
| ErbB receptor signaling network, IL2 signaling events mediated by STAT5 | ||
| Signaling events mediated by the Hedgehog family | ||
| MCSS | E-cadherin signaling in keratinocytes, N-cadherin signaling events | 12 |
| Canonical NF-|$\kappa $|B pathway, Notch signaling pathway, p53 pathway | ||
| FOXA2 and FOXA3 transcription factor networks, LKB1 signaling events | ||
| C-MYC pathway, Wnt signaling network, BARD1 signaling events | ||
| Validated targets of C-MYC transcriptional repression, ATM pathway | ||
| CDPathway | Signaling events mediated by VEGFR1 and VEGFR2, FGF signaling pathway, SHP2 signaling | 17 |
| p75 (NTR)-mediated signaling, ErbB1 downstream signaling, PDGFR-|$\beta $| signaling pathway | ||
| Class I PI3K signaling events, Integrins in angiogenesis, CDC42 signaling events | ||
| BCR signaling pathway, FAS (CD95) signaling pathway, Signaling events mediated by PTP1B | ||
| Signaling events mediated by focal adhesion kinase, CXCR4-mediated signaling events | ||
| Fc-|$\epsilon $| receptor I signaling in mast cells, Angiopoietin receptor Tie2-mediated signaling | ||
| Signaling events mediated by Hepatocyte Growth Factor Receptor (c-Met) |
Cooperative driver pathways discovered by each method on STAD.
| Method | Driver pathways | Number |
|---|---|---|
| Dendrix | Effects of Botulinum toxin, IL2 signaling events mediated by STAT5 | 9 |
| Regulation of RhoA activity, AP-1 transcription factor network | ||
| p75 (NTR)-mediated signaling, Regulation of RAC1 activity | ||
| Integrin family cell surface interactions, EPHA forward signaling | ||
| Calcineurin-regulated NFAT-dependent transcription in lymphocytes | ||
| MDPfinder | Nectin adhesion pathway, ErbB4 signaling events, EPHA forward signaling | 11 |
| AP-1 transcription factor network, PAR4-mediated thrombin signaling events | ||
| Osteopontin-mediated events, Signaling events mediated by HDAC Class I | ||
| Integrin family cell surface interactions, ErbB receptor signaling network | ||
| Validated targets of C-MYC transcriptional repression, SHP2 signaling | ||
| Multi-Dendrix | Aurora A signaling, p75 (NTR)-mediated signaling, LKB1 signaling events | 9 |
| |$\beta $|1 integrin cell surface interactions, ErbB receptor signaling network | ||
| Validated targets of C-MYC transcriptional activation, ATM pathway | ||
| IL27-mediated signaling events, p73 transcription factor network | ||
| CoMDP | ErbB receptor signaling network, IL2 signaling events mediated by STAT5 | 12 |
| Degradation of |$\beta $| catenin, PAR4-mediated thrombin signaling events | ||
| LKB1 signaling events, Notch signaling pathway, PLK1 signaling events | ||
| Integrin family cell surface interactions, C-MYC pathway | ||
| Coregulation of Androgen receptor activity, BARD1 signaling events | ||
| Validated transcriptional targets of AP1 family members Fra1 and Fra2 | ||
| MCSS | IL2 signaling events mediated by STAT5, AP-1 transcription factor network | 14 |
| |$\beta $|1 integrin cell surface interactions, Syndecan-1-mediated signaling events | ||
| Validated targets of C-MYC transcriptional activation, Nectin adhesion pathway | ||
| C-MYB transcription factor network, Arf6 downstream pathway, IGF1 pathway | ||
| Signaling events mediated by the Hedgehog family, BARD1 signaling events | ||
| Validated transcriptional targets of AP1 family members Fra1 and Fra2 | ||
| Stabilization and expansion of the E-cadherin adherens junction | ||
| Calcineurin-regulated NFAT-dependent transcription in lymphocytes | ||
| CDPathway | Urokinase-type plasminogen activator (uPA) and uPAR-mediated signaling, Endothelins | 16 |
| p75 (NTR)-mediated signaling, Integrins in angiogenesis, FAS (CD95) signaling pathway | ||
| Syndecan-1-mediated signaling events, AP-1 transcription factor network | ||
| Coregulation of Androgen receptor activity, LPA receptor mediated events | ||
| FOXM1 transcription factor network, SHP2 signaling, PLK1 signaling events | ||
| Regulation of Androgen receptor activity, p73 transcription factor network, | ||
| HIF-1-|$\alpha $| transcription factor network, Thromboxane A2 receptor signaling |
At the pathway level on BRCA dataset, as shown in Table 6 and Table 8, the performance ranks of these methods have changed a lot. Dendrix and MDPfinder show the worst performance; this may be because they identify fewer driver genes. However, although Multi-Dendrix has the worst performance at the gene level, it performs similarly with CoMDP and MCSS, and finds more BRCA driver pathways than Dendrix and MDPfinder. That is because the unverified genes in Multi-Dendrix’s results are also related with breast cancer. Since CDPathway integrates multi-types data like miRNA and known pathways, it has the best performance among the six compared methods.
According to Table 9, on STAD dataset, Dendrix and Multi-Dendrix have the lowest performance and identify the fewest driver pathways. Like the ranks at the gene level, MDPfinder and CoMDP perform similarly, CoMDP is slightly better. MCSS and CDPathway achieve better performance, probably because they identify more driver genes, and CDPathway also performs the best among all the compared methods, losing only to CDPMiner. CDPMiner further introduces important cancer-related data such as the pathway topology, attribute data of multi-type molecules, and more effectively integrate them by deep matrix factorization, so it discovers more driver pathways than CDPathway and has the best performance on both datasets.
Taken together, these experimental results on BRCA and STAD datasets indicate that CDPMiner can more precisely identify driver pathways/genes with better precision/recall and statistical significance, and enrich more significant entries (functions) than other methods. Although other compared methods can identify some important pathways, CDPMiner can precisely discover more cooperative driver pathways than these compared methods. And CDPMiner can also find out potential driver genes and pathways closely related to cancer occurrence and development, which helps in the in-depth study of carcinogenesis mechanisms.
This is because: (i) CDPMiner uses the pathway topology to optimize the gene–pathway relations and to weigh genes, which can greatly reduce the negative influence of noisy/unimportant genes and more comprehensively mine gene-level information at the pathway level; (ii) CDPMiner accurately models intra/inter-relational and attribute data matrices of multi-type molecules through an attributed multiplex network, and performs deep joint matrix factorization on the network to more fully explore the functional interaction between pathways; (iii) CDPMiner quantifies the cooperation between pathways using both mutation information and the reconstructed network, which can effectively discover cooperative driver pathways.
Ablation Study
To gain an in-depth understanding of CDPMiner, we also perform ablation study to quantify the contribution of pathway topology, multi-omics molecular information (i.e. miRNAs and lncRNAs), attribute data and the reconstructed pathway internal network |$\widehat{\mathbf{P}}$|. Specifically, we define four variants of CDPMiner: CDPMiner-w/o|$\widehat{\mathbf{A}}$|, CDPMiner-w/o|$\mathcal{R}$|, CDPMiner-w/o|$\mathcal{X}$| and CDPMiner-w/o|$\widehat{\mathbf{P}}$|, which separately disregard pathway topology, multi-omics molecular information, attribute data, reconstructed pathway network but use initial network instead. We then compare and analyze the results of these variants with CDPMiner on both BRCA and STAD datasets at the gene and pathway levels. The details of the results and discussions are shown in the Supplementary file.
In summary, the experimental results indicate that eliminating any of these four types of data will lead to performance drop, and the effective use of these data helps to more accurately discover cooperative driver pathways than other methods. Moreover, these results also prove the rationality and effectiveness of CDPMiner to identify cooperative driver pathways by mining attributed multiplex network composed of multi-omics data. Although these variants are not outstanding at the gene level, they are still better than most compared methods at the pathway level. In other words, even with fewer multi-omics data, CDPMiner can still effectively discover cooperative driver pathways, which is another affirmation of our work.
DISCUSSION
Most existing methods mainly focus on genomics data to identify driver genes and pathways; they do not consider the important information in pathways and other molecules, which is helpful for exploring the carcinogenic process. In this paper, we propose CDPMiner to discover cooperative driver pathways by mining attributed multiplex network to fuse multi-type omics data. CDPMiner firstly mines pathway topology to optimize gene–pathway relations and to weigh genes, then uses attributed multiplex network embedding to fuse multi-omics data, and finally quantifies the cooperation between pathways to discover cooperative driver pathways. Extensive experimental study on Breast and Stomach cancer datasets corroborate that CDPMiner can accurately discover potential cooperative driver pathways. CDPMiner has the potential to aid carcinogenic analysis.
Although CDPMiner has been able to explore the occurrence of cancer more comprehensively, under the consideration of the extremely complex real carcinogenic process the discovery accuracy of CDPMiner may be reduced in some scenarios. That may be caused by the noise or missing values in the biological data, such as the incomplete of pathway internal topology. Therefore, in future work, we will further optimize the process of CDPMiner, and maintain efficient discovery in the case of low data quality.
We propose a novel multiplex network embedding based method CDPMiner for discovering cooperative driver pathways. CDPMiner can better use gene-related data based on the pathway topology and integrate rich multi-type omics data by embedding attributed multiplex network to guide the discovery.
CDPMiner calculates the weights of genes in pathways by pathway topology to reduce the interference of less important genes, and collaboratively fuses relational and attributed data matrices by deep joint matrix factorization, which also captures the nonlinear relationships between nodes.
CDPMiner has significantly better performance on discovering cooperative driver pathways than competitive baselines across multiple aspects (gene level, pathway level and enrichment analysis) on two different datasets (BRCA and STAD).
DATA AND CODE AVAILABILITY
We chose BRCA and STAD as the studied cancers in this paper. Four multi-omics data related with lncRNA, miRNA, gene and pathway are used in our study. We collect six relational data matrices between them and 3, 3 and 4 types of attribute data for lncRNAs, miRNAs and genes, respectively. The details of them are shown in the Supplementary file.
Due to the lack of direct relations between miRNAs/lncRNAs and pathways, we set up the miRNA/lncRNA–pathway relational matrices based on the collected gene–pathway and gene–miRNA/lncRNA relational matrices. We collect 84/175 lncRNAs /miRNAs related to BRCA and 74/240 lncRNAs/miRNAs related to STAD from LncRNADisease [69] and HMDD [70], respectively.
To take advantage of the high mutual exclusion and high coverage of the driver pathway, we collect two kinds of mutation data from TCGA [2]: single nucleotide polymorphism (SNP) data and copy number variation (CNV) data, and combine them into mutation data matrix |$\mathbf{M}$|; for gene |$g$| and sample |$s$|, its value is specifically defined as follows:
where |$\mathbf{M}\in \mathbb{R}^{n_{g}\times n_{s}}$| is the mutation data matrix, |$n_{g}$| represents the total number of genes investigated and |$n_{s}$| represents the total number of samples. When |$SNP$| or |$CNV$| in the above equation is greater than zero, it indicates that the gene has a single nucleotide polymorphism or copy number variation in the corresponding sample.
Since most genes with low mutation frequency are passenger genes that have no impact on cancer, we only retain genes with high mutation frequency to reduce the computation cost and make the discovery results more interpretable. For gene |$g$|, its mutation frequency is defined as follows:
|$\Gamma (g)$| represents the sample set with mutation of gene |$g$|, and |$|s|$| represents the total number of genes mutated in sample |$s$|. Eq. (11) calculates the mutation frequency from the two levels of genes and samples, which can reduce the negative influence of noisy data. Based on |$Fre$|, we separately select the top 2000 genes in BRCA and STAD datasets as the experimental data.
We pack the source code into a well-documented package at https://www.sdu-idea.cn/codes.php?name=CDPMiner. In addition, a detailed Readme file is attached to guide the use and parameter setting of CDPMiner.
ACKNOWLEDGMENTS
Funding This work is supported by the National Natural Science Foundation of China (No. 62072380 and 62272276) and the Fundamental Research Funds of Shandong University (2020GN061).
Author Biographies
Jun Wang is a Professor at the Joint SDU-NTU Centre for Artificial Intelligence Research (C-FAIR), Shandong University, China. Her current research interests include machine learning, data mining and their applications in bioinformatics.
Xi Chen is an M.Eng. student at the School of Software, Shandong University, China. His current research interests include data mining and bioinformatics.
Zhengtian Wu is an Associate Professor at the School of Electronic and Information Engineering, Suzhou University of Science and Technology, China. His current research interests include machine learning and bioinformatics.
Maozu Guo is a Professor at the College of Electrical and Information Engineering, Beijing University of Civil Engineering and Architecture, China. His current research interests include machine learning and data mining.
Guoxian Yu is a Professor at the School of Software, Shandong University, China. His current research interests include machine learning and bioinformatics.
References
