


Abstract
In recent years, many experiments have proved that microRNAs (miRNAs) play a variety of important regulatory roles in cells, and their abnormal expression can lead to the emergence of specific diseases. Therefore, it is greatly valuable to do research on the association between miRNAs and diseases, which can effectively help prevent and treat miRNA-related diseases. At present, effective computational methods still need to be developed to better identify potential miRNA–disease associations. Inspired by graph convolutional networks, in this study, we propose a new method based on Attention aware Multi-view similarity networks and Hypergraph learning for MiRNA-Disease Associations identification (AMHMDA). First, we construct multiple similarity networks for miRNAs and diseases, and exploit the graph convolutional networks fusion attention mechanism to obtain the important information from different views. Then, in order to obtain high-quality links and richer nodes information, we introduce a kind of virtual nodes called hypernodes to construct heterogeneous hypergraph of miRNAs and diseases. Finally, we employ the attention mechanism to fuse the outputs of graph convolutional networks, predicting miRNA–disease associations. To verify the effectiveness of this method, we carry out a series of experiments on the Human MicroRNA Disease Database (HMDD v3.2). The experimental results show that AMHMDA has good performance compared with other methods. In addition, the case study results also fully demonstrate the reliable predictive performance of AMHMDA.
INTRODUCTION
MicroRNAs (miRNAs) are a class of endogenous small RNAs containing about 20–24 nucleotides, which can not only finely regulate the expression of a certain gene, but also play a significant role in cell differentiation, biological development and disease occurrence. Earlier this century, developmental biologist Frank Slack from Yale University and his colleagues discovered that mutations in the let-7 miRNA gene led to increased cell division [1]. Later, another group of researchers found that the cluster composed of miR-15 and miR-16 was often missing or under-expressed, and this change was closely related to the development of chronic lymphocytic leukemia [2]. Since then, more and more studies have confirmed that the abnormal expression of miRNAs was bound up with various types of malignant tumors, infectious diseases and genetic diseases. Traditional biological experiments, such as qPT-PCR [3], Northern blotting [4] and microarray profiling [5] are time-consuming and expensive. Therefore, it is necessary to employ effective computational methods to discover potential miRNA–disease associations. In recent years, commonly used association prediction computing methods can be divided into two categories: methods based on similarity measure and methods based on machine learning.
Approaches based on similarity measure assume that functionally similar miRNAs are more likely to be associated with phenotypically similar diseases and vice versa. For this kind of models, it is very important to obtain the similarity scores between different biomedical entities such as miRNAs, diseases and genes. Chen et al. [6] proposed a method based on random walk with restart for miRNA–disease association (RWRMDA) which adopted the global network rather than the local network for similarity measurement. Later, Xuan et al. [7] presented a new model utilizing random walk, namely MIDP. Chen et al. [8] developed a classical model called WBSMDA, which integrated miRNA functional similarity, disease semantic similarity, Gaussian interaction profile kernel similarity and known miRNA–disease associations. NCPMDA [9] integrated miRNA functional similarity, miRNA family information, disease semantic similarity, and Jaccard similarity for miRNAs and diseases, then it reconstructed miRNA–miRNA and disease–disease similarity networks to predict miRNA–disease associations. Besides, Chen et al. [10] developed the MDHGI which not only integrated multiple similarities of miRNAs and diseases, but also fully utilized matrix decomposition to fuse similarity information into miRNA–disease heterogeneous network. In general, although these models based on similarity measures can perform well in predicting miRNA–disease associations, they tend to over-rely on similarity scores.
With the rapid development of machine learning and its strong application in various fields, researchers are increasingly inclined to use effective machine learning methods for miRNA–disease association prediction [11]. For example, Xu et al. [12] proposed the MIDN, which inputted the features extracted from networks into support vector machine (SVM) classifier aiming to distinguish disease-related and non-related miRNAs. In addition, Xuan et al. [13] improved the calculation method of miRNA functional similarity, named HDMP, which assigned higher weights to members of miRNA families or clusters. Later, Fu et al. [14] utilized stacked auto-encoder (SAE) to extract useful information from networks, and then adopted neural network classifiers to predict associations. Then, Chen et al. [15] employed sparse subspace learning with Laplacian regularization to infer miRNA–disease association. Chen et al. [16] developed a new inductive matrix completion model (IMCMDA), which aimed to complete the missing miRNA–disease association based on the known associations and integrated miRNA similarity and disease similarity. By integrating miRNA similarity and disease similarity as their respective feature vectors, Chen et al. [17] proposed a computational model of random forest (RF) to predict miRNA–disease associations (RFMDA). HFHLMDA [18] is a new method for miRNA–disease association prediction based on high-dimensionality features and hypergraph learning. It integrated miRNA similarity and disease similarity to obtain high-dimensional features, and utilized k-nearest neighbors to construct a hypergraph. Inspired by Bahi et al. [19], Wang et al. [20] applied stacked auto-encoder to pre-train SAEMDA in an unsupervised manner. DFELMDA [21] constructed deep autoencoders to extract feature representations, and then predicted miRNA-disease associations through the deep random forest. In conclusion, association prediction models based on machine learning are very efficient. Meanwhile, time and money costs of these models are greatly reduced. However, the quality of features extracted by these models has a great impact on prediction results.
Recently, graph neural networks (GNN) [22] has received extensive attention due to its remarkable ability in processing graph-structured data. Common GNN models, including graph convolutional networks (GCN) [23], graph attention networks (GAT) [24] and graph autoencoders (GAE) [25], can efficiently aggregate contextual information for graph-related tasks. NIMCGCN [26] obtained feature representations from respective similarity networks of miRNAs and diseases through GCN, and then adopted neural inductive completion model to obtain a miRNA–disease associations matrix. In addition, Tang et al. [27] proposed a deep learning method named multi-view multichannel attention graph convolutional network (MMGCN). MMGCN used GCN encoders to extract features of miRNAs and diseases in multiple similarity views, and implemented feature enhancement through multi-channel attention to complete the final miRNA–disease association matrix. HGANMDA [28], a hierarchical GAT for miRNA–disease associations prediction, utilized node-layer attention and semantic-layer attention to learn the importance of the neighbor nodes and different meta paths. Later, MKGAT [29] applied GATs to learn embeddings on each layer, and employed dual Laplacian regularized least squares for miRNA–disease associations prediction. Besides, Li et al. [30] adopted a graph autoencoder model (GAEMDA) to predict miRNA–disease associations in an end-to-end manner. Zhang et al. [31] developed the AGAEMD, which used GATs, jump knowledge and residual network as encoders. In addition, graph random neural networks (GRAND) [32] have been presented in the past 2 years and attracted the attention of researchers. GRPAMDA [33] combined graph random propagation mechanism and attention mechanism to enhance node features in heterogeneous network. In short, these models based on GNNs can aggregate richer node information and improve the ability of association prediction. However, these models tend to over-reliance on known associations in networks and features of local neighbor nodes.
In this paper, we propose a new calculation method based on attention aware multi-view similarity networks and hypergraph learning for miRNA–disease associations identification (AMHMDA), which is inspired by a model named BridgeDPI presented by Wu et al. [34]. The contribution of this method is as follows:
Multi-view similarities from multiple perspectives are integrated together to comprehensively describe the relationship between miRNA–miRNA and disease–disease.
The fusion of homogeneous network of miRNA–miRNA or disease–disease and heterogeneous network of miRNA and disease can deeply explore the representation of diseases and miRNAs.
In heterogeneous hypergraph, we introduce some hypernodes to obtain high-quality miRNA–disease links and aggregate richer information of disease nodes and miRNA nodes.
RELATED MATERIALS
In this study, the miRNA–disease associations were downloaded from the Human MicroRNA Disease Database (HMDD v3.2) [35]. At present, HMDD v3.2, a currently updated human miRNA–disease associations database, contains more extensive associations between miRNA and disease. At last, we select 12 446 experimentally confirmed associations between 853 miRNAs and 591 diseases. Then, we mark the known miRNA–disease associations as positive samples, denoted as 1. The remaining samples indicate no association between miRNAs and diseases, denoted as 0. According to the assumption that similar miRNAs have similar function and tend to associated with similar diseases, relationship between disease–disease and miRNA–miRNA are significant for miRNA–disease association prediction. In this study, we calculate multi-view similarities for miRNA–miRNA and disease–disease from multiple perspectives, including miRNA functional similarity, miRNA sequence similarity, disease semantic similarity, target-based disease similarity and Gaussian interaction profile kernel similarity for miRNAs and diseases. Detailed description of various similarities is shown in Supplementary Materials.
METHODS
AMHMDA framework
Predictive models based on GCNs have received wide attention in the field of bioinformatics, and have outstanding performance on solving association prediction problems [39–40]. Inspired by previous studies, we propose a method based on attention aware multi-view similarity networks and hypergraph learning for miRNA–disease associations identification (AMHMDA). As described in Figure 1, AMHMDA consists of three main steps:
(1) Similarity feature extraction: we construct homogeneous similarity networks of miRNAs and diseases, respectively, and then combine GCN as well as attention mechanism to extract useful similarity information.
(2) Construction of hypergraph: we construct miRNA–disease heterogeneous networks with hypernodes, and utilize GCN to aggregate information.
(3) Classification: we apply attention mechanism to fuse the outputs of GCN layers, and combine fully connected layers (FC) to obtain the final association scores.
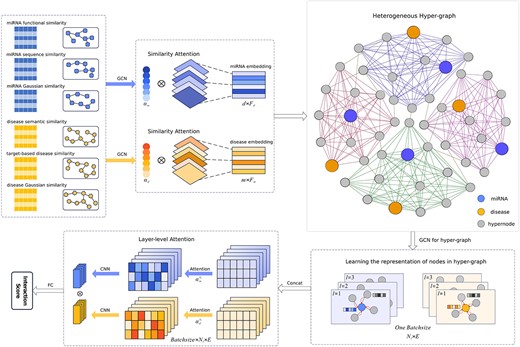
The overall architecture of the AMHMDA.
Feature extraction from multi-view similarity networks
We first process different similarity views of miRNAs and diseases to explore the similarity information beneficial to association prediction.
For miRNAs, we create three distinct miRNA–miRNA networks by taking miRNA functional similarity, miRNA sequence similarity and Gaussian interaction profile kernel similarity matrix as the adjacency matrices. Similarly, for diseases, we use disease semantic similarity, target-based disease similarity, and Gaussian interaction profile kernel similarity matrix as adjacency matrices to create three different disease–disease networks. Specifically, the adjacency matrix sets of miRNAs and diseases are respectively represented as follows:
where |${A}_{mf}\in{R}^{m\times m}$|, |${A}_{ms}\in{R}^{m\times m}$| and |${A}_{mg}\in{R}^{m\times m}$| represent adjacency matrices of different miRNA–miRNA association networks, respectively. Besides, |${A}_{ds}\in{R}^{d\times d}$|, |${A}_{dt}\in{R}^{d\times d}$| and |${A}_{dg}\in{R}^{d\times d}$| denote adjacency matrices of different disease–disease association networks, respectively.
After constructing the respective interaction networks of miRNAs and diseases, we first apply GCN to extract various similarity information and update the embedding of each node. Next, considering that different similarity information has different importance, we use attention mechanism to integrate different similarity features.
Graph convolutional networks. We consider leveraging GCN to aggregate potential similarity information in networks. The initial embedding of GCN is randomly initialized. Then, we normalize the adjacency matrices of miRNA–miRNA interaction networks:
where |${\tilde{A}}_m\in{R}^{m\times m}$| represents the adjacency matrix with identity matrix |$I$| added to prevent the original information of nodes from being lost. |${\tilde{D}}_m\in{R}^{m\times m}$| is the degree matrix of |${\tilde{A}}_m$|.
After that, according to the layer propagation rule of GCN, we can calculate representations of miRNA nodes as follows:
where |${H}_m^{(l)}\in{R}^{m\times{F}_m}$| represents the embeddings of nodes in the |$l$|th GCN layer, where |${F}_m$| is the feature dimension of miRNA nodes. |${W}_m^{(l)}\in{R}^{F_m\times{F}_m}$| denotes a learnable weight matrix and |$\sigma \left(\cdotp \right)$| is a nonlinear activation function.
In the same way, we can obtain representations of disease nodes as follows:
where |${H}_d^{(l)}\in{R}^{d\times{F}_d}$| represents the embedding of nodes in the |$l$|th GCN layer, where |${F}_d$| is the feature dimension of disease nodes. |${W}_d^{(l)}\in{R}^{F_d\times{F}_d}$| denotes a learnable weight matrix.
Attention mechanism. Information from different similarity views is assigned different importance through the attention mechanism. Concretely, we first to calculate the importance coefficient |${\mathrm{\alpha}}_{\mathrm{m}}$| of different miRNA similarity views as follows:
where |${\mathrm{GAP}}_m\left(\cdotp \right)$| is a global average pooling layer. |${\mathrm{FNN}}_m\left(\cdotp \right)$| is a two-layer FNN, and its output is activated by the nonlinear activation function. |${Z}_m^{\mathrm{GCN}}\in{R}^{N_v\times m\times E}$| denotes the outputs of GCN layers, where |${N}_v$| is the number of miRNA similarity views and |$E$| represents the feature dimension of current nodes.
After that, miRNA similarity views with different importance are calculated as follows:
where |$\sigma \left(\cdotp \right)$| is ReLU activation function. |${\mathrm{CNN}}_m\left(\cdotp \right)$| is the 2D convolutional neural networks (CNN) for integrating different similarity views. Finally, we obtain miRNA nodes representations |${Z}_m^{\mathrm{Att}}\in{R}^{m\times E}$| that aggregate different similarity information.
Similarly, disease similarity views with different importance are calculated as follows:
where |${\mathrm{GAP}}_d\left(\cdotp \right)$| is a global average pooling layer. |${\mathrm{FNN}}_d\left(\cdotp \right)$| is a two-layer FNN. |${\mathrm{CNN}}_d\left(\cdotp \right)$| is the 2D CNN. |${Z}_d^{GCN}\in{R}^{N_v\times m\times E}$| denotes the output of GCN layers, where |${N}_v$| is the number of disease similarity views and |$E$| represents the feature dimension of current nodes.
Construction of hypergraph
After obtaining embedded representations of miRNAs and diseases that aggregate different similarity information, we introduce hypernodes to construct the hypergraph for miRNAs and diseases. Concretely, in the hypergraph, these hypernodes can be used to connect all miRNA nodes and disease nodes, including miRNA–disease pairs with unknown associations, which can better explore potential miRNA–disease associations. In addition, hypernodes can self-learn node representations through networks, which can build higher-quality links between miRNAs and diseases to predict the association scores, instead of directly calculating the association scores by formulas. The adjacency matrix of the hypergraph is obtained from cosine similarities which are defined as follows:
where |${M}_i\in{R}^{1\times E}$| denotes the previously obtained embedding of miRNA node |$i$|, and |${D}_j\in{R}^{1\times E}$| represents the previously obtained embedding of disease node |$j$|. |${P}_k\in{R}^{1\times E}$| is a hypernode, and its node feature is randomly initialized. |${\parallel \cdotp \parallel}_2$| is to compute the two-norm value of a vector. Hence, for the miRNA |$i$|-disease |$j$| pair, their association can be measured by |${C}_{M_i,{P}_k}$| and |${C}_{D_j,{P}_k}$|.
In the next, we utilize GCN to update the feature representation of nodes:
where |${\tilde{A}}_P\in{R}^{\left({N}_p+2\right)\times \left({N}_p+2\right)}$| represents the adjacency matrix with identity matrix |$I$| added, where |${N}_p$| is the number of hypernodes. |$\delta \left(\cdotp \right)$| is LeakyReLU activation function to ensure the validity of node information. |${\tilde{D}}_P\in{R}^{\left({N}_p+2\right)\times \left({N}_p+2\right)}$| is the degree matrix of |${\tilde{A}}_P$|. And |${H}_P^{(l)}\in{R}^{\left({N}_p+2\right)\times E}$| represents the embedding of nodes in the |$l$|th GCN layer. |${W}_P^{(l)}\in{R}^{E\times E}$| denotes a learnable weight matrix and |$\sigma \left(\cdotp \right)$| is a nonlinear activation function. In addition, |${H}_P^{(0)}\in{R}^{\left({N}_p+2\right)\times E}$| is given as follows:
Then, according to the output of each GCN layer, we can obtain the node representation of miRNA |${M}_i$| and disease |${D}_j$| in each layer separately:
where |${H}_1^{(l)}\in{R}^{1\times E}$| represents the first row of |${H}_{\mathrm{P}}^{(l)}$| and |${H}_2^{(l)}\in{R}^{1\times E}$| denotes the second row of |${H}_{\mathrm{P}}^{(l)}$|.
Classification
After obtaining the node representations of different layers, we consider that the node information of different layers has different contributions to the prediction results. Therefore, we use layer-level attention mechanism to obtain layer-level node representations with different importance:
where |${M}_i^c,{D}_j^c\in{R}^{N_l\times E}$| denote the node representations obtained by concatenating the outputs of |${N}_l$| layers. |${\hat{M}}_i,{\hat{D}}_j\in{R}^{1\times E}$| represent the final embedding of miRNA |$i$| and disease |$j$|. |$\mathrm{Att}\left(\cdotp \right)$| is a one-head attention mechanism. |${\mathrm{CNN}}_m\left(\cdotp \right)$| is the 1D CNN.
After that, we compute the element-level product of miRNA node embeddings and disease node embeddings. Then, we predict the association probabilities of miRNA–disease pairs by FNN:
where |$\odot$| is the element-level product of miRNA node vectors and disease node vectors. |${\mathrm{FNN}}_{\mathrm{out}}\left(\cdotp \right)$| is a one-layer FNN, and its output is activated by the Sigmoid activation function.
In order to optimize the model, we apply the cross-entropy loss function to calculate loss during model training:
where |$Y$| and |${Y}^{+}$| represent the positive and negative link sets of all miRNA–disease pairs, respectively. |${y}_{ij}$| denotes the true label of the link, marked as 1 or 0.
Experiments
In the experiment, we take known miRNA–disease associations between 853 miRNAs and 591 diseases as positive samples. Then, in the sample labeled 0, we randomly select negative samples with the same number of positive samples to ensure the balance of samples. Next, we divide the data into a training set and a test set (accounting for 20%). In order to ensure good generalization performance of the model, 5-fold cross validation is used in the training set to adjust the model parameters and structure, and the model with better performance in the verification set is selected for independent testing. During the training, we set batch size to 128, number of GCN layers to 2, feature dimension of nodes to 128 and number of hypernodes to 64. Besides, we use dropout (=0.5) to randomly ignore some neurons to avoid the problem of overfitting. Evaluation indicators include area under the receiver operating characteristic (ROC) curve (AUC), area under the precision/recall (PR) curve (AUPRC), accuracy, F1-score, recall and precision. All experiments are repeated several times to obtain a reasonable assessment of prediction results.
Comparison with other methods
We compare the model with five other methods on the separate test set, including NIMCGCN [26], MMGCN [27], ERMDA [41], HGANMDA [28], AGAEMD [31], MINIMDA [42] and MAGCN [43]. The initial similarity data required by all comparison methods use the existing similarity data for this method. In addition, we keep the settings and parameters for other methods, as well as the part of dynamically obtaining specific similarities.
(i) NIMCGCN [26] employed GCN to extract features from similarity networks, and then utilized a NIMC model to generate an association matrix completion.
(ii) MMGCN [27] applied a multi-view GCN encoder, a multi-channel attention mechanism, and a CNN combiner to predict miRNA-disease associations.
(iii) ERMDA [41] presented the resampling strategy to build multiple different balanced training subsets, obtained feature representations from multiple data. Finally, it employed soft voting to predict miNRA–disease associations.
(iv) HGANMDA [28] utilized node-layer and semantic-layer attention to learn the importance of neighbor nodes and meta paths, and then reconstructed the miRNA–disease associations.
(v) AGAEMD [31] aggregated information using a node-level attention autoencoder in the miRNA–-disease network, and reconstructed the miRNA–disease associations network.
(vi) MINIMDA [42] constructed different multimodal networks and learned the embedding representations of miRNAs and diseases by fusing mixed high-order neighborhood information from these networks, so as to infer miRNA–disease associations.
(vii) MAGCN [43] employed GCN with multichannel attention mechanism and CNN combiner to learn on the lncRNA–miRNA and miRNA–disease networks it has built, and then reconstructed miRNA–disease associations through a bilinear decoder.
The comparison results of several experiments are shown in Table 1. The AUC and AUPRC of AMHMDA are 94.22 and 94.11%, respectively. It can be observed that although the recall of AMHMDA is not significantly better than AGAEMD method, other indicators are higher. Compared with other methods, AMHMDA shows good performance on the independent test set.
Comparison with other methods on HMDD v3.2
| Methods | AUC | AUPRC | ACC | F1-score | Recall | Precision |
|---|---|---|---|---|---|---|
| NIMCGCN | 0.8945 | 0.8926 | 0.8131 | 0.8148 | 0.8220 | 0.8076 |
| MMGCN | 0.9321 | 0.9320 | 0.8550 | 0.8544 | 0.8512 | 0.8580 |
| ERMDA | 0.9171 | 0.9173 | 0.8399 | 0.8396 | 0.8382 | 0.8412 |
| HGANMDA | 0.9265 | 0.9253 | 0.8489 | 0.8481 | 0.8433 | 0.8529 |
| AGAEMD | 0.9270 | 0.9286 | 0.8502 | 0.8507 | 0.8544 | 0.8481 |
| MINIMDA | 0.9304 | 0.9350 | 0.8481 | 0.8482 | 0.8529 | 0.8505 |
| MAGCN | 0.9245 | 0.9268 | 0.8483 | 0.8473 | 0.8425 | 0.8533 |
| AMHMDA | 0.9422 | 0.9411 | 0.8669 | 0.8653 | 0.8549 | 0.8763 |
Bold values are correct and they are results of our method.
Ablation experiments
To verify the importance of each module in the AMHMDA, we develop three variant models AMHMDA-SimAtt, AMHMDA-Hyper and AMHMDA-LayerAtt for comparison. Specifically, AMHMDA-SimAtt removes the attention module of the similarity features extraction part from the original model framework. AMHMDA-Hyper aims to study the contribution of hypernodes to the model performance, so we use the original miRNA–disease heterogeneous graph to replace the miRNA–disease heterogeneous hypergraph. Then, AMHMDA-LayerAtt only removes the layer attention before classification.
Figure 2 shows the comparison of evaluation metrics of AMHMDA-SimAtt, AMHMDA-Hyper, AMHMDA-LayerAtt and the original model, in which the highest values have been marked. We can discover the multi-view attention module and the layer attention module have a certain influence on the prediction results of the model, which indicates that different similarity features and different layer outputs do have different importance on the results. In addition, the AUC and AUPRC of AMHMDA-Hyper are lower than the original model, which proves the effectiveness of introducing hypernodes to construct hypergraph.
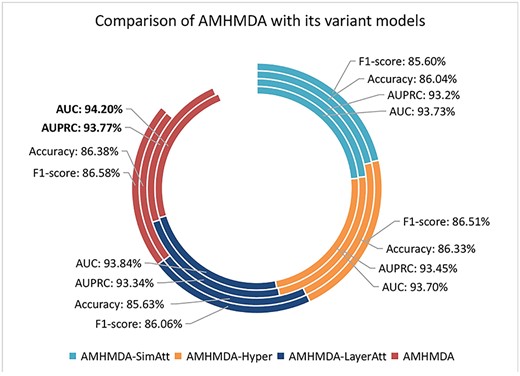
Ablation experiments results of four different models.
Impact of similarity views
In order to study the influence of multiple similarity views on the prediction results of AMHMDA, we split multiple similarity views and only use a single one to observe the changes in evaluation metrics. We compare the AUC and AUPRC values of multiple similarity views with a single similarity view, and the results are shown in Table 2. According to the comparison results, we can find that the evaluation metrics of the model are the best when using multiple similarity views.
Comparison of single-view and multi-view of AMHMDA
| Views | AUC | AUPRC | Views | AUC | AUPRC |
|---|---|---|---|---|---|
| |${S}_{mf+ dt}$| | 0.8906 | 0.8939 | |${S}_{ms+ dg}$| | 0.9018 | 0.8971 |
| |${S}_{mf+ ds}$| | 0.8960 | 0.8957 | |${S}_{mg+ dt}$| | 0.9159 | 0.9119 |
| |${S}_{mf+ dg}$| | 0.9147 | 0.9145 | |${S}_{mg+ ds}$| | 0.9142 | 0.9073 |
| |${S}_{ms+ dt}$| | 0.8591 | 0.8574 | |${S}_{mg+ dg}$| | 0.9362 | 0.9326 |
| |${S}_{ms+ dg}$| | 0.8657 | 0.8607 | |${S}_{all\_ views}$| | 0.9420 | 0.9377 |
Bold values are correct and they are results of our method.
In order to investigate the contribution of a certain similarity to the miNRA–disease associations, we statistic the data of miRNAs and diseases with similarity value higher than 0.6 or 0.7 in each similarity relationship. For each similarity condition, we count the number of diseases co-associated with the two miRNAs (miRNA |${m}_i$| and |${m}_j$|) whose similarity scores are higher than the threshold (0.6 or 0.7). In a similar way, the number of miRNAs co-associated with the two diseases (disease |${d}_i$| and |${d}_j$|) whose similarity scores are higher than the threshold is counted. Figure 3A and B shows the distribution of same diseases predicted utilizing miRNA functional similarity, sequence similarity and Gaussian similarity, and the number statistics of miRNA pairs who have common disease in each similarity network. Figure 3C and D shows the distribution of same miRNAs predicted by target-based disease similarity, semantic similarity and Gaussian similarity and the number statistics of disease pairs who have common miRNA in each similarity network. It can be observed that under the functional similarity and sequence similarity, the number of diseases co-associated with each pair of similar miRNAs is in wide range, even greater than 80, while, under the Gaussian similarity, the number of diseases co-associated with each pair of similar miRNAs is concentrated in the lower range. However, the total number of miRNA pairs with common disease in Gaussian similarity is the largest, which indicated that a large number of miRNA pairs do not have high functional similarity and sequence similarity score, but the correlation difference with disease is low. A similar phenomenon can be observed in association statistics of diseases. Therefore, the three kinds of similarity can complement each other and better reflect the relationship between miRNAs and diseases.
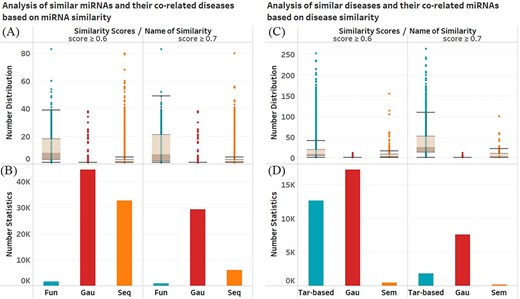
Analysis of similarity views. (A) The number distribution of same diseases associated with similar miRNAs in different similarity views. (B) The number statistics of miRNA pairs who have common diseases in different similarity views. (C) The number distribution of same miRNAs associated with similar diseases in different similarity views. (D) The number statistics of disease pairs who have common miRNAs in different similarity views.
Parameter analysis
Hyperparameters can affect the prediction performance of the model. Therefore, we apply 5-fold cross-validation to analyze the influence of some parameters on the prediction results, and compare the evaluation index values.
Feature embedding dimension. The embedding size of features affect the dimension of their corresponding learnable parameter matrices. Figure 4 shows evaluation index scores for different feature dimensions |$\left\{\mathrm{32,64,128,256}\right\}$|. We can see that there are significant differences in accuracy and F1-score between different feature dimensions. In order to ensure the prediction performance of the model and the quality of feature information, we set the feature dimension of all nodes to 128.
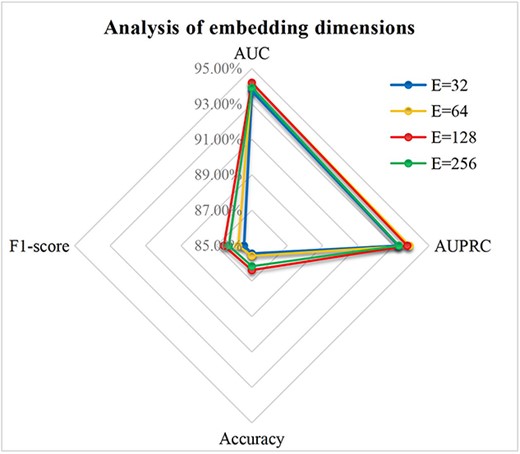
Parameter analysis for feature embedding dimensions.
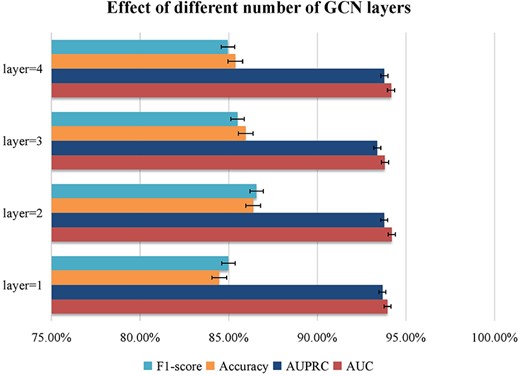
The number of hidden layers. Generally speaking, increasing the number of GCN layers can aggregate more node information. However, increasing the number of GCN layers too much, easily lead to problems of oversmooth and overfitting. Figure 5 shows evaluation index scores for different number of hidden layers |$\left\{1,2,3,4\right\}$|. We discover that when the number of GCN layers gradually increases to 3, several index values of the model decreases. Finally, we set the number of GCN layers to 2.
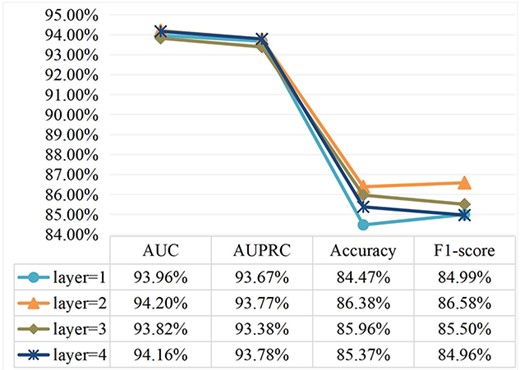
Parameter analysis for different number of hidden layers.
The number of hypernodes. We construct miRNA–disease heterogeneous hypergraph with hypernodes to connect miRNA–disease pairs. In fact, changes in the number of hypernodes change the structure of the hypergraph. Therefore, we further study the influence of the number of hypernodes on prediction results. Figure 6 shows evaluation index scores for different number of hypernodes |$\left\{\mathrm{8,16,32,64}\right\}$|. Since the representation of hypernodes is randomly initialized, too many hypernodes are not conducive to extracting useful information, and even complicate the graph structure. Therefore, we choose a more suitable number of hypernodes to be 64.
Parameter analysis for and different number of hypernodes.
Case study
In order to verify the reliability of AMHMDA for miRNA–disease association prediction in real cases, we implement the case study. We select three different diseases: colon neoplasms, esophageal neoplasms and breast neoplasms as case studies. Many studies have shown that the change of miRNA expression level is closely related to the occurrence of various diseases. Among them, colon tumor is a common intestinal malignant tumor, and the decreased expression of let-7a is closely associated to the occurrence of colorectal cancer [44]. Esophageal tumor is one of the most high-incidence diseases in the world. Studies have found that the expression of miR-145 and miR-143 has the most significant changes in the lesion tissues of patients with esophageal tumors. Breast tumor is one of the most common malignant tumors in women. Studies have shown that some miRNAs, such as miR-125b and miR-145, are significantly reduced in breast tumor lesions.
For the case study, our main purpose is to find potential miRNA–disease associations. Therefore, we first used all known associations in the HMDD V3.2 database as training data to predict. Then, we ranked the three diseases-related miRNAs predicted by the model according to their association scores, and selected the top 10 miRNAs. The results are shown in Table 3. We selected known associations contained in dbDEMC3.0 [45] database as validation sets. The experiments show that almost all the potential associations predicted by the model can be confirmed, which fully demonstrates the validity and reliability of AMHMDA in actually predicting miRNA–disease associations.
The top 10 associated miRNAs for colon neoplasms, esophageal neoplasms and breast neoplasms predicted by AMHMDA
| Cancer | Colon neoplasms | Esophageal neoplasms | Breast neoplasms | ||||||
|---|---|---|---|---|---|---|---|---|---|
| Rank | miRNA | Evidence | Rank | miRNA | Evidence | Rank | miRNA | Evidence | |
| Top 10 associated miRNAs | 1 | hsa-mir-34a | HMDD v3.2 | 1 | hsa-mir-15a | HMDD v3.2 | 1 | hsa-mir-15a | HMDD v3.2 |
| 2 | hsa-mir-146a | HMDD v3.2 | 2 | hsa-mir-183 | HMDD v3.2 | 2 | hsa-mir-27b | HMDD v3.2 | |
| 3 | hsa-mir-155 | HMDD v3.2 | 3 | hsa-mir-106b | HMDD v3.2 | 3 | hsa-let-7 g | HMDD v3.2 | |
| 4 | hsa-mir-150 | HMDD v3.2 | 4 | hsa-mir-92a-2 | HMDD v3.2 | 4 | hsa-let-7c | HMDD v3.2 | |
| 5 | hsa-mir-20a | HMDD v3.2 | 5 | hsa-mir-143 | HMDD v3.2 | 5 | hsa-mir-20a | HMDD v3.2 | |
| 6 | hsa-mir-29a | HMDD v3.2 | 6 | hsa-let-7c | HMDD v3.2 | 6 | hsa-mir-145 | HMDD v3.2 | |
| 7 | hsa-mir-122 | HMDD v3.2 | 7 | hsa-mir-182 | dbDEMC 3.0 | 7 | hsa-mir-222 | HMDD v3.2 | |
| 8 | hsa-mir-17 | HMDD v3.2 | 8 | hsa-mir-145 | HMDD v3.2 | 8 | hsa-mir-1-1 | HMDD v3.2 | |
| 9 | hsa-mir-148a | HMDD v3.2 | 9 | hsa-mir-222 | dbDEMC 3.0 | 9 | hsa-mir-125a | HMDD v3.2 | |
| 10 | hsa-mir-18a | HMDD v3.2 | 10 | hsa-mir-30a | dbDEMC 3.0 | 10 | hsa-mir-31 | HMDD v3.2 | |
Subsequently, we select hsa-mir-182 which ranked higher among miRNAs related to esophageal neoplasms for further analysis. The association between esophageal neoplasms and hsa-mir-182 does not exist in the HMDD v3.2 database but is confirmed by dbDEMC3.0. Next, we take out the relevant miRNAs and diseases with similarity scores higher than 0.5 to hsa-mir-182 and esophageal neoplasms. Then, we select the disease and miRNA nodes with the prediction correlation of 1 with this miRNA and this disease, and a network with hsa-mir-182 and esophageal neoplasms as central nodes is constructed, as shown in Figure 7. The similarity scores higher than 0.65 in the figure are marked in red. We can observe that the similarity scores between other diseases and esophageal neoplasms are higher than those between hsa-mir-182 and other miRNAs and the number of diseases is larger than miRNAs in this association subnetwork. It denotes that specific miRNA is more likely to cause similar diseases, and the similarities between diseases contribute more to explore the association of miRNA–disease than those between miRNAs.
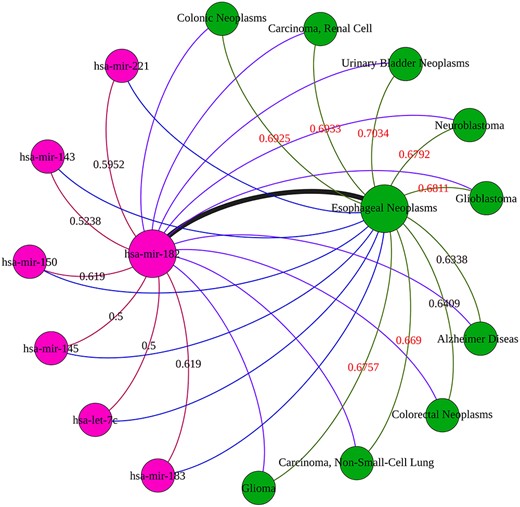
In this subnetwork, the red node is miRNA, the green node is disease, and the edges with different colors represent miRNA–miRNA similarity association, disease–disease similarity association and miRNA–disease association, respectively.
CONCLUSION
The abnormal expression of miRNAs can cause changes in the expression level of its regulated target genes, leading to the occurrence of specific diseases. Therefore, it is valuable to identify the association between miRNAs and diseases. In this research, we proposed a novel computational method, AMHMDA, for miRNA–disease associations prediction. AMHMDA not only extracts feature information from multiple similarity networks of miRNAs and diseases, but also introduces hypernodes to construct heterogeneous hypergraph for miRNA–disease pairs to explore potential miRNA–disease associations. Hypernodes can be used to connect all miRNA nodes and disease nodes, including miRNA–disease pairs with unknown associations, which helps to better explore potential miRNA–disease associations. In addition, hypernodes can self-learn node representations through networks, which can build higher-quality links between miRNAs and diseases to predict the association scores, instead of directly calculating the association scores by formulas. In addition, AMHMDA utilizes the attention mechanism to focus on the importance of different feature information, so as to obtain better-quality final node embeddings. Finally, we verified the ability of AMHMDA in miRNA–disease association identification through experiments.
However, AMHMDA is limited by some practical problems. On the one hand, the number of unknown associations is much larger than the number of known associations confirmed by experiments. It is of concern that experimentally confirmed negative samples for miRNA–disease association prediction are often difficultly to collect. Besides, current studies tend to randomly select negative samples in unknown associations, which can produce less satisfactory results. How to select reliable negative samples is not only a problem to be considered in miRNA–disease prediction, but also a problem to be considered in many biological studies. On the other hand, similarity score calculations are changeable and depend on known associations. For example, miRNA functional similarity and Gaussian interaction profile kernels similarity may be calculated in different ways or obtained from different databases in many studies. Different similarity scores will more or less affect the performance of the model. Due to the complexity of this problem, the similarity analysis we have done is only at a superficial level. Also, as described in previous studies, there is a lack of sufficient available data in the field of bioinformatics. And it is a challenging task to use the existing information to calculate similarity scores for miRNAs, diseases or other biological entities. In short, AMHMDA still needs improvement. How to obtain richer and more useful similarity information and how to learn high-quality characterization of miRNA–disease related margins are the next steps we need to consider.
In this paper, we propose a new calculation method based on graph convolutional networks combining with multi-view attention and hypernodes for miRNA–disease associations identification.
Multi-view similarities from multiple perspectives are integrated together to comprehensively describe the relationship between miRNA–miRNA and disease–disease.
The fusion of homogeneous network of miRNA–miRNA or disease–disease and heterogeneous network of miRNA and disease can deeply explore the representation of diseases and miRNAs.
In heterogeneous networks, we introduce some hypernodes to obtain high-quality miRNA–disease links and aggregate richer information of disease nodes and miRNA nodes.
Funding
Fundamental Research Funds for the Central Universities (313202225), Fundamental Research Funds for the Central Universities, JLU.
Data Availability
The implementation of AMHMDA and the data is available at https://github.com/ningq669/AMHMDA.
Author Biographies
Qiao Ning is a lecturer with the Department of Information Science and Technology, Dalian Maritime University, Dalian. Her research interests include machine learning and bioinforamtics.
Yaomiao Zhao is a postgraduate student at Dalian Maritime University. Her research work focuses on machine learning-based methods for gene sites identification and protein sites identification.
Jun Gao is a postgraduate student in information science and technology, Dalian Maritime University. Her research interests include disease and noncodingRNAs, protein sites prediction and semi-supervised learning.
Chen Chen received a B.S. and a PhD degree from Dalian University of Technology, Dalian, China. He is a lecture in Naval Architecture and Ocean Engineering college, Dalian Maritime University.
Xiang Li is an associate professor in Dalian Neusoft University of Information. Her research interests include machine learning and metaverse.
Tingting Li is an assistant research fellow in the Key Laboratory of Symbolic Computation and Knowledge Engineering of Ministry of Education, Jilin University.
Minghao Yin is a professor in information science and technology, Northeast Normal University. His research interests include data mining, swarm intelligence.
