


Abstract
Proteomic studies characterize the protein composition of complex biological samples. Despite recent advancements in mass spectrometry instrumentation and computational tools, low proteome coverage and interpretability remains a challenge. To address this, we developed Proteome Support Vector Enrichment (PROSE), a fast, scalable and lightweight pipeline for scoring proteins based on orthogonal gene co-expression network matrices. PROSE utilizes simple protein lists as input, generating a standard enrichment score for all proteins, including undetected ones. In our benchmark with 7 other candidate prioritization techniques, PROSE shows high accuracy in missing protein prediction, with scores correlating strongly to corresponding gene expression data. As a further proof-of-concept, we applied PROSE to a reanalysis of the Cancer Cell Line Encyclopedia proteomics dataset, where it captures key phenotypic features, including gene dependency. We lastly demonstrated its applicability on a breast cancer clinical dataset, showing clustering by annotated molecular subtype and identification of putative drivers of triple-negative breast cancer. PROSE is available as a user-friendly Python module from https://github.com/bwbio/PROSE.
Introduction
Practical challenges in proteomic analyses and interpretation
Proteomics, the high-throughput analysis of proteins in a sample, enables deep study of functional factors underlying a biological condition or phenotype [1, 2]. Liquid chromatography–tandem mass spectrometry (LC–MS/MS) is the most widely used technology in proteomics, supporting rapid and parallelizable analysis of complex biological samples [3]. In a typical proteomic experiment, sample proteins are first digested using a site-specific protease such as trypsin, followed by column-based separation of the resultant peptides, and spectral profiling of ionized peptides/fragments at the MS1 and MS2 (or higher) levels. Acquired spectra are then compared against theoretical spectra to obtain peptide-spectrum matches (PSMs). Confident PSMs, corresponding to component peptides of full-length proteins, are then used to determine and quantify present proteins in each sample.
Recent advances in proteomics have achieved improved ion discrimination [4–6], spectral capture [7, 8] and multiplexing capabilities [9–11]. Nevertheless, missing proteins are still common in many published proteomic datasets [12–15], hindering proper downstream analysis. This arises from a number of reasons, depending on the underlying paradigm. In Data-Dependent Acquisition (DDA), this is largely due to selection of only the highest intensity ions for fragmentation and analysis under MS2 [16]. While Data-Independent Acquisition (DIA) approaches (e.g. via isolation windows for ions [7, 8]) can greatly improve resolution, technical implementation and accurate deconvolution of multiplexed spectra in MS2+ is complicated [17]. Moreover, accurate imputation of these missing values, notably for proteins missing in all replicates, is especially challenging [12, 13]. Certain peptides are also inherently difficult to identify from their spectra, possibly due to extensive post-translational or other modifications (PTMs) [1, 18, 19]. Identifying modified peptides entails a large increase in search space and computational expense, though tools such as DIA-NN [20] are being explored to address this.
Nevertheless, there remains no clear consensus on how to approach these issues of peptide detectability (and hence, proteome coverage) beyond improving spectral capture. Furthermore, developing and deploying more sophisticated LC–MS(n) instrumentation is not always feasible due to high capital and operational costs. Another key consideration is how to handle already-published datasets; there is considerable interest in developing techniques that provide new insights from data generated under older technologies and acquisition paradigms.
Applying candidate prioritization approaches to proteomic data
Candidate gene/protein prioritization approaches show promise in overcoming these challenges. These methods generally use a set of seed elements to score and identify related partners based on similar biological context [21]. Some particularly useful examples of biological context include functional annotation and biological networks [22, 23]. In a biological network, distance or clustering metrics on co-expression or protein–protein interaction networks intuitively allow the identification of related pairs or groups of elements (e.g. functionally related proteins). Candidate prioritization tools that leverage such context, including the ToppGene suite [24] and MaxLink [25, 26], have previously been successful in identifying cancer-linked genes based on rudimentary seed lists. More recently, a benchmark of topology-based methods [27] highlighted the exceptional performance of network propagation techniques such as Random Walk with Restart (on heterogenous networks; RWRH) [28], as well as the network embedding approach Node2Vec [29] in identifying key genes in cerebral small vessel disease. Other approaches include functional class scoring, where individual sets of related network elements (or modules) are scored. For instance, our recent algorithm PROTREC [30], which uses the CORUM protein complexome [31] as functional annotations, was able to successfully recover missing proteins across replicates of HeLa lysates and solid cancer samples, using only protein lists as input.
We propose that candidate prioritization scores can represent stable and biologically meaningful (i.e. phenotype-specific) proteomic signatures [32, 33]. In principle, candidate prioritization techniques present certain key advantages when applied to proteomic analyses: they can be adapted to any instrumentation, are independent of spectra and can be applied to re-analysis of public proteomic datasets, including low-coverage samples. Given such potential, developing more powerful and flexible techniques that leverage biological context may prove highly valuable. However, to our knowledge, no candidate prioritization method explicitly incorporates information about missing proteins in the dataset, despite their informative value [14]. Furthermore, supervised learning approaches on co-expression networks have yet to be explored for either missing protein recovery or enrichment scoring of individual proteins.
In this vein, we developed Proteome Support Vector Enrichment (PROSE), an ensemble machine learning pipeline based on support vector machines (SVMs), for individual protein enrichment scoring against an orthogonal gene co-expression matrix. The resultant enrichment scores are analogous to those obtained via a network-based candidate prioritization approach. A simplified schematic of the analysis pipeline is provided in Figure 1. PROSE takes a simple list of identified (and optionally, unidentified) proteins in a sample as seed sets, before applying a supervised learning approach on a separate gene co-expression matrix, derived from public RNA-Seq data. PROSE outputs an enrichment score for each protein based on first-neighbor correlations (i.e. correlations between all elements in the matrix) [25]. We propose that these enrichment scores can be used as a useful heuristic for missing protein inference, functional analysis or prediction of expression levels. The input protein lists can be derived from a variety of sources, including peptide/protein identifications, relative quantification or differential expression data, allowing for flexible analyses. PROSE is made available as a user-friendly Python module (https://github.com/bwbio/PROSE).
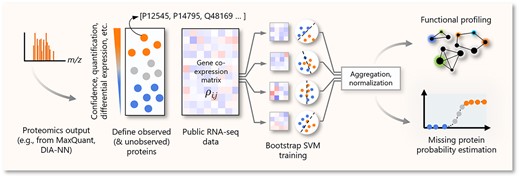
Simple schematic workflow of PROSE. Using simple protein lists, we train several weak SVMs on subsampled data from the corresponding gene co-expression matrix, using the lists as class labels. The distance between learned hyperplanes and each gene in the matrix is averaged and normalized to generate an enrichment score for each corresponding protein. These scores represent a network-based signature for the underlying proteome.
Results
PROSE accurately discriminates between observed and unobserved proteins
While specific correlations between gene and protein expression remain contentious [34], we reasoned that broad mRNA-protein correlations within tissues and cell lines are sufficient to capture conserved patterns of up/downregulation, especially for differentially expressed mRNAs [35]. This may reasonably correspond to the functional expression of individual proteins. As such, our basic implementation of PROSE works on a gene co-expression matrix, constructed from a RNA-seq atlas of 675 cancer cell lines by Klijn et al. [36].
To evaluate PROSE, we applied it to the Mehta et al. HeLa [37] and Li et al. THP1 macrophage [38] DDA datasets, where unique protein groups were reported with an FDR threshold of 0.01. For each replicate in both the HeLa and THP1 DDA datasets, ~3700 protein groups comprising a single protein were observed, whereas ~4300 were observed for the HeLa DIA dataset (Supplementary Figure 1). We excluded known housekeeper genes/proteins [39] from our analyses, reasoning that due to their high abundance, they are readily detected in most proteomic samples [40], and hence unlikely to be specific to a particular phenotype. We benchmarked PROSE against other candidate prioritization implementations that utilize only gene/protein lists, including a UMAP-KNN model, PROTREC, MaxLink, ToppGene, RWRH and Node2Vec (summarized in Table 1; Figure 2A). Further details on their implementation are included in Supplementary Methods. Across all datasets, all methods performed better than random. We observed that PROSE generally outperforms other methods in terms of auROC (mean auROC across replicates >0.8) and correlation to gene expression (mean Spearman correlation coefficient (ρ) across replicates ~0.6) (Figure 2B–D). However, correlation to protein expression is considerably lower (mean ρ ~ 0.3), while MaxLink performs better (mean ρ ~ 0.4).
Summary of benchmarked prioritization approaches
| Method | Approach | Original feature space | Feature space format | Biological features |
|---|---|---|---|---|
| PROSE | Nearest neighbor | Klijn et al. RNA-seq | Weighted adjacency matrix | Gene–gene co-expression |
| UMAP-KNN | Network embedding | Klijn et al. RNA-seq | UMAP embedding | Gene–gene co-expression |
| MaxLink | Nearest neighbor | FunCoup 5 | Network | Various, aggregated |
| RWRHa | Network propagation | Variousb | Het. network | Various |
| Node2Vecc | Network embedding | Variousb | Het. network | Various |
| ToppGened | Functional annotation | ToppGene portald | Functional annotaton | Various |
| PROTREC | Module scoring | CORUM | Protein sets | Protein complexes |
The feature space is derived from their original implementations, where possible.
aRWRH was applied as-is from the Zhang et al. benchmarking implementation.
bWe used the curated heterogenous network constructed by Zhang et al.
cNode2Vec embeddings on the Zhang et al. heterogenous network were generated with PecanPy and scored with cosine distance.
dToppGene is implemented through the eponymous webtool, using either default functional annotation groups or co-expression networks only.
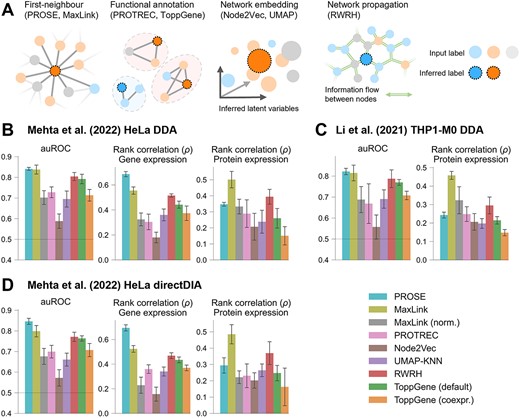
General performance of network approaches applied to DDA and DIA data. (A) Graphical summary of different approaches compared here. (B–D) For each dataset, models were supplied with a random sample of 2000 observed proteins (and 2000 random unobserved proteins for PROSE/KNN); 200 additional holdout proteins from each group were used to determine the area under the receiver operating characteristic curve (auROC) and correlation metrics. Proteins corresponding to annotated human housekeeper genes were excluded. For correlation to gene expression in HeLa, the transcripts per million (TPM) data from the Klijn et al. (2015) dataset were used. Values shown as mean ± SD. (B) Performance for the HeLa DDA dataset (n = 4 replicates). (C) Performance for the THP1-M0 macrophage dataset (n = 3 replicates). (D) Performance for the HeLa directDIA dataset (n = 4 replicates).
Node2Vec demonstrated the lowest overall performance, which may indicate that this specific embedding is not suitable for our task, despite its previous success [27]. PROSE shows a slight improvement over ToppGene (default implementation) and RWRH, and substantial improvement over ToppGene (co-expression features only), PROTREC and the UMAP-KNN model. Interestingly, PROSE performs comparably with MaxLink, despite its rudimentary approach (where it simply counts the number of edges between a candidate protein and its seed neighbors in the FunCoup network [41]). It was likewise found to outperform more sophisticated methods in detecting disease-associated candidates in another benchmark [21]. However, this may be a result of overrepresentation of highly connected proteins. To investigate further, we re-evaluated MaxLink by adjusting the score of each protein by divided by its respective degree in the FunCoup network, obtaining observed/expected ratios [41]. The resultant decrease in performance (mean auROC from ~0.8 to >0.7 following adjustment) indeed suggests some level of bias for highly connected proteins, which may be addressed by filtering out highly connected nodes, such as those in previous implementations [21, 25]. However, this conservative measure would lead to a considerable decrease in evaluated proteins and, hence, was not applied here.
Repeating the analysis by including known housekeepers did not result in a substantial change in performance for any method (Supplementary Figure 2). PROSE scores are also stable across runs within and across technical replicates (for k = 200 bootstraps, Pearson’s r > 0.96 between replicates, >0.98 within a replicate; see Supplementary Figure 3), supporting their use in generalizable phenotypic characterization. To understand how PROSE performs under various protein dropout scenarios, we repeated the analysis using 1500, 1000, 500, 200 and 100 training proteins. Under simulated random dropout (Supplementary Figure 4), PROSE outperforms other methods in terms of auROC, for 500 or more training proteins, except MaxLink in the THP-1 dataset, where they perform comparably. Another scenario to consider is left-censored data, where low-abundance proteins are not detected, which generally results in detection of the top n proteins by MS signal. Under this simulation (Supplementary Figure 5), all methods except UMAP-KNN appear to perform better by all metrics when supplied with fewer training proteins. Furthermore, performance is broadly improved compared with when trained on randomly sampled proteins, suggesting that important phenotype-specific information may be captured by a few highly expressed non-housekeeper proteins. In all cases, PROSE performs comparably with RWRH and MaxLink (mean auROC >0.85) and has higher correlation to gene expression (mean ρ > 0.7).
PROSE scores capture phenotype-specific features
To visualize the specificity of PROSE scores for the source phenotype, we visualized the correlation of HeLa PROSE scores with corresponding HeLa gene expression (as TPM) and protein expression (as iBAQ) data (Figure 3A) previously reported by Bekker-Jensen et al. [42]. Observed proteins have high PROSE scores, corresponding TPM counts, and iBAQ levels compared with unobserved proteins, most notably producing a positive correlation between PROSE scores and TPM. In contrast, high PROSE scores in HeLa do not correlate strongly to gene expression in a morphologically unrelated NCI-H345 small cell lung carcinoma line. Hence, proteins with high PROSE scores have good transcriptomic and proteomic support for their existence, even if they are not explicitly observed in a given proteomic screen. Generally, we observe that correlations between PROSE score and TPM are highest for cell lines originating from tissues of similar morphology to the uterine cervix epithelium (Figure 3B) and lowest for blood/lung due to their distinct transcriptomic niche [43]. The relatively high rank correlation across all tissues (~>0.5) likely represents a basal proteome/transcriptome composition across human cells. Overall, these results suggest that PROSE accurately captures these phenotypic features.
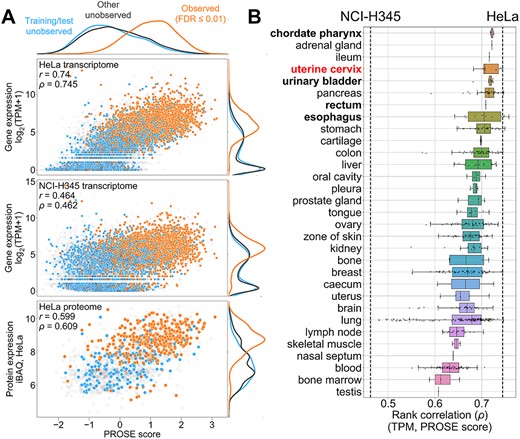
Further visualization of proteome/transcriptome correlations with PROSE scores. HeLa DDA replicate R1 (from Figure 2) is used as a representative example. (A) Correlation between HeLa PROSE score and underlying transcriptome from HeLa versus the unrelated NCI-H345 small cell lung carcinoma transcriptome, as well as independent iBAQ levels from the Bekker-Jensen et al. (2017) HeLa proteome. Linear (Pearson’s r) and rank (Spearman’s ρ) correlations are annotated. (B) Correlation between PROSE score and transcriptome, aggregated by tissues. The source HeLa tissue (uterine cervix) is highlighted in red. Examples of tissues with cancer cell lines of broadly similar epithelial morphology to HeLa are bolded.
We subsequently considered if this phenotypic specificity could be leveraged to predict missing proteins. We considered the set of proteins observed in the HeLa DIA data but missing in the DDA data and compared it to those specific to THP1 samples only (Supplementary Figure 6A and B). We observed that, under both the random and non-random dropout scenarios, class probabilities inferred by PROSE using a logistic regression model allow strong discrimination between HeLa-specific missing proteins and THP1-specific proteins. Further correlative analyses demonstrate that PROSE scores are more strongly correlated to phenotype than acquisition method, with HeLa DDA and DIA clustering together, distinctly from THP1 (Supplementary Figures 7 and 8), as compared with MaxLink and RWRH.
Reanalysis of the CCLE proteomics dataset preserves key biological features
To further assess PROSE scores as a potential heuristic, we applied it to the Cancer Cell Line Encyclopedia (CCLE) proteomics dataset [44], which quantifies individual proteins between cancer cell lines derived using a tandem mass tagging (TMT) approach. These quants represent relative expression between individual samples in a multiplex and contain extensive missing proteins across various cell lines [45]. We used two paradigms for the generation of our high- and low-confidence protein lists from this data (Figure 4A). Paradigm P1 only considers proteins that were quantified within a multiplex (i.e. confidently identified in at least one cell line in the multiplex), while paradigm P2 accounts for unquantified proteins by also including those with missing quantitation. We observed that PROSE performs well under both paradigms (Supplementary Figure 9), though PROSE is noticeably better at discriminating differentially expressed proteins (mean P1 auROC = 0.883, P2 auROC = 0.809). Nevertheless, under both paradigms, we observed near-identical clustering patterns based on PROSE scores, showing clear tissue specificity (Figure 4B and C). Interestingly, we observed that P1 produced strongly differential and generally tissue-specific correlations (Figure 4D–F) between PROSE scores and gene/protein expression, whereas P2 produced weaker differential effects (Figure 4G–I), but preserving similar patterns to P1. This may be because P2 essentially considers lists of expressed and non-expressed proteins, whereas P1 focuses on relatively up/downregulated elements. As discussed in our above HeLa analyses (c.f. Figure 3), P2 may therefore capture a basal proteomic/transcriptomic composition.
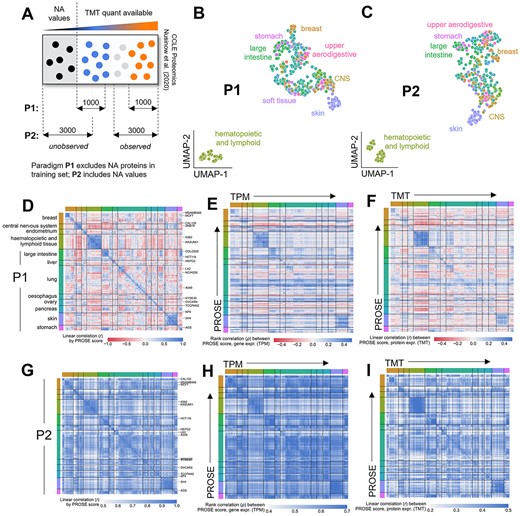
Reanalysis of the CCLE proteomic dataset captures cell line- and tissue-specific biological features. (A) Definition of observed and unobserved protein lists from the dataset. Paradigm P1 only considers detected, differentially expressed proteins. Paradigm P2 additionally considers undetected proteins in the dataset. (B, C) Clustering of cell lines by PROSE score under paradigm P1 or P2 produces essentially identical tissue-specific patterns. (D–F) Correlation of PROSE scores and matched transcriptome or proteome across cell lines under Paradigm P1. The clustering from panel D is used throughout (clustering here was performed within tissue of origin). (G–I) As before, but under paradigm P2. The clustering from panel G is used throughout.
We subsequently evaluated PROSE’s ability in differentiating essential and non-essential proteins (Figure 5A), a crucial biological feature in the identification of potential therapeutic targets. We defined essential proteins here as those with a 95th percentile or higher dependency score, derived from the DEMETER2-corrected DRIVE deep RNAi screen. Here, the separability of the cumulative score distributions of high- and low-dependency proteins was measured with the Kolmogorov–Smirnov distance statistic (DKS, Figure 5B). We observed that, within a cell line, essential proteins were not readily separable using TMT quants (mean DKS = 0.131) or PROSE under paradigm P1 (DKS = 0.126), whereas P2 produced clear separability (DKS = 0.432). We visualized the underlying PROSE score distributions in the THP1 and MCF7 cell lines (Figure 5C), demonstrating that essential genes have higher PROSE P2 scores. This suggests that P2 can effectively generate a meaningful intra-sample distribution from relative quants that reflects actual upregulation of essential proteins, despite slightly lower class separation, as measured by the auROC previously.
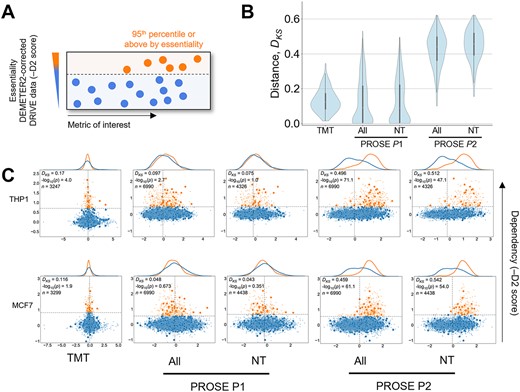
Separation of high-dependency proteins under paradigm P2. (A) High-dependency proteins, defined here as those in the top 95th percentile or above by -DEMETER2 score, derived from the DRIVE deep shRNA screen for gene dependencies across cancer cell lines. (B) Separation of high-dependency and low-dependency protein score distributions, measured by the Kolmogorov–Smirnov test statistic DKS. Values closer to 0 indicate no distance between empirical cumulative distributions, while values closer to 1 indicate strong separability. The non-training (NT) subset shows a similar distribution. Known cancer-associated genes are represented by larger opaque dots on the scatterplot. (C) Visualization of high-dependency and low-dependency protein distributions under TMT quants or PROSE scoring paradigms. Two common cell lines, THP1 and MCF7, are shown as examples. In the upper-left corner, the corresponding P-value is shown alongside the DKS. n represents the number of quantified proteins with available DEMETER2 scores.
Reanalysis of the CPTAC breast cancer proteome dataset highlights subtype-specific expression programs
Lastly, we explored if PROSE could be applied to the analysis of clinical proteomics data. Here, we reanalyzed the CPTAC breast cancer proteomics dataset [46], comprising TMT quants of 122 clinical specimens. In the original analysis, Krug et al. applied a non-negative matrix factorization (NMF) approach on the integrated proteogenomic data to assign molecular subtypes to individual samples. The resultant NMF clusters represent HER2-positive, Luminal A, Luminal B and basal-like (triple-negative breast cancer; TNBV) molecular profiles.
Akin to Paradigm P1 applied to the CCLE dataset, for each sample, we considered the top and bottom 1000 proteins by TMT quant to identify differential expression programs. Compared with the CCLE data, overall accuracy is lower (mean auROC = 0.778) (Supplementary Figure 10). We observed clear clustering of samples by their annotated NMF subtype (Figure 6A and B). Proteins with high subtype-specific PROSE scores can be identified based on the top proteins by variance (5000 shown here) (Figure 6C), of which 1677 proteins were initially undetected in the original screen. We then considered if PROSE scores could be used to recover functional enrichment scores obtained through commonly used tools such as Gene Set Enrichment Analysis (GSEA) [47]. We applied GSEA to generate normalized enrichment scores (NES) for MSigDB_Hallmark_2020 gene sets [48], which represent distinct, well-defined biological processes (Figure 6D).
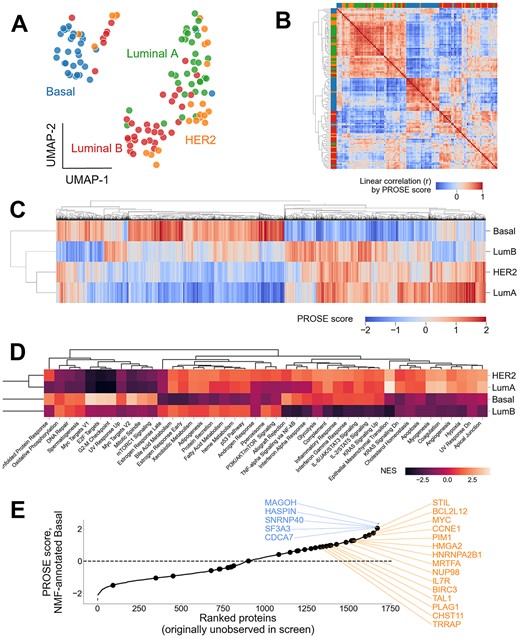
PROSE supports recovery of known and novel, putative disease-linked proteins that are undetected in the initial proteomic screen. PROSE scoring was applied to the CPTAC breast cancer TMT dataset by Krug et al. (2020) and used to predict regulatory programs and missing proteins. (A, B) UMAP projection and heatmap demonstrating clustering of breast cancer subtypes by their inferred NMF label from the original dataset. HER2-positive breast cancer represents a particularly heterogenous population. (C) Mean PROSE scores of the top 5000 highest-variance proteins. The 2357 proteins with high-variance PROSE scores that were undetected in the initial proteomic screen are annotated above as black ticks. (D) GSEA using the above 5000 proteins, using MSigDB_Hallmark_2020 annotations, retaining well-established signatures for each subtype. (E) Mean PROSE scores of undetected genes with putative driver roles in the Basal-like/triple-negative (TN) subtype. Example annotated oncogenes are shown in orange (right) and are represented by larger dots. Example genes without annotated roles in cancer are shown in blue (left).
As previously observed, PROSE scores likewise result in distinct NES profiles for each subtype, including terms linked to high transcriptional and replicative activity observed in TNBC (e.g. high NES scores for the Myc and E2F target annotations). We further show specific recovery of proteins known to be associated with TNBC, such as MYC [49, 50], HMGA2 [51] and those related to tumorigenic signalling (e.g. mTOR) [52]. Additionally, we observed proteins without well-understood roles in TNBC (e.g. MAGOH), which may be interesting for further study. Overall, this analysis further supports the use of PROSE when applied to TMT-based relative expression data.
Discussion
Given the frequent coverage issues observed in proteomics, we find that candidate prioritization approaches based on biological networks can generate biologically meaningful scores—in particular for missing proteins. We applied PROSE scores to complement the basic proteomic workflow, where it can inform missing protein prediction and downstream analyses. The simplicity and fast running time (~10 s with <0.8 GB memory on a standard laptop computer, for k = 200 bootstrap samples) makes PROSE particularly useful for biologists with rudimentary Python programing knowledge, and a user-friendly webtool implementation is in development. While we focused on creating protein lists based on observed/unobserved peptides as well as relative quants, these input lists are flexible and could also be generated from transcriptomic data or other proteomic assay designs.
Limitations
Our current implementation of PROSE is limited to a co-expression matrix derived from transcriptomic data, which may explain its stronger correlation to gene expression compared with protein expression. One key issue to consider when using such candidate prioritization approaches is that the results are idiosyncratic to the feature space used. For example, it is not clear that our co-expression matrix derived from a panel of cancer cell lines generalizes well to clinical samples: since networks show high cell-type specificity [53], a heterogenous tissue might have network dynamics that we are unable to capture. We speculate that this may be the reason for poorer auROC during analysis of the breast cancer dataset compared with the CCLE dataset. While in the future, using a richer feature space (e.g. by adding functional annotations to create a heterogenous network), there is unlikely to be a ‘one size fits all’ solution when applying candidate prioritization approaches to diverse proteomic data.
Additionally, PROSE is currently limited to scoring protein identifications. However, in the future, it can plausibly be extended to predicting more complex features, such as PTMs, if supplied with a correlation matrix on both PTM identifications and protein quants.
Finally, it is also important to note that PROSE does not consider explicit network topology outside of first-neighbor relations (similar to MaxLink), though this does not appear essential to the performance of the model. More sophisticated extensions that leverage network topology could in principle better capture local connectivity patterns, which may lead to further improvements in performance. For instance, reducing dependency of class labels on first neighbors in the network may improve the robustness of a model for sparse datasets.
Materials and methods
Gene co-expression matrix construction
The Klijn et al. dataset [36], comprising RNA-Seq results for 675 common cancer cell lines, was downloaded as TPM values from ArrayExpress [54] (https://www.ebi.ac.uk/arrayexpress/) under the accession number E-MTAB-2706. The original 35 522 gene identifiers were converted to UniProt IDs where possible, with only protein-coding genes retained. Genes with consistently low expression (median TPM < 1) were excluded due to low signal-to-noise ratio. A co-expression matrix was obtained by calculating the Spearman correlation coefficient ρij for all gene pairs (i, j). To constrain the feature space to a tight set of panel genes, we selected only those with high variability in expression and co-regulation. These were defined as the top 25% of genes ranked by coefficient of variation (CV; of TPM), as well as standard deviation of correlation coefficients, yielding 1216 panel genes (Supplementary Figure 11A) [32]. We verified that the panel genes enabled distinct clustering of cell lines by tissue origin via visual inspection of UMAP plots (Supplementary Figure 11B) and heatmaps of gene expression profiles (Supplementary Figure 11C and D). The resultant 17 054 × 1216 matrix is an array of protein identifiers with associated Spearman correlations to each panel gene. The matrix is provided in Supplementary File 1. For subsequent comparisons between PROSE scores and gene expression, TPM values were log2 transformed using a pseudocount of 1.
Prose
The core of the PROSE module is built from the scikit.learn [55] Python library. Using a list of positive (observed) proteins, negative (unobserved) proteins and the gene co-expression matrix above, PROSE returns a table containing a list of these proteins, their associated PROSE scores, predicted labels and their logistic regression probabilities.
In the basic implementation, we define observed proteins as those reported from a proteomic screen at a given protein-level FDR threshold (1% is a general standard). To avoid issues with ambiguous protein groups, we only consider those mapping to a single protein accession. An equal number of unobserved proteins are randomly sampled from the UniProt database. If the size of the supplied observed/unobserved protein lists differ, individual elements are re-weighted by the inverse of their class proportion.
An ensemble of linear SVMs is applied to generate hyperplanes separating the observed/unobserved based on their correlation to the panel genes. Via the LIBLINEAR [56] implementation, each SVM solves the primal problem
Where w is a vector of weights, Xi and yi are the feature values and the corresponding label for each training protein i, C is a penalty hyperparameter (default = 1), b is the hyperplane constant and L is the L1 hinge loss function
To enhance stability while reducing overfitting and computational expense, a bagging approach [57] was used to generate a series of weak learners. In the default implementation, k sub-classifiers are trained on a bootstrap sample of 100 proteins drawn from each class, under 50 panel genes. By default, k = 200 bootstrap samples are used. Bagging renders PROSE scalable to any number of panel genes and observations, as for any k subsets of fixed dimensions, the running time is essentially the same regardless of the input matrix size. This could for instance be useful when considering a transcript-level co-expression network. However, to ensure that critical features are being captured by the sampling procedure, it may be necessary to increase k alongside the matrix size. Alternatively, the highest variance panel genes/transcripts can be selected beforehand, as we have done here.
Formally, the decision function g(i) for a given protein i is defined as the mean signed distance between the hyperplanes and the point of interest
where g(i) > 0 represents positive classes, while g(i) < 0 represents the null class. For standardization, we provide the final PROSE enrichment scores as Z-scores
where μ and σ are the mean and standard deviation over the set of all tested proteins in the co-expression matrix. The ranked output score vector is generally sufficient for functional analyses of phenotype. Class probabilities are estimated via logistic regression on score(i) for class prediction, where protein probability is estimated via 5-fold cross validation. Performance was evaluated on a set of 200 additional holdout proteins per. For correlation analyses between the HeLa PROSE scores and gene expression, the TPM data from Klijn et al. (2015) were used. For correlation analyses on protein expression, the corresponding MaxQuant or DIA-NN quantification output was used. A subsequent correlative analysis was applied to the independent HeLa iBAQ data previously reported from a deep proteomic screen by Bekker Jensen et al. (2017) [42].
Alternative benchmark approaches
In addition to PROSE, we considered the performance of other network models, including a k-nearest neighbor (KNN) approach on the UMAP-transformed co-expression matrix, PROTREC [30], ToppGene [24], RWRH [28], Node2Vec [29] and MaxLink [25, 26]. PROTREC and MaxLink were implemented as described originally. RWRH was implemented as in the gp-tools suite by Zhang et al. [27]. Node2Vec was implemented through PecanPy [58]. For details of each implementation, please refer to Supplementary Methods.
Proteomic datasets
HeLa label-free DDA and DIA
The Mehta et al. (2022) dataset [37] comprises commercially available HeLa digest standards in quadruplicate, run on an Orbitrap Fusion Lumos Tribrid instrument under DDA mode. Samples were run without offline fractionation. Raw data were downloaded from the PRIDE database [59] (https://www.ebi.ac.uk/pride/; accession number PXD022448).
THP-1 macrophage label-free DDA
The Li et al. (2020) dataset [38] comprises PMA-treated THP-1 cells (M0 macrophages) in triplicate, run on an Orbitrap Fusion Lumos Tribrid instrument under DDA mode. Samples were run without offline fractionation. Raw data were downloaded from PRIDE (accession number PXD019800).
CCLE TMT
The Nusinow et al. (2020) dataset [44, 45] comprises a phenotypically diverse panel of 375 CCLE cancer cell lines. Each TMT10 multiplex comprises 9 samples and a bridge channel (a pool of various cell lines) to facilitate normalization across plexes. Each multiplex was fractionated by basic reverse-phase chromatography (bRP) and fractions were run on either an Orbitrap Fusion or Fusion Lumos Tribrid instrument. Spectra in the study were searched using SEQUEST, followed by FDR refinement by linear discriminant analysis and additional filtering, reporting proteins at a 1% protein-level FDR. Protein lists with normalized TMT quants were downloaded from https://gygi.hms.harvard.edu/publications/ccle.html. For each cell line, protein identifications were obtained via parsimonious assembly within the multiplexed sample without imputation, and the assembly displays a wide number of missing proteins [45]. PROSE scores for the CCLE proteomics dataset are provided as Supplementary File 3.
CPTAC breast cancer clinical specimen TMT
The Krug et al. (2020) dataset [46] comprises 122 clinical breast cancer samples representing several well-established molecular subtypes. Similar to above, each TMT10 multiplex comprises 9 samples and a bridge channel (a pool of tumor samples). Each multiplex was fractionated by bRP and run on a Q exactive or Orbitrap Fusion Lumos Tribrid instrument. The normalized TMT data were downloaded directly from the study Supplementary Material (https://doi.org/10.1016%2Fj.cell.2020.10.036). PROSE scores for the CPTAC dataset are provided as Supplementary File 4.
Raw proteomic data processing
Raw label-free DDA data were processed using MaxQuant 2.2.0 [60]. Spectra were searched against the set of reviewed human UniProt sequences (SwissProt; UP000005640). Unique protein groups (MaxQuant) were reported using a 1% FDR cutoff. Carbamidomethylation (C) was set as a fixed modification, while oxidation (M) was set as a variable modification. For protein quantitation using MaxQuant, the match between runs (MBRs) option was disabled. Proteins were quantified using the iBAQ approach with log iBAQ correction. Default parameters were used otherwise.
Raw label-free DIA data were processed using DIA-NN 1.8.1 [20]. The spectral library was generated in silico from the set of SwissProt sequences above using the inbuilt deep learning approach with default parameters. Protein groups were reported using a 1% FDR cutoff. Carbamidomethylation (C) was set as a fixed modification, while oxidation (M) and acetylation (N-term) was set as a variable modification. The ‘unrelated runs’ option was enabled and MBR was disabled. Default parameters were used otherwise.
For downstream analyses, housekeeper genes/proteins were defined based on the HRT Atlas v1.0 database [39] and included or excluded in the analyses as stated.
CCLE analyses
PROSE scoring was performed on the CCLE proteomics dataset. Only SwissProt proteins were considered. Observed and unobserved subsets were generated based on intra-sample TMT quants. Note that while these quants were previously found to correlate to gene expression levels [44], they specifically measure protein expression relative to other samples in the multiplex.
For correlation analysis to RNA-Seq, we used the mRNA expression data from Barretina et al. [43]. Data were downloaded from ArrayExpress (accession number E-MTAB-2770). Further analyses were performed on the DRIVE shRNA data from McDonald et al. [61], which comprises deep RNAi screens for gene dependencies in 398 cancer cell lines. We used DEMETER2-adjusted scores from McFarland et al. [62] as highly accurate estimates of gene dependency. Data were downloaded from https://figshare.com/articles/dataset/DEMETER2_data/6025238. For simplicity, gene dependence is defined as the negative of the DEMETER2 score (higher dependence indicates essentiality). Cancer-linked genes were annotated using the Sanger COSMIC Cancer Gene Census [63]. Our analyses generally focused on cell lines occurring across these datasets.
Gene set enrichment analysis
GSEA was performed on the PROSE scores generated from the CPTAC breast cancer dataset, using ranked lists of the top 5000 highest variance proteins by PROSE score. The MSigDB_Hallmark_2020 gene sets [48] were used. GSEA was implemented through the GSEApy module [64] with default parameters.
Generic analyses
All analyses were performed in a Python 3.8 environment except where otherwise noted. Plotting and visualization was performed using the matplotlib [65] and seaborn [66] libraries. The Kolmogorov–Smirnov distance statistic DKS was calculated using the scipy [67] library. UMAP clustering was performed with the umap [68] library.
Network-based candidate prioritization techniques offer a promising approach to analysis of sparse proteomic data.
PROSE leverages co-expression patterns from public transcriptomic data to reliably discriminate between observed and unobserved proteins in a proteomic screen.
Resultant scores can recapitulate key phenotypic features including expression patterns, gene dependency and putative driver genes in disease.
PROSE can be applied to protein lists generated under different paradigms (e.g. DDA/DIA proteomes ranked by FDR or expression; label-based DDA ranked by relative expression).
Acknowledgements
Any opinions, findings and conclusions or recommendations expressed in this material are those of the author(s) and do not reflect the views of National Research Foundation, Singapore. We thank Dr Sunny Hei Wong for our discussions. We wish to acknowledge the funding support for this project from Nanyang Technological University under the URECA Undergraduate Research Program.
Funding
National Research Foundation, Singapore (SDSC-2020-005).
Authors’ contributions
B.J.H.W. conceptualized and developed PROSE. B.J.H.W. and W.K. implemented the analyses and benchmarked the tools. B.J.H.W. and W.W.B.G. co-wrote the manuscript. B.J.H.W., W.K., H.P. and W.W.B.G. edited. W.W.B.G. supervised.
Data availability
The PROSE source code and key code used in our analyses are available at https://github.com/bwbio/PROSE, which also contains installation and example run instructions. Other data are provided as Supplementary Files 1–4. All other data and code are available from the authors upon reasonable request.
Author Biographies
Bertrand Jern Han Wong received his BSc in biological sciences from Nanyang Technological University. He is currently a Biomedical Science doctoral student at Harvard University. His work under Wilson Wen Bin Goh focused on network-centric, statistical and machine learning approaches to resolving challenges in proteomic analyses.
Weijia Kong received her BSc from Beijing Normal University. She is currently a Bioinformatics doctoral student at Nanyang Technological University. Her current work under Wilson Wen Bin Goh focuses on missing protein prediction and validation using biological networks.
Hui Peng is a research scientist at the School of Biological Sciences. His current work under Wilson Wen Bin Goh is concerned with network-assisted protein assembly and automated pipeline development.
Wilson Wen Bin Goh is an Assistant Professor of Biomedical Informatics and Head of the Data Science Research Programme at the Lee Kong Chian School of Medicine and School of Biological Sciences, Nanyang Technological University.
